
Report Templates per Audience: Ops, Management, Clients, Auditors
The same number means different things to different people. To you, "the file server was down for forty minutes on Tuesday" is a fact with a cause and a fix. To your manager it is a question about whether the team met its commitments this month. To a client it is an interruption to their business and a line in their service agreement. To an auditor it is evidence that a control detected a failure and that someone responded. One event, four readers, four different reports. The most common mistake in IT reporting is sending all four the same one.
The temptation is to build one big report and hope everyone finds their part. Nobody does. Ops readers scroll past the cost framing. Management stops at the first table of interface counters. Clients are alarmed by problems at sites that are not theirs. And the auditor asks for something else entirely. The fix is not four times the work. It is one computation of the numbers, rendered four ways, each rendering shaped by the question its reader is asking.
This guide gives you those four templates, section by section, as tables you can copy. It also gives you the shared skeleton underneath them and the one-page rule for anyone above the ops team. And — just as important — it gives you a list of what to leave out of each. By the end you will be able to take a single set of monitoring data and produce a report that each audience reads to the end.
In this guide
- One data source, four readers
- The shared skeleton
- The one-page rule
- Template: operations
- Template: management
- Template: clients
- Template: auditors
- What not to put in each
- Producing all four from one computation
- Where to go next
One data source, four readers
Start by being clear about what the monitoring system actually knows. It holds a history of availability (which checks passed and failed, and when). It holds a history of performance (CPU, memory, disk, interface traffic, response times). It holds a log of alerts (what fired, when, and when it cleared). And it holds a record of what exists (devices, interfaces, services, and the changes to them). Everything any of the four audiences asks for is some slice, sum, or trend of those four histories. There is no separate "management data" or "audit data." There is one data set and four questions.
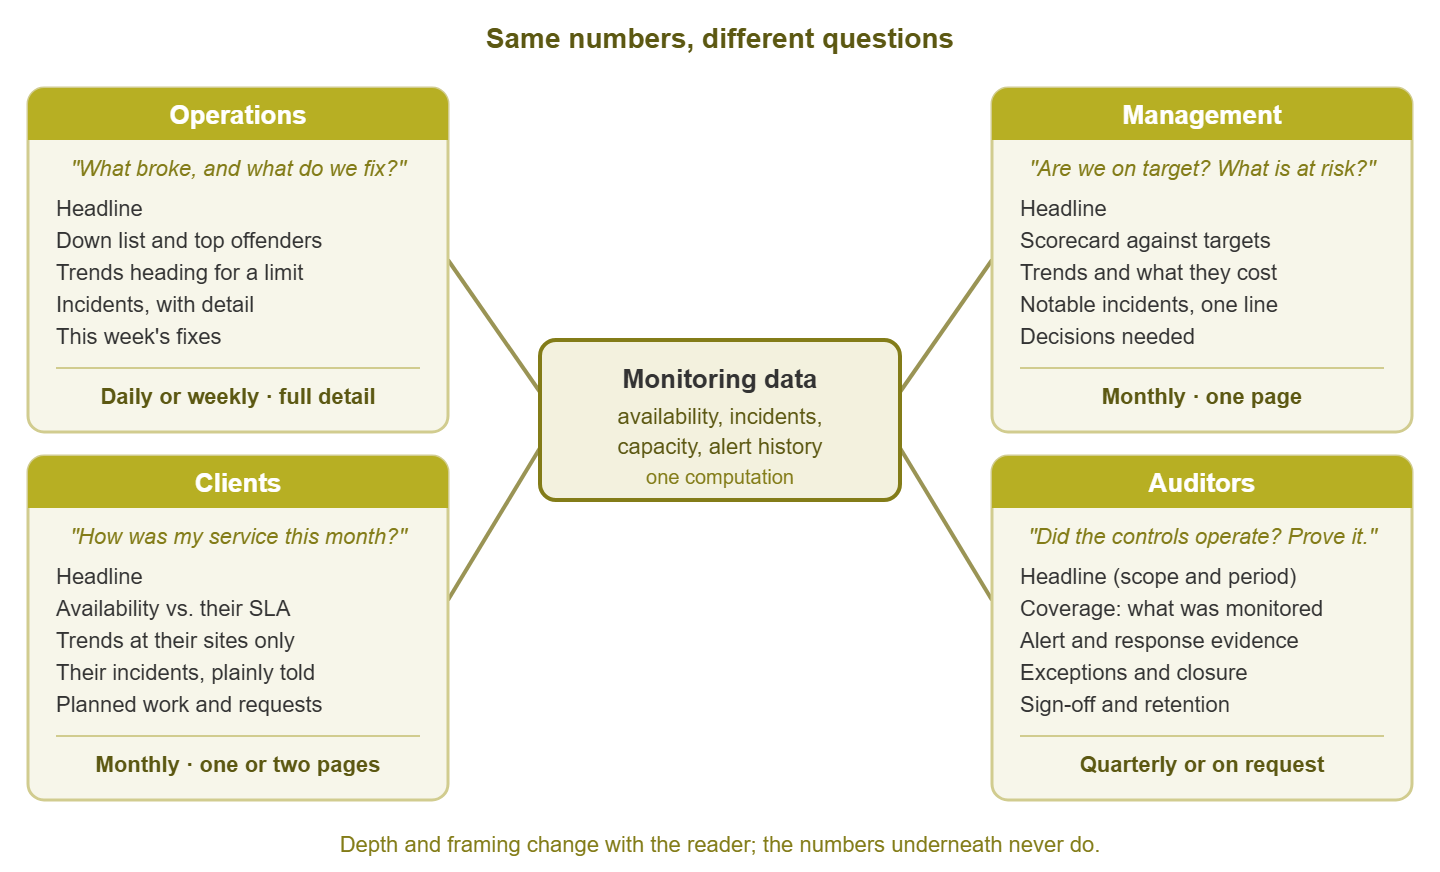
Figure 1: One computation of the numbers, rendered four ways. The depth and framing change with the reader; the figures underneath do not.
The four questions are worth stating plainly, because each template is just the shortest honest answer to its question:
- Operations asks: what broke, what is trending toward breaking, and what should we fix this week? They want detail, they want it often, and they will act on it themselves.
- Management asks: are we meeting our commitments, what is at risk, and what will it cost? They want one page, once a month, and they will act by approving, prioritizing, or asking a harder question.
- Clients ask: how was my service, what happened to my systems, and did you meet what you promised me? They want reassurance backed by numbers, and nothing about anyone else.
- Auditors ask: did the controls you claim to operate actually operate during the period, and can you prove it? They want completeness and traceability, and they are the one audience for whom "long" is not a criticism.
Notice that the ops question is about things, and the management question is about commitments. The client question is about them, and the auditor question is about proof. Keep that in mind and most template decisions make themselves.
The shared skeleton
All four templates share one skeleton. Learn it once and every report you ever write will have somewhere to put each fact:
- Headline. One or two sentences that answer the reader's question directly. "All commitments met this month; one capacity risk needs a decision." If the reader stops here, they should still know the answer.
- Key numbers. These are the handful of figures that support the headline. Put each next to its target or its previous value so the reader can tell whether it is good.
- Trends. Where those numbers are heading. This period against the last few, not a single snapshot.
- Incidents. What went wrong, at the depth appropriate to the reader.
- Actions. What is being done, what is being asked for, and what the reader needs to decide.
The skeleton is the same for everyone. What changes is the depth at each section and the vocabulary. Ops gets a full incident table. Management gets one line per notable incident. Clients get their incidents only, in plain words. Auditors get every incident with its detection time, response time, and closure evidence. Same section, same underlying rows, four different renderings. (Nobody gets all four, not even the person who asked for all four.)
The one-page rule
Here is the rule that does the most good per word: anyone above the ops team gets one page. Not "one page plus appendices they can skip" — one page, with the answer in the first sentence, and a link or an offer to see more. Management readers are not lazy; they are reading twenty other one-page reports the same morning. A report that needs scrolling gets skimmed rather than read. Clients are similar: they want to know they are fine, and a long report makes them wonder what is buried in it.
The rule forces good decisions. If the management report cannot fit on a page, you have not decided what matters. If a client report runs long, you are probably showing them things about your infrastructure rather than about their service. Ops reports and audit reports are exempt — ops because they will use every row, auditors because completeness is the point. But even those benefit from a one-paragraph summary at the top.
At Harbourview Clinic the monthly report was one document for everyone: eleven pages, opening with a table of interface counters. It was sent to the practice manager, the IT team, and the external auditor alike. The practice manager's reply, for a year and a half, was "thanks". The auditor asked for something else. The one figure the practice manager needed, storage headroom on the imaging server, was on page nine. The purchase it should have prompted was approved a quarter late. The report now comes in four renderings from one computation, and the management one is a single page that ends with a question. She answers it.
Tip: write the headline sentence last, after the numbers are in, but put it first. It is the one part of the report that cannot be automated well. That is because it requires judgment: "fine," "fine but watch the disk," or "not fine." If your report is fully automated, generate a factual headline from the numbers ("all monitored services met their availability target"). For that report, add a human sentence only when something needs saying.
Template: operations
The ops report is the one you write for yourself and your team. Its cadence is daily (short, what changed overnight) or weekly (longer, what to fix this week). Detail is welcome, because every row is something someone on the team might act on. The reader already understands the vocabulary, so use it: interface names, hostnames, threshold values.
| Section | Content | Depth |
|---|---|---|
| Headline | Two sentences: anything down now, and the theme of the period ("mostly quiet; disk on the mail server is the story") | Short |
| Down list | Every device or service that was down during the period, with start, end, duration, and whether it alerted | Full table |
| Top offenders | The devices with the most alerts or the most downtime, ranked | Top ten |
| Trends | Any metric that crossed a warning threshold, or is on course to within a month: disk, interface utilization, memory, response time | One chart or line per item |
| Incidents | Each incident with timeline, cause where known, and the fix applied or pending | Full detail |
| What changed | New devices discovered, interfaces added or removed, thresholds edited, checks added | Full list |
| Actions | The fix list for the week, with an owner per item | Checklist |
The ops template is the only one where a long table is welcome. It is also the natural home for anything the other reports omit. When management asks "why did that happen?", the answer is already in the ops version, and you can forward it.
Template: management
The management report is about commitments. Its reader is deciding whether to worry, whether to spend, and what to tell their own boss. Monthly is the right cadence; weekly is too often for decisions that take a month to matter. The whole report fits on one page, and the first sentence is the verdict.
The centerpiece is a short set of headline figures, each shown against its target and its recent history. This is the scorecard idea — a handful of agreed measures, presented the same way every time. If you want a worked design for one, the network health scorecard is the place to look. Here, the point is that the scorecard occupies the key-numbers slot of the skeleton and nothing else competes with it.
| Section | Content | Depth |
|---|---|---|
| Headline | One sentence: commitments met or not, and the single biggest risk if any | One sentence |
| Scorecard | Four to six measures (availability of key services, incident count, time to resolve, capacity headroom) each with target, this month, and last three months | One small table |
| Trends | Anything heading toward a limit, expressed as "months until" and what it will cost to address | Two or three lines |
| Notable incidents | Only incidents users noticed. One line each: what, how long, impact in plain terms, fixed or not | One line each |
| Decisions needed | Specific asks: approve a purchase, accept a risk, prioritize a project | Bullets with a deadline |
| Where to see more | A link to the ops report or dashboard for anyone who wants detail | One line |
Two habits make this template work. First, express availability as time lost as well as a percentage: "three hours of email downtime" lands in a way that a decimal does not. Second, make the decisions section real. A management report that never asks for anything trains its reader that it never needs a response. And a report that does not need a response is a report on its way to being unread.
Template: clients
If you support other organizations, every client expects a periodic statement of their service. The essential discipline is scope: the client report contains their systems, their sites, their incidents, and their agreed levels — and absolutely nothing about anyone else's. A client who sees another client's outage in their report has just learned two things they should not know. And a client who sees your internal capacity worries will start asking about them.
Cadence is usually monthly and often fixed by contract, as is the format. The report is short — one or two pages — written in plain language. Its tone is that of a service provider accounting for a service, not an engineer explaining a network. The broader mechanics of running reports across many clients belong to the multi-site and MSP monitoring pillar. The template below is the shape each client's page takes.
| Section | Content | Depth |
|---|---|---|
| Headline | One sentence: service levels met, or not, and what was done about it | One sentence |
| Availability against the agreement | Each covered service with agreed level, achieved level, and time lost, for this period and the last few | One table |
| Their incidents | Each incident affecting them: when, how long, plain-language impact, cause in one sentence, what prevents recurrence | Short paragraph each |
| Trends at their sites | Bandwidth, storage, or device counts heading toward a limit that they will need to fund | One or two items, with a recommendation |
| Planned work | Maintenance windows coming up and what they will affect | A short list |
| Requests and contact | Anything you need from them, and how to reach you | Two lines |
The availability table is the section clients read. It is worth being scrupulous about how the figure is calculated and whether agreed maintenance is excluded. Decide that once, write it in a footnote, and never change the method quietly. A client who notices a quiet change will check every figure you send them from then on.
Template: auditors
The auditor is asking a different kind of question: not "how are things?" but "can you demonstrate that the control operated throughout the period?" A control, in audit language, is a process you claim to run — "we monitor critical systems and respond to failures," for example. The report's job is to show that the claim was true every day of the period, not just on the day of the audit. What that evidence looks like in general, and how to assemble a pack of it, is covered in the compliance evidence pillar. The template here is the report-shaped view.
This is the one audience for whom completeness beats brevity. Even so, lead with a summary page that states scope, period, and conclusion, so the auditor can find their way through the rest.
| Section | Content | Depth |
|---|---|---|
| Headline and scope | Which systems, which period, which controls the report covers, and who produced it | Half a page |
| Coverage | The list of monitored systems at the start and end of the period, with additions and removals dated, proving the control applied to everything in scope | Full list |
| Control evidence | Proof that monitoring ran: check counts per day, gaps in collection if any, with explanations | Full table |
| Alert and response evidence | Every alert in scope: fired at, acknowledged at, by whom, resolved at, with a reference to the ticket or note | Full table |
| Exceptions | Anything that did not follow the process, with cause and corrective action | Each one, honestly |
| Sign-off and retention | Who reviewed the report, when, and where the underlying records are retained and for how long | A short block |
Auditors reward consistency and honesty over polish. A report that lists three exceptions and how they were closed is more convincing than one that claims a perfect period. That is because perfect periods invite closer inspection.
What not to put in each
Leaving things out is half of template design. Every item below is something that is correct, true, and useful to some reader. And it is actively harmful to the one it is listed against, because it buries the answer they came for.
| Audience | Leave out | Why |
|---|---|---|
| Operations | Cost framing, service-level percentages as the lead figure, executive summaries longer than two sentences | Ops readers act on hostnames and durations, not on budget language; the percentage is derived from rows they already have |
| Management | Interface counters, per-device tables, alert lists, hostnames, anything requiring the reader to know the network layout | Every technical row displaces a sentence they would have read; if they want the row, the ops report has it |
| Clients | Other clients' anything, your internal capacity concerns, alert noise statistics, your own team's workload | Scope is a confidentiality boundary as much as a design choice; and your problems are not their report |
| Auditors | Marketing tone, unexplained gaps, "approximately," charts without the underlying table, anything that cannot be traced to a record | The auditor's question is "can you prove it," and every untraceable statement is a follow-up request |
A quick self-test for any draft: read it as the intended audience and mark every line that makes you think "why am I being told this?" Those lines belong in a different template.
Producing all four from one computation
The practical payoff of the shared skeleton is that you compute the numbers once. The monitoring tool's own report feature may produce the numbers, or a script may pull them. Either way, each service's availability, the incident list, and the capacity trends are calculated one time per period into an intermediate table. Each template is then a rendering of that table. It uses a filter (only this client's systems) and a level of detail (every incident, or only user-visible ones). It also uses a vocabulary (hostname, or "the email service").
A sensible sequence for the period looks like this:
- Compute once. Produce the period's numbers into a single working table: one row per service or device, with availability, downtime, incident count, and capacity figures.
- Render the ops view first. It uses everything, so if a number is wrong, the team spots it here before anyone senior sees it.
- Render management from the same table, aggregating to service level and adding targets.
- Render each client's view by filtering the table to their scope, and nothing else.
- Render the audit view only when the period closes or on request, joining in the alert and response records.
- Add the human sentence to the headline of anything going above ops, then send.
Because everything comes from one computation, the reports can never disagree with each other. Four separate exports, left to themselves, will find a way. That single property is worth more to your credibility than any amount of formatting. And it is the strongest argument for building the templates this way rather than as four separate exports.
One honest caveat: the templates above are starting points, not law. Your management may want five measures rather than four; your client contract may dictate its own sections; your auditor may hand you a checklist. Keep the skeleton and the one-page rule, and adjust the rows. Write the changes down so the next person knows why the report looks the way it does.
Where to go next
One event, four readers, four reports, and one set of numbers underneath them all, which is why they agree. With the templates settled, the remaining questions are which reports to build at all, how to get them delivered, and how to make them readable. Which reports deserve automation is the inventory step that decides what exists in the first place. Scheduled delivery gets each rendering to the channel its audience actually reads. Reports people actually read takes the headline and narrative ideas here further. And killing the hand-built spreadsheet is the migration guide for the "compute once" step. The full set lives under Automating Routine Reports.
Put this into practice with SysPeep Monitor
Every template above draws on the same four histories — availability, performance, alerts, and inventory. A monitoring system that keeps them in one place makes the "compute once" step much easier. SysPeep Monitor keeps dashboards and reports in a single web console and can email reports to the people who need them. Check the product documentation for the report types and scheduling options. The free trial installs on any Windows machine in minutes.
Download Free TrialLearn About SysPeep - All Rights Reserved.