
The 95th Percentile Explained: How ISPs Bill and How You Should Measure
The first time a burstable bandwidth invoice lands on your desk, it looks like a mistake. The bill says you used 290 Mbps. Your own monitoring graph says the link averaged 136 Mbps. Both numbers came from the same wire during the same month, and, annoyingly, both are correct. The ISP is not billing your average. It is billing your 95th percentile, a number your average-utilization graph is genuinely incapable of showing you.
The 95th percentile sounds like something from a statistics exam, but the calculation behind it is almost embarrassingly simple. Collect a sample every five minutes, sort the samples, throw away the top 5%, and bill the highest number left. Once you have walked through it with real numbers, you will never squint at a bandwidth invoice again.
By the end of this guide you will be able to do the math yourself and reproduce your ISP's number from your own monitoring data. You will be able to assemble the evidence that wins a billing dispute. And — the underrated part — you will be able to use the same measurement to report honestly on your own links. If you can sort a list, you can do all of it.
In this guide
- What a percentile actually is
- Why ISPs bill on the 95th
- The mechanics, step by step
- A worked example: from samples to invoice
- Why your graph and the invoice disagree
- Reproducing the ISP's math yourself
- Disputes: the evidence that wins
- Using the 95th percentile internally
- Where to go next
What a percentile actually is
Forget traffic for a moment. Line up 100 people by height, shortest to tallest. Walk along the line until you have passed 95 of them and stop. The height of the person you are standing next to is the 95th percentile of height for that group. That means 95% of the people are that tall or shorter. The median — the person in the middle — is the 50th percentile. The tallest person in the line is the 100th.
Bandwidth billing works exactly the same way, except the "people" are samples. Those are measurements of how fast traffic was flowing during each five-minute slice of the month. Sort all of the month's samples from smallest to largest, then walk 95% of the way along the line. And the value where you stop is the 95th percentile of your traffic. Equivalently — and this is how everyone actually computes it — sort them largest-first, discard the top 5%, and take the biggest sample that survives.
One property of percentiles matters more than everything else in this article: a percentile does not care how extreme the discarded values were. If your top 5% of samples were 480 Mbps, the 95th percentile is the same as if they had been 4,800 Mbps. That indifference to outliers is the entire trick behind percentile billing. It is what makes the model forgiving, and also what makes it occasionally spring a surprise.
Why ISPs bill on the 95th
There are three common ways to pay for a business circuit. A flat rate means you pay for the pipe's full speed whether you use it or not — simple, and how most small-office connections work. Metered billing charges for total data transferred — every gigabyte counts. And burstable billing, the subject here, gives you a physically fast port (say 1 Gbps). But it charges you based on the sustained rate you actually push through it, measured at the 95th percentile.
To see why an ISP would invent that third model, look at its costs. Moving bytes is nearly free; what costs the ISP money is capacity. That means the backbone and upstream links it must build so that everyone's traffic fits at the busiest moment. An ISP does not care that you transferred 40 terabytes this month. It cares how much of its capacity you occupy at a sustained clip, because that is what it has to provision for. Percentile billing charges you for exactly that, and for nothing else.
The customer's side of the bargain is burst forgiveness. Dropping the top 5% of samples means the ISP agrees to ignore your worst 5% of the month. And 5% of a 30-day month is about 36 hours. You can slam the full line rate for a nightly backup window or an occasional huge transfer and pay nothing extra. That holds as long as all that bursting adds up to less than roughly 36 hours. You get a fast port without paying for its top speed around the clock; the ISP gets paid for the load you actually sustain. As billing compromises go, it is unusually rational.
Two contract terms complete the picture. The commit (or committed information rate) is the minimum you pay every month whether your 95th percentile reaches it or not. The overage rate applies to whatever your 95th percentile lands above the commit. A burstable contract in one sentence: "pay for at least this much, pay for more only if you sustain more, and your worst 36 hours are on the house."
The mechanics, step by step
Here is what the ISP's billing system actually does. Every five minutes, it reads the traffic counters on the port facing you — the same octet counters your own monitoring reads over SNMP. Each counter is an odometer of total bytes ever sent or received. Subtract the previous reading and divide by the 300 seconds elapsed. And you have the average rate for that interval. That single number — one rate, one interval — is a sample, computed separately for the inbound and outbound directions.
At the end of the billing period the samples are sorted and trimmed. The table below walks the whole procedure for a 30-day month:
| Step | What happens | For a 30-day month |
|---|---|---|
| 1 | Read the port's byte counters every 5 minutes, both directions | 8,640 intervals |
| 2 | Convert each interval to a rate: (bytes now − bytes 5 min ago) × 8 ÷ 300 | 8,640 samples per direction, in bits per second |
| 3 | Sort each direction's samples from highest to lowest | two sorted lists of 8,640 |
| 4 | Discard the top 5% of each list | 432 samples dropped ≈ 36 hours forgiven |
| 5 | Read the highest surviving sample | the 433rd-highest value = that direction's 95th percentile |
| 6 | Take the higher of the two directions | the billable rate |
| 7 | Compare against your commit | overage billed on anything above it |
Step 6 is where contracts differ, so check yours. Most ISPs compute the 95th percentile of each direction separately and bill the higher one, as shown. A few take the higher direction within each sample first and compute one percentile from that combined list, which produces a slightly higher number. Either way, one direction effectively drives the bill — usually inbound for an office, outbound for anything hosting servers.
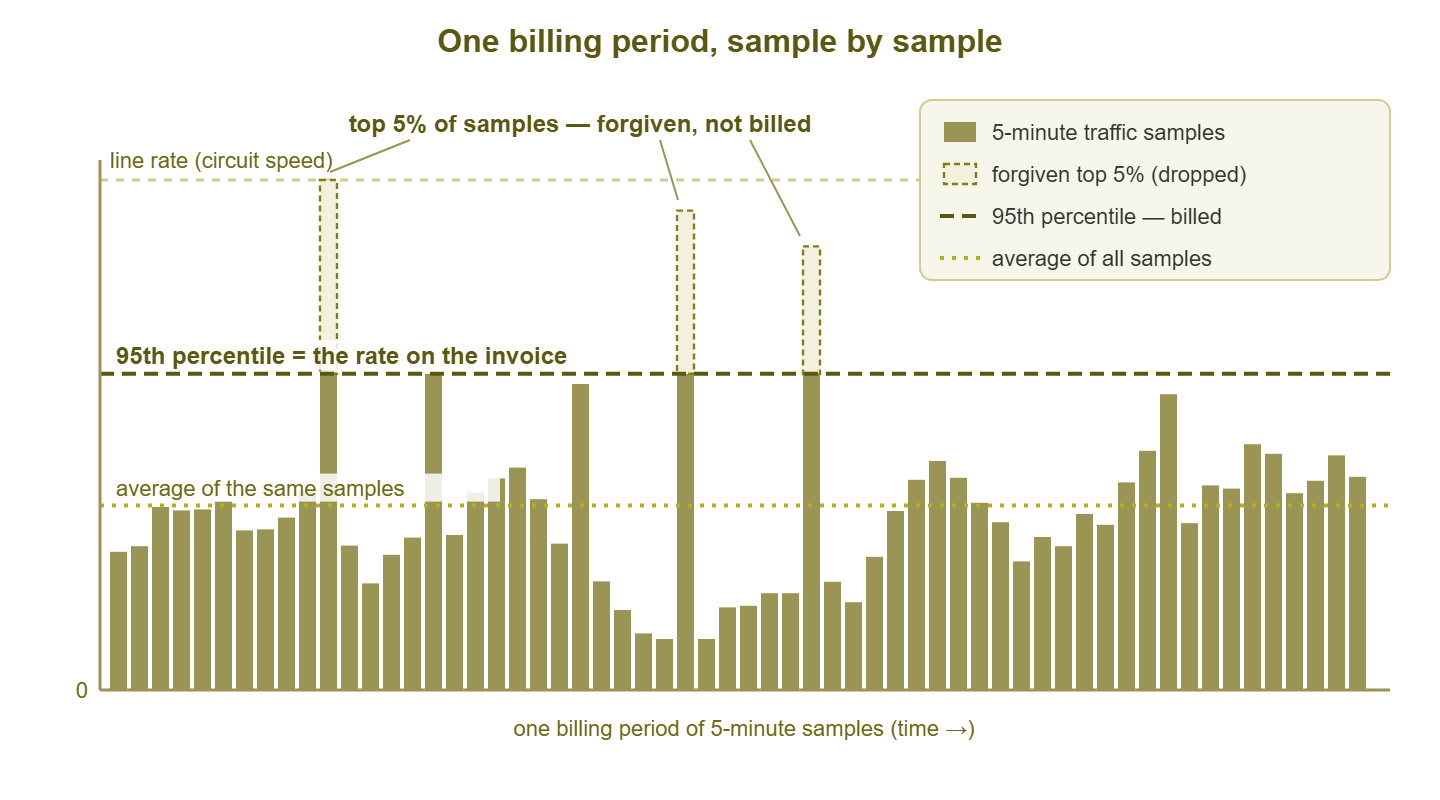
Figure 1: A billing period as 5-minute samples. The tallest 5% are forgiven (hollow tops), and the highest survivor sets the billed rate. And the average, which is what a summary graph shows, sits far below both.
A worked example: from samples to invoice
Real months have 8,640 samples, which is a terrible size for learning. So start with a toy billing period of just 20 samples — 100 minutes of traffic on an imaginary 1 Gbps burstable circuit. Do every step by hand. Here are the 20 samples in the order they were collected, in Mbps:
12  18  15  22  480  35  30  28  25  40
55  61  48  45   33  27  20  16  14  19
That 480 is a five-minute burst — someone pushed a huge file at nearly half the line rate. Now sort the list from highest to lowest and discard the top 5%. Five percent of 20 samples is exactly one sample, so precisely one value gets forgiven:
480   <- top 5%: discarded ("forgiven")
 61   <- highest survivor: the 95th percentile
 55  48  45  40  35  33  30  28
 27  25  22  20  19  18  16  15  14  12
The 95th percentile of this period is 61 Mbps. Notice what happened to the burst: the single most dramatic number in the whole dataset — eight times larger than the runner-up — simply vanished from the bill. The average of all 20 samples is about 52 Mbps, the peak was 480, and the invoice would say 61. Three wildly different numbers, all describing the same traffic, all correct.
Now scale the same mechanics up to a full week — 2,016 five-minute samples — with a realistic traffic mix for a mid-size office on that same circuit:
| Traffic block | Samples | Typical rate |
|---|---|---|
| Nights and weekend hours (quiet) | 1,132 | ≈ 20 Mbps |
| Business hours (normal work) | 800 | 150–300 Mbps, busiest at the top |
| Nightly cloud backup, 1 hour × 7 nights | 84 | ≈ 900 Mbps |
Five percent of 2,016 samples is about 100, so the top 100 samples are forgiven. Which are they? All 84 backup samples — the week's scariest traffic — plus the 16 busiest business-hour samples, the ones up near 300 Mbps. The highest survivor is the 101st-highest sample: a busy Tuesday-morning interval at about 290 Mbps. That is the billed rate. Meanwhile the arithmetic average of all 2,016 samples works out to about 136 Mbps. There sits the mystery from the top of this article: the graph honestly says 136, and the invoice honestly says 290. If the commit was 200 Mbps, you are paying overage on the 90 Mbps above it.
Before moving on, look at how close that backup schedule is to the edge. Seven hours of nightly backups is 84 samples — comfortably inside the 100-sample forgiveness budget. Stretch each backup window to two hours and it becomes 168 samples, which no longer fits. The moment burst traffic exceeds the budget, the samples that overflow it stop being forgiven. At that point, your 95th percentile snaps from 290 all the way up toward 900. Percentile billing is not a gentle slope; it is a cliff with 36 hours of grass in front of it. Knowing exactly where the cliff edge is — and how close your scheduled jobs graze it — is the single most valuable thing this math can tell you.
Why your graph and the invoice disagree
Armed with the example, the disagreement stops being mysterious. But there are usually several gaps stacked on top of each other. And it is worth naming each one, because in a dispute you will need to rule them out one at a time.
Averages and percentiles measure different things
This is the big one. Business traffic is spiky: dead nights, busy days, occasional bursts. The average blends the quiet 60% of the week into the number, dragging it far below what the link sustains during working hours. The 95th percentile does the opposite: it reports the rate you still sustained after the worst bursts are set aside, quiet nights be damned. On a spiky link, the 95th percentile routinely runs at double the average or more. Neither number is wrong; they answer different questions.
Your graph has been quietly averaged again
Most monitoring tools store recent data at full 5-minute resolution but consolidate older data to save space. Last week becomes 30-minute averages, and last month becomes 2-hour averages. When you look at a month-long graph, each pixel may be the average of dozens of raw samples — and averaging melts peaks like ice cream. A burst that filled the link for 20 minutes becomes a modest bump in a 2-hour average. Your ISP's billing system keeps every raw sample. If your tool rolled yours up, its month view will sit far below the billed figure even though both started from identical counters.
You are looking at the wrong direction
The bill follows the busier direction, and directions are mirror-imaged across the demarcation point: traffic the ISP calls "in" (into its network) is your upload. Admins habitually stare at the download line. But if offsite backups or a public-facing server made upload the billed direction, your favorite line on the graph is simply the wrong one.
Tip: the oldest gotcha in bandwidth math is units. Counters count bytes; circuits and invoices are sold in bits per second, and the letters look alike in abbreviations (MB/s vs Mb/s). One byte is eight bits, so a graph accidentally rendered in megabytes per second reads exactly eight times lower than the invoice. If your number is off by a suspiciously clean factor of eight, you have not found fraud — you have found a unit label.
Reproducing the ISP's math yourself
You should never have to take a percentile bill on faith. Everything the ISP measures, you can measure too — from your side of the same cable. Set your monitoring up to mirror the billing system's view:
- Poll the billed port itself. Monitor the interface that faces the ISP — your router's WAN interface at the handoff — not some internal interface that carries a different mix of traffic.
- Use 64-bit counters. Ask for the high-capacity octet counters (
ifHCInOctets/ifHCOutOctets). The old 32-bit counters wrap back to zero every 4 GB. At rates above roughly 115 Mbps, that can happen within a single 5-minute interval and quietly corrupt samples. - Poll every 5 minutes, on a steady schedule. Same cadence as the billing system. Perfect clock alignment with the ISP is impossible and unnecessary; steady spacing is what matters.
- Keep the raw samples. Retain full-resolution data for at least the billing period plus your dispute window — 90 days is a comfortable habit. Consolidated data cannot be un-averaged.
- Compute both directions separately, then apply whichever combining rule your contract specifies.
The computation itself needs nothing fancier than a spreadsheet or two shell commands. Export one month of samples as one bits-per-second value per line, then:
# each sample: (counter_now - counter_before) * 8 / 300  = bits per second

sort -rn samples_out.txt > sorted_out.txt   # highest first

# 30-day month: 8640 samples, 5% = 432 discarded,
# so line 433 is the 95th percentile:
sed -n '433p' sorted_out.txt
Run it for both directions and compare the higher value with the invoice. Expect agreement within a few percent, not to the decimal: your polling clock and the ISP's tick at different offsets. So the same burst is sliced into intervals slightly differently. A 2% gap is measurement noise. A 40% gap is a conversation.
Disputes: the evidence that wins
When the gap is big, resist the urge to open the ticket with "your bill is wrong." Billing systems compute percentiles all day and are rarely broken; what is usually broken is one of the assumptions above, on either side. The productive move is to localize the disagreement, and for that you need an evidence pack:
- Your raw samples — full-resolution, both directions, covering the entire billing period, with timestamps and the timezone stated explicitly.
- Your method — which interface you polled, which counters (the exact OIDs), the polling interval, and the sort-and-discard arithmetic you applied, shown step by step as in the table above.
- Your result — the 95th percentile you computed for each direction, next to the invoiced figure.
- Their samples — ask the ISP for the raw sample export behind the invoice. Reputable carriers will provide it, and many have a portal that shows it. This request alone resolves a large share of disputes, in one direction or the other.
With both sample sets on the table, the discrepancy almost always localizes fast. Check the boring things first, in rough order of likelihood: were you comparing the same direction? The same billing period boundaries (their month may end on the 25th, in a different timezone)? Is one side in bytes? Was your data consolidated before you computed? Did your poller have an outage that thinned your samples? Only after those survive scrutiny do you get to the genuinely rare cases. Those are the ISP billing the wrong port, a duplicated sample feed, a misconfigured commit. When they do happen, your tidy evidence pack is what turns "customer feels overcharged" into a credit memo.
Warning: a gap in your own data weakens the whole case. If your poller was down for a day, you cannot compute an honest percentile for the month. And the missing samples are, by Murphy's law, the interesting ones. If you intend to hold your ISP's numbers to account, treat your monitoring itself as billing-grade: it has to run all month, every month.
Using the 95th percentile internally
Here is the plot twist. The measurement your ISP uses to bill you is also the most honest single number for describing any busy link you own. The average understates a spiky link and the peak overstates it. One freak burst should not define a link's month, but neither should its 3 a.m. idle hours. The 95th percentile splits the difference on purpose — it ignores freak moments but refuses to ignore every busy afternoon.
A reporting habit that serves capacity planning well is the trio: for each link that matters, report average, 95th percentile, and peak side by side. Take this report: "The internet edge averaged 136 Mbps, ran 290 at the 95th percentile, and peaked at 900". The report says in one line how busy the link is overall, how busy it reliably gets, and how hard it occasionally slams. When the 95th percentile of a link sits persistently above roughly 70–80% of its capacity, the link is genuinely full during real working hours. At that point, it is time for the shaping-or-upgrading conversation. Other guides in this topic take that decision on in detail.
One honest caveat: by design, the 95th percentile is blind to the worst 36 hours a month, and your users are not. Voice calls and video meetings live or die in exactly the short congested moments the percentile forgives. Use the 95th for billing, budgeting, and honest "how full is it really" reporting. And keep watching peaks and interface drop counters for the experience your percentile politely declines to see.
Where to go next
You now know the whole trick: five-minute samples, sort, forgive the top 5%, bill the survivor. You can rebuild your ISP's number from your own counters, and argue an invoice with evidence instead of vibes. You can also report your own links with a number that neither flatters nor panics. The natural next questions each have their own guide. They are who is actually filling the link, how full is too full, and whether to shape or upgrade when it gets there. Find those guides in Bandwidth & Utilization Monitoring. The wider library at All Topics goes deeper on everything the samples are made of.
Put this into practice with SysPeep Monitor
The math in this guide only works if you have the samples. SysPeep Monitor auto-discovers your devices and polls interface traffic over SNMP on a steady schedule. It keeps the utilization history, dashboards, and reports that let you check an invoice instead of taking it on faith. The free trial installs on a Windows machine in minutes.
Download Free TrialLearn About SysPeep - All Rights Reserved.