
Weekly Rhythms and Seasonal Patterns: Reading Your Network's Heartbeat
Your network has a pulse. At 8:55 every weekday morning it races — a hundred laptops waking up, mail syncing, cloud drives reconciling a night's worth of nothing. At half past noon it relaxes. At one in the morning it works harder than it does all day, because that is when the backups run. At month-end it strains. In the dead weeks of summer it dozes. None of this is random; it is rhythm, as regular as tides, and it repeats whether or not anyone is watching.
An admin who cannot read that rhythm gets burned in two opposite directions. First, expected peaks get misdiagnosed as problems. The Monday-morning utilization spike triggers a panicked investigation of something that has happened every Monday since the company was founded. Second — and more dangerous — real anomalies hide inside expected peaks. Take the compromised machine exfiltrating data during the morning surge. Or take the failing disk stretching the backup window a little more each night. Both are invisible because "it's always busy then."
This guide teaches rhythm literacy. It covers what the recurring patterns are, what drives each one, and how to build your own pattern library. It also covers how to use it — for triage, for alerting, and for capacity decisions. It assumes you know what a baseline is. Rhythm is the "specific context" half of that definition, grown up and given its own guide.
In this guide
- Two ways rhythm-blindness burns you
- The rhythm catalog: daily, weekly, monthly, seasonal
- Building your pattern library
- Putting rhythm knowledge to work
- A worked reading: one month of a WAN graph, decoded
- The rhythm-mapping worksheet
- Where to go next
Two ways rhythm-blindness burns you
It is worth sitting with the two failure modes for a moment, because they motivate everything else here. The first failure is false alarm by ignorance. A metric does what it does every day at this hour, and someone who has never watched it at this hour declares an incident. The cost is wasted afternoons, cried-wolf credibility, and thresholds getting nervously raised until they catch nothing. The second failure is real problem camouflaged by rhythm. Something genuinely wrong happens to occur inside a known busy period, and everyone waves it off as "just the morning rush." The cost is discovery weeks late, usually by a user, occasionally by an auditor.
Both failures have the same cure: knowing the rhythm well enough that "expected for this hour" and "not expected for this hour" become fast, confident judgments. That knowledge is not talent; it is a catalog you can build deliberately.
The rhythm catalog: daily, weekly, monthly, seasonal
Rhythms come in four periods, nested inside each other like gears. For each one, learn the drivers (what causes it) and the signature (what it looks like on a graph).
Daily: the workday's shape
The daily rhythm is driven by humans arriving, eating, and leaving, and by machines doing scheduled work while the humans sleep. Its signature features include the morning login surge: a sharp spike as everyone's device authenticates and syncs at once. It often peaks in the ten minutes before nine. Then comes the lunch dip: utilization sags, though guest Wi-Fi may rise as phones come out. The early-afternoon bump comes around two o'clock, as meetings end, big files move, and cloud clients run their sync cycles. Other features are the evening fade and the night shift — backups, replication, patching, and updates. On many networks, that night shift produces the highest sustained utilization of the entire day. A quiet overnight floor is itself a signature worth knowing. It is the sound of nothing happening, and you want to recognize it so you notice when it stops being quiet.
Weekly: the seven-day cycle
The weekly rhythm is driven by the business calendar. Monday morning is typically the week's crescendo — a double surge. That is because a weekend's worth of updates, mail, and sync backlog piles on top of the ordinary login rush. Friday afternoon fades early, for reasons requiring no network analysis. Weekends drop to a floor — and here is a tell worth cultivating: weekend non-quiet is its own finding. If Saturday's graph is not resting on the floor, something is running on Saturdays, and you should be able to name it. Sometimes the answer is legitimate (full backups, batch reports). Sometimes the answer is "nobody knows." That is how one admin discovers a forgotten sync job, and another discovers cryptomining.
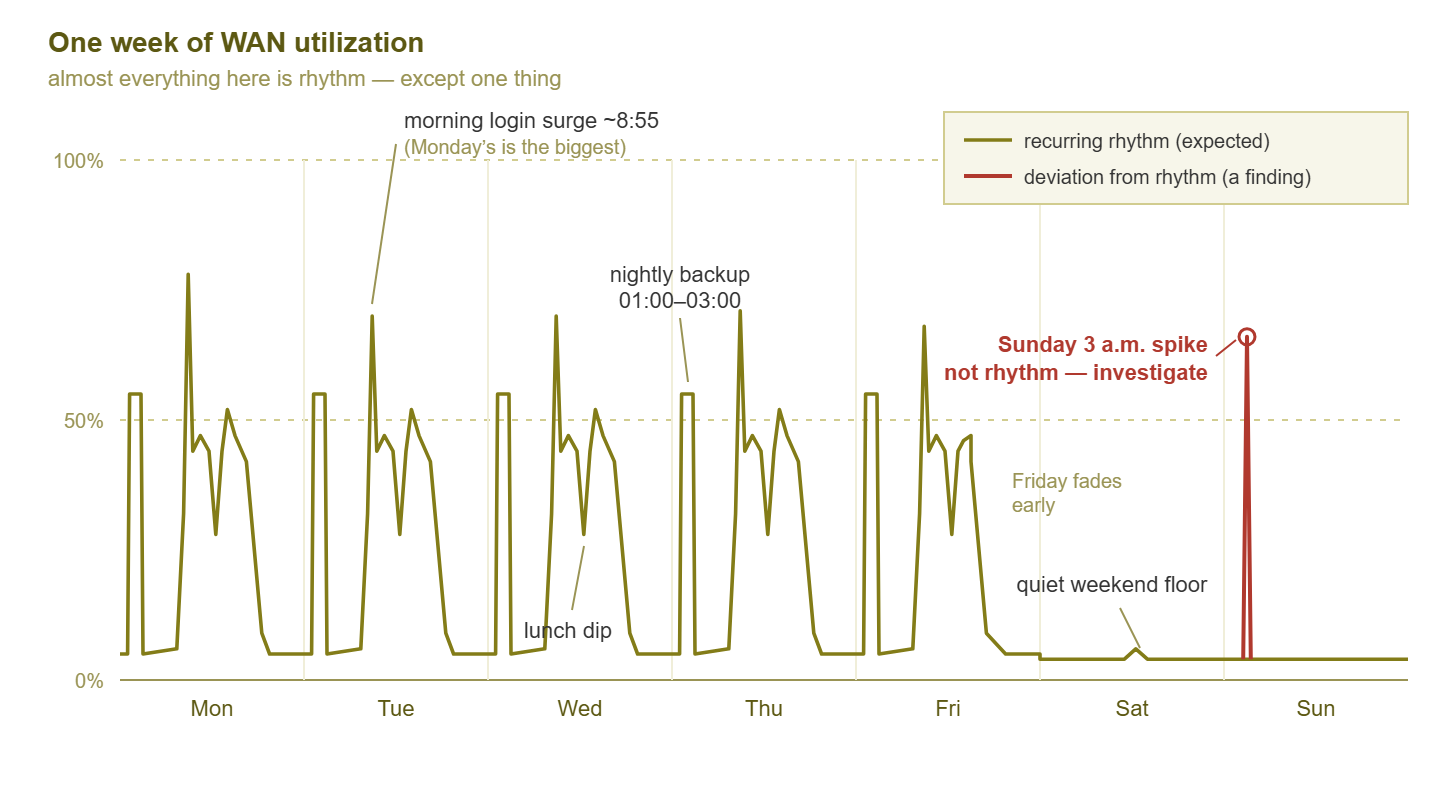
Figure 1: One week of utilization. Every feature but one repeats on schedule and has a nameable cause. The one that does not is the whole point of learning the rhythm.
Monthly: the business machinery
The monthly rhythm is driven by administrative machinery. There are payroll runs: database and file activity clustering on fixed days. There is month-end reporting: finance exports, big queries, print storms. Month-end reporting often brings the heaviest two or three days of the month for specific servers. And there are patch cycles: a monthly update wave that lifts WAN utilization and reboots servers on a schedule someone chose years ago. Monthly patterns are easy to miss. A two-week observation window is the usual minimum when collecting first baselines. But it can slide right between two month-ends. If your organization has any finance function at all, assume a month-end pattern exists until proven otherwise.
Annual and business-seasonal: your industry's weather
The longest rhythms belong to your industry. Schools have enrollment weeks and exam seasons. Retailers have holiday peaks that dwarf the rest of the year. Accounting firms have fiscal year-end. Many offices have a summer lull when the graphs get suspiciously serene. The specifics vary — the point is that your business has some. And they will show up on your graphs before anyone thinks to warn you. This is the deepest lesson of the whole catalog: rhythms are business facts wearing network costumes. The 8:55 surge is the standup meeting's schedule; the month-end crunch is the finance department's deadline; the January spike is the sales kickoff. The network graph is often just the org chart's calendar, plotted.
One more thing: rhythms live in every metric, not just traffic
Utilization graphs make rhythm easiest to see, but everything with users behind it keeps the same beat. DNS query rates surge with logins. Wi-Fi client counts trace the workday so faithfully you can spot the lunch break in them. Latency across a busy link rises gently during peak hours simply because queues are longer. Disk space on the file server grows on weekdays and rests on weekends. Even the alert stream has a rhythm — more noise during business hours, near-silence at night. Once you start seeing time-of-week shapes, you will find them in every graph you own. Each one is another metric where "normal for this hour" is a question you can actually answer.
Building your pattern library
Rhythm knowledge accumulates on its own over years of incidents. You can shortcut that with three deliberate practices.
Overlay weeks: the Tuesday-on-Tuesday discipline
The single most powerful trick in graph reading: compare like with like. Never ask "does today look normal?" against yesterday — ask it against the same day last week. Most monitoring tools can overlay time ranges on one chart, or at least show them side by side. Think of this Tuesday drawn over the last four Tuesdays. When the lines stack, you are looking at rhythm. Where today's line leaves the bundle, you are looking at news. The discipline part is refusing shortcuts: Monday compared to Friday tells you nothing except that Monday is not Friday, which you knew. Make same-day-last-week your reflexive first comparison and half of anomaly detection becomes a five-second glance.
Annotate causes: the calendar of causes
Every recurring feature on your graphs has a cause with a name. The day you learn the name, write it down. Otherwise, six months later, the 2 a.m. spike will be a mystery again, investigated again, by you again. The tool for this is a calendar of causes: a small table mapping each recurring pattern to what drives it. It answers the recurring-spike question permanently and turns tribal knowledge into documentation a new colleague can read on day one. A workable template:
| When | What the graph shows | Cause | Owner / notes |
|---|---|---|---|
| Weeknights 01:00–03:00 | WAN up to ~60%, storage network busy | Offsite backup replication | Backup admin; window agreed with ISP |
| Sundays 02:00 | Brief WAN bump, server reboots | Monthly patch cycle (staggered) | Patching runbook |
| Weekdays 08:50–09:10 | Sharp utilization spike, DNS + auth burst | Login surge and cloud sync | Expected; worst on Mondays |
| Last 3 business days of month | Database server CPU high all day | Finance month-end reporting | Finance ops; do not schedule changes |
| First Wednesday, 10:00 | Campus-wide brief spike | All-hands video meeting | Grows with headcount |
Keep it next to your baseline register — the two documents answer sibling questions ("what is normal?" and "why is normal shaped like that?").
Interview the business: the quarterly "what's coming?" chat
Graphs only show rhythms that have already happened. For the ones that have not happened yet, ask humans. A fifteen-minute quarterly conversation with the people who run the business calendar catches the surprises before they hit the graphs. Those people include the office manager, finance lead, HR, whoever plans events. Useful questions:
- What is on the calendar next quarter that is not on it every quarter — events, campaigns, onboarding waves, audits?
- Is anyone joining or leaving in bulk — a hiring push, an office move, a team relocating?
- Are any new applications or big rollouts planned that everyone will use at once?
- When are your genuinely critical crunch periods, when even planned maintenance would hurt?
Every answer is a future graph feature, delivered early. It is also quietly excellent politics: the departments learn that IT asks before things break, which buys patience for the one time something does.
Tip: when an unexplained recurring pattern resists identification, timing is your best witness. Note exactly when it starts and stops, to the minute, and search scheduled tasks, cron jobs, and backup schedules for that time. A spike that begins at precisely 02:00:00 was scheduled by somebody; genuine faults are rarely so punctual.
Putting rhythm knowledge to work
Triage: time-context is the first diagnostic question
When a graph looks alarming or an alert fires, the first question is not "how high is it?" Instead, ask "what time is it, and what does this metric normally do at this time?" A 9 a.m. Monday spike is Monday; file it under weather. The same spike at 3 a.m. Sunday is a finding. Nothing legitimate on most networks is that busy then. So the shortlist writes itself: forgotten scheduled job, malfunctioning device, or someone else's business being conducted on your network. Time-context turns one ambiguous number into a directed investigation, and it costs three seconds. Make it a habit and you will triage in glances while others are still opening tickets.
The same question works in reverse, and the reverse is underrated: an expected peak that fails to appear is also a finding. If it is 9:05 on a Tuesday and the login surge never came, do not celebrate the quiet — ask what broke. Maybe authentication is down, maybe a switch failed and half the building cannot reach anything, maybe your monitoring itself stopped seeing. Rhythm gives you both tells: the noise that should not be there, and the silence that should not be there either.
Alerting: thresholds that know what day it is
A single threshold that must tolerate the Monday surge without firing is, by construction, too loose to catch trouble on a quiet Sunday. Where your tooling supports it, the fix is rhythm-aware alerting. That means different thresholds for business hours versus nights and weekends. Or it means deviation-based alerts that compare against what is typical for this hour of this day. At minimum, know which alerts deserve skepticism during known peaks and which deserve extra attention during known quiet. Every tool supports this, because it lives in your head. Also use maintenance-window suppression for scheduled work like backup night. The maintenance windows pillar covers that discipline. The full craft of wiring baselines and rhythms into alert rules is the subject of using baselines to set smarter alerts.
Capacity: size for the rhythm's peaks, not the average
Averages are where capacity mistakes come from. A WAN link averaging 30% over a month sounds comfortably provisioned. And it can still be saturated for the three days of month-end that the business cares about most. Users do not experience averages; they experience the worst hour of their most important day. So when rhythm knowledge feeds capacity planning, the question is about demand. What does the recurring peak demand — the month-end crunch, the enrollment week, the holiday season? If the link is comfortable then, it is comfortable, whatever the average says. Your pattern library tells you which peak defines the requirement. Buying for the average while the rhythm's peak saturates is how networks end up "upgraded" and still slow.
A worked reading: one month of a WAN graph, decoded
Here is a month of one WAN link, read the way you will read yours once the library exists. The canvas has four weekly cycles, each shaped like Figure 1. Each has five workday humps with morning spikes, lunch dips, nightly backup blocks, Friday fading early, weekends on the floor. Onto that canvas, the month adds its own events, each decoded in turn:
- Week 1, Monday: the month's tallest morning surge — weekend backlog on top of the usual rush. Calendar of causes: expected, worst after long weekends. No action.
- Week 1, Wednesday 10:00: a fifteen-minute campus-wide spike. All-hands video meeting. Expected; noted as growing slightly each quarter as headcount grows — a capacity data point, not an incident.
- Week 2, Tuesday: daytime utilization runs ~10% above the Tuesday bundle all day. Overlay comparison flags it; the cause turns out to be a marketing team moving video files. Explained, one-off, no action — but worth a line in the log in case it becomes weekly.
- Week 2, Sunday 02:00: a brief bump plus staggered server reboots. Patch cycle. Expected.
- Week 3, Thursday 03:00: forty minutes of steady outbound traffic on a night with no scheduled jobs. Not rhythm. This is the month's one real finding: investigation traces it to a desktop with an unauthorized sync client uploading to a personal account. Handled. This is exactly the event that hides forever on a network where nobody knows what 3 a.m. is supposed to look like.
- Week 4, final three business days: the database server's CPU camps at high utilization all day and the WAN's afternoon load thickens. Month-end reporting. Expected — and noted as the peak that sizes both boxes: this is the recurring worst case the infrastructure must clear.
One month, six deviations from the flat expectation of "traffic happens." Five had names in the pattern library and cost thirty seconds each. The sixth cost an afternoon and was worth the whole practice. That ratio — mostly rhythm, occasionally news — is what a well-read network looks like.
The rhythm-mapping worksheet
To make your own library deliberate rather than accidental, fill this worksheet for each key metric — one pass per period. The example rows show a completed WAN entry. The discipline is filling the driver column. That is because a pattern without a nameable driver is either an unfinished row or an open investigation:
| Period | Pattern | Driver | Peak window | Normal range in window |
|---|---|---|---|---|
| Daily | Morning surge, lunch dip, 14:00 bump, evening fade | Logins and cloud sync; lunch; post-meeting file moves | 08:50–09:10 | Spikes to ~65% |
| Daily (night) | High sustained block overnight | Backup replication offsite | 01:00–03:00 | 55–60% |
| Weekly | Monday heaviest, Friday fades early, weekend floor | Weekend backlog; humans; absence of humans | Mon 08:50–09:10 | Spikes to ~78% |
| Monthly | Reporting crunch; patch bump | Finance close; update cycle | Last 3 business days; first Sunday 02:00 | Busy hours 55–70% |
| Seasonal | Summer lull; year-end push | Vacations; fiscal deadlines | Varies by business | Document yours |
Review the worksheet whenever you refresh baselines. Rhythms drift as the business changes, and a stale pattern library misleads with exactly the confidence of a fresh one. The guide on rebaselining when normal changes covers when and how to update both documents together.
Where to go next
Rhythm literacy is the difference between an admin who reads graphs and one who merely looks at them. You now have the catalog (daily, weekly, monthly, seasonal). You have the three library-building practices (overlay weeks, annotate causes, interview the business). And you have the three payoffs (faster triage, smarter alerting, honest capacity math). The natural next step is wiring this knowledge into your alert rules so the monitoring system itself learns what Monday means. That is using baselines to set smarter alerts. The rest of the series lives in Baselining & Knowing Normal.
Put this into practice with SysPeep Monitor
Rhythm reading needs history you can overlay and compare. SysPeep Monitor collects utilization, CPU, latency, and more over SNMP, WMI, and SSH. Its dashboards and reports let you set this Tuesday beside the last few Tuesdays until the pattern is obvious. The free trial installs on any Windows machine — a month from now, you will have a month of rhythm to read.
Download Free TrialLearn About SysPeep - All Rights Reserved.