
Building a Scoring Sheet That Survives the Sales Pitch
Every tool evaluation produces a spreadsheet eventually. Usually it is a grid of features down the side, products across the top, and a tick in nearly every cell. Every product "supports" nearly everything if you ask loosely enough. Then the spreadsheet is ignored and the decision goes to whichever demo felt best. I have built that spreadsheet. It was not wrong to exist; it was built in a way that guaranteed it could not tell anyone anything.
This guide builds the other kind: a sheet with weights you set before you see a single product. It has scales that say what a score means and a rule that a claim is not evidence. The guide walks through the seven families of criteria that matter for a monitoring tool. It shows how to assign weights and define scales. It ends with a worked example where a tool with fewer features wins. Not by accident: because it is strong exactly where your weights say strength matters. If you have already written down your requirements, this is where they turn into numbers you can defend.
In this guide
- Why unweighted checklists lie
- The seven criteria families
- Assign the weights before you see a product
- Define the scale: what 1, 3, and 5 mean
- Score on evidence, not assurances
- A worked example: Tool A against Tool B
- Keeping the sheet honest
- Where to go next
Why unweighted checklists lie
A feature checklist asks a yes-or-no question about each feature, then counts the yeses. It fails for three reasons. First, the questions are too easy. "Supports SNMP" or "has alerting" is true of every product in the category. So the ticks pile up equally and the sheet cannot separate anything. Second, every row counts the same. So "exports reports to a document" carries the same weight as "does not drown the on-call person in duplicate alerts." That is absurd, and everybody knows it is absurd, which is why the sheet is ignored. Third, a checklist rewards breadth. The product with the longest feature list wins. A long feature list is a fact about the product's age and marketing budget, not about your network.
A weighted, scaled sheet fixes each failure in turn. Weights say how much a criterion matters to you, so the alerting row can count four times as much as the report-export row. A scale replaces yes-or-no with degrees — a 1, a 3, or a 5 — so "supports SNMP" becomes "how well does it handle our devices?" And an evidence rule stops a confident sentence in a demo from earning the same score as something you watched work on your own switches. The result is a sheet that can survive contact with a good salesperson, because nothing on it is decided by how the demo felt.
The seven criteria families
Most of the criteria for a monitoring tool fall into seven families. Each family becomes a section of your sheet, with a handful of specific criteria under it drawn from your requirements list. If you have not built that list yet, the guide on writing requirements before demos is the place to start. A scoring sheet without requirements behind it has nothing to weigh.
1. Coverage
Can it see what you own? The factors include device types (switches, firewalls, access points, servers, hypervisors, UPS units, printers). They include the protocols it collects with (SNMP, WMI, SSH, flow records, syslog, cloud APIs) and the collectors it offers. A collector is any component that gathers data. That might be the central server, a remote probe at another site, or an agent on a host. The sharpest coverage criteria name your own device families and ask for vendor-specific health data, not generic reachability.
2. Alerting quality
This family decides whether people will trust the tool after a month. It includes thresholds with warning and critical levels. It includes dependencies, so that a failed switch produces one alert rather than forty for everything behind it. It also includes noise controls such as flap suppression, maintenance windows, and delays before an alert fires. And it includes routing, so the right alert reaches the right person by the right channel at the right hour. A tool that scores low here will be muted within a quarter, and a muted monitoring tool is an expensive screensaver.
3. Scale and architecture
How is it built, and will that still fit in three years? The factors include remote probes for other sites and segments. They include the database it uses and whether you know how to back that database up. They also include how much data it keeps and for how long. Another is whether high availability is possible if you ever need it. That means a second server that takes over when the first fails. Score this against the network you will have, not the one you have today, but be honest about how much growth is actually coming.
4. Usability for your team
Not usability in general — usability for the specific people who will open it. If a junior technician covers the help desk, can they add a device and read a graph after an hour's introduction? If the on-call rota includes people who are not network specialists, can they understand an alert without a glossary? This is the family where a very capable product can legitimately score a 2. Capability nobody on your team can reach is not capability you own.
5. Integration
This covers how it connects to the things around it. That includes an API (a programmatic interface other software can call) for pulling data out or pushing devices in. This family also includes a link to your ticketing system so alerts become tickets, and chat or paging channels for notifications. Weight this by what you will actually wire up in the first year, not by the length of the integration catalogue. Most teams wire up ticketing, chat, and a good intention.
6. Support and documentation
When something breaks at the worst moment, what happens? Score the documentation by trying to answer three of your own questions from it during the evaluation. Score support by asking a real question through the real channel and timing the answer. Include the community if there is one, and whether the knowledge you gain is transferable or locked in one product's vocabulary.
7. Cost over three years
This means the whole cost over a multi-year horizon, not the sticker price. It includes your own hours to deploy, learn, and maintain it, plus any modules you discover you need later. The guide on total cost of ownership gives you a worksheet method. The guides under licensing models and hidden costs explain how the pricing structures themselves behave as you grow. For the scoring sheet, score cost relative to the other candidates on the same three-year basis.
Assign the weights before you see a product
This is the rule that gives the sheet its strength: weights are fixed before the first demo and do not move afterwards. The reason is simple. Once you have seen a product you like, you will be tempted to nudge the weight of whatever it is good at. You will find a reason for the nudge that sounds perfectly sensible. Setting weights blind removes the temptation, because there is nothing yet to be biased toward.
The mechanics are easy. Give yourself one hundred points and distribute them across the seven families according to how much each one matters to your situation. A small team with a painful alert-noise history might put twenty on alerting and fifteen on usability. A multi-site organisation might push scale and architecture up. Then, within each family, split that family's points across its specific criteria. Write the weights down with a one-line reason each. Get whoever else has a stake in the decision to agree to them in writing. That stops anyone relitigating them once the demos start. A starting distribution for a small or mid-size network looks like this:
| Family | Weight | One-line reason |
|---|---|---|
| Coverage of our devices | 25 | If it cannot see our gear, nothing else matters |
| Alerting quality | 20 | Our last tool was muted because of noise |
| Usability for our team | 15 | The help desk must use it without training courses |
| Scale and architecture | 10 | Two sites now; a third is plausible |
| Integration | 10 | Ticketing link is wanted; the rest can wait |
| Support and documentation | 10 | One admin; we will need answers fast |
| Three-year cost | 10 | Real, but the budget range is already agreed |
Cost sits at ten, not forty, and that is deliberate. It is not because money does not matter. The must-have list and the budget approval have already done the coarse filtering. Any candidate on the shortlist is affordable, or it would not be there. Inside the shortlist, cost is one factor among several. If you weight it too heavily you will simply buy the cheapest tool and then pay the difference in your own time.
Define the scale: what 1, 3, and 5 mean
A score without a definition is a mood. Two people watching the same demo will give the same feature a 3 and a 5 for no reason either could explain. So, for every criterion, write down before the evaluation what a 1, a 3, and a 5 look like. Use 2 and 4 for "between." The definitions should describe observable outcomes, and the top score should be reachable only by something you can actually see happen. A few examples, written for the requirements in the previous guide:
| Criterion | 1 means | 3 means | 5 means |
|---|---|---|---|
| Coverage of our switch family | Generic reachability only; health data would need manual setup for every value | Discovered and polled; stack and PoE data needs some manual work | Discovered, polled, stack and PoE health shown out of the box, verified on our switches |
| Dependency handling | Every downstream device alerts when a parent fails | Dependencies can be set by hand per device; they work when set | Dependencies are inferred or set in bulk; the core-switch scenario produced one alert |
| Usability for the help desk | The technician could not add a device after an hour without help | Added a device unaided; needed help to tune an alert | Added a device and tuned an alert unaided, and said the tool made sense |
| Documentation | Could not answer any of our three test questions from it | Answered two of three after some searching | Answered all three quickly, with examples that matched our setup |
| Three-year cost | Highest total among candidates, or open-ended add-ons we could not pin down | Mid-range total with the add-ons identified | Lowest total among candidates with no surprises found during the evaluation |
Writing these takes an hour or two and it is the best-spent time of the whole project. It forces you to decide what "good" means for each criterion. It makes scores comparable across evaluators. It gives you a defensible answer when a vendor asks why they scored a 3 on something they consider a strength. "Here is the definition of a 5; here is what we observed" is a complete answer.
Score on evidence, not assurances
The final structural rule is about where a score comes from. There are three kinds of evidence, and they are not equal. The strongest is we made it work on our own network during the proof of concept, following our own scenario. Next is we watched it work in the demo, on the vendor's data, driven by the vendor. Weakest is the vendor says so, or the documentation says so, or the feature appears on a comparison page. Add a column to the sheet for the evidence level next to every score, and enforce a cap. A score of 5 requires the strongest evidence. A demo observation caps the score at 4. A written or verbal assurance caps it at 3, no matter how confidently it was delivered.
This rule does two useful things. It stops the sheet rewarding fluent presenters, because fluency does not move a score past 3. And it makes the proof of concept the centre of gravity of the whole evaluation. The proof of concept is the only way to reach the top of the scale. Vendors quickly work this out and start asking what scenarios you want to run, which is exactly the conversation you want to be having. It is also a much shorter demo.
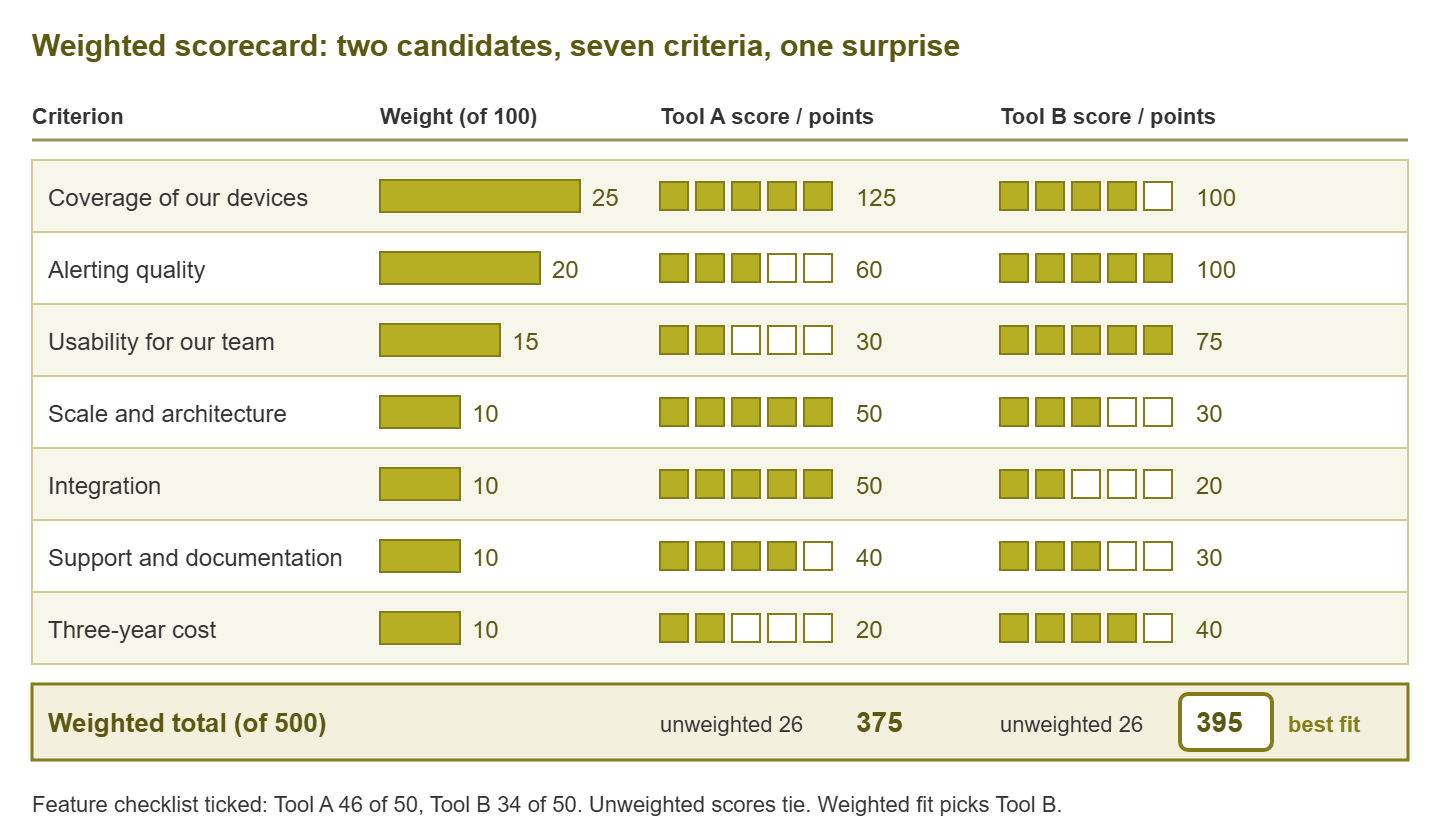
Figure 1: The same two candidates, three ways. The checklist favours Tool A, and the unweighted scores tie. The weighted sheet picks Tool B because it is strong where the weights are heavy.
A worked example: Tool A against Tool B
Two anonymous candidates reached the proof of concept. Tool A is the broad one. It has a long feature list and remote probes for everything. Its integration catalogue scrolls for a while, and its console rewards an expert. Tool B is narrower. It covers the common device families well, its alerting is unusually careful, and the help-desk technician liked it within the first hour. But it has fewer integrations and would need a second server to grow much further. On a fifty-item feature checklist, Tool A ticked forty-six boxes and Tool B ticked thirty-four. Most evaluations would have stopped there.
| Criterion | Weight | Tool A score | Tool A points | Tool B score | Tool B points |
|---|---|---|---|---|---|
| Coverage of our devices | 25 | 5 | 125 | 4 | 100 |
| Alerting quality | 20 | 3 | 60 | 5 | 100 |
| Usability for our team | 15 | 2 | 30 | 5 | 75 |
| Scale and architecture | 10 | 5 | 50 | 3 | 30 |
| Integration | 10 | 5 | 50 | 2 | 20 |
| Support and documentation | 10 | 4 | 40 | 3 | 30 |
| Three-year cost | 10 | 2 | 20 | 4 | 40 |
| Total | 100 | 26 | 375 | 26 | 395 |
The unweighted scores tie at twenty-six each, which already tells you the checklist's forty-six-to-thirty-four verdict was measuring something other than fit. Then the weights do their work. Tool A's strengths — scale and integration — sit in families worth ten points each, so its perfect fives earn fifty points apiece. Tool B's strengths sit in alerting and usability, worth twenty and fifteen, so its fives earn a hundred and seventy-five. Tool A's weaknesses are in exactly the places this team said mattered most after being burned by a noisy, expert-only tool. Tool B wins by twenty points, and more importantly, it wins for reasons the team wrote down before either product walked in the door.
The lesson is not that narrower tools are better. Swap the situation. Consider a five-site organisation with a dedicated monitoring specialist, a ticketing system that must be fed automatically, and growth on the roadmap. Then the weights change, and Tool A wins comfortably with the very same scores. The sheet does not have an opinion about tools. It has an opinion about you, captured before any demo could colour it. It applies that opinion consistently to everything you look at afterwards.
Tip: if the sheet produces a result that surprises you, do not change the weights. Sit with the surprise for a day and ask which is wrong: the weights you set calmly, or the feeling you picked up in a demo. It is usually the feeling. If, after that day, you still believe a weight was genuinely mistaken, change it openly, record why, and re-score every candidate, not just the one that benefits.
Keeping the sheet honest
At Harbourview Clinic the scoring sheet was filled in on the Friday, the decision having been made on the Thursday. The weights were chosen with the winner already known, and by a remarkable coincidence the winner led in every family worth more than ten points. The sheet was filed with the purchase order as evidence of a rigorous process. A year later, with the tool's alerting muted ward by ward, someone found the sheet. They noticed that alerting quality had been weighted at five, one point below report templates. Nobody could remember why. Everybody could guess.
A few working habits keep the sheet from decaying into the checklist it replaced. Have each evaluator score independently before anyone compares numbers, then reconcile the differences in a short meeting. The discussion about why one person gave a 2 and another gave a 4 is where the real understanding lives. That understanding is lost if everybody scores together and drifts toward the loudest voice. Record the evidence for every score in a sentence, with the scenario number where there is one. That way, six months later the sheet still explains itself.
Check the must-haves separately and first. The weighted total is for comparing candidates that have already passed the walk-away conditions. A tool that fails a must does not get scored at all, no matter how many points it would have collected elsewhere. This is what stops a spectacular integration catalogue from outvoting "it cannot run on the only server we have." And treat the total as an aid to judgment rather than an oracle. If two candidates finish within a few points of each other, the sheet is telling you they are genuinely close. In that case, the deciding factor might reasonably be something the sheet cannot capture. An example is which support engineer answered your question like a colleague. Say so in the decision record and move on.
Finally, keep the sheet after the decision. When renewal comes around, re-scoring the incumbent against the same criteria is a cheap way to find out whether the tool still fits. Does it fit the network it now watches? Or have the weights shifted enough that it is time to look again?
Where to go next
A scoring sheet with weights set blind, scales defined in advance, and an evidence rule is the difference between a decision you can explain and a decision you have to defend. Build it once, use it to compare only candidates that have cleared your must-haves, and let the proof of concept fill in the top scores. It will never have a tick in every cell, and that is how you know it is working. The remaining guides in How to Choose a Network Monitoring Tool cover the cost family in depth and the art of telling real needs from demo glitter. They also cover the end-to-end playbook that ties requirements, sheet, and proof of concept together for a small team.
Put this into practice with SysPeep Monitor
A scoring sheet only earns its top scores from tools you have run on your own network. So the fairest candidates are the ones you can install and test without ceremony. SysPeep Monitor is one such option. It is a Windows-hosted monitoring service with automatic discovery, SNMP and WMI collection, dependency-aware alerting, and a free trial. The trial lets you score it against your own scenarios rather than a brochure.
Download Free TrialLearn About SysPeep - All Rights Reserved.