
Digital Experience Monitoring in Plain Language
There is a Monday that every administrator eventually gets. The monitoring wall is green from edge to edge: every switch up, every server idling, the internet link half empty, the ping graphs flat. The help desk phone is ringing anyway, and the finance team is standing at your desk to say that "everything is slow." Both of those things are true at the same moment. The gap between them has a name, and closing it is what digital experience monitoring (DEM) is about.
DEM is a category name, the kind that arrives on a vendor slide and sounds as if it needs a budget and a consultant. It does not. Underneath the name it is a change of vantage point. Infrastructure monitoring asks "are my components healthy?" DEM asks "what is it actually like to use our systems from where the users sit?" I have seen that second question answered with an expensive tool. And I have seen it answered with a scheduled script, a spare laptop, and a help desk that writes down the time of day. The second answer was not the worse one.
By the end of this guide you will be able to explain why green dashboards and unhappy users coexist. You will be able to name the layers that add up to an experience. You will know precisely what DEM adds to the infrastructure monitoring you already run (and what it does not replace). And you will be able to pick a starting point that fits a small team.
In this guide
- Why the dashboard is green and the users are not
- The five layers that make up an experience
- What DEM adds, and what it does not replace
- Three ways to measure experience
- A worked example: one slow morning, layer by layer
- Starting with what you have
Why the dashboard is green and the users are not
Classic infrastructure monitoring watches components. It asks each switch, server, firewall, and link a simple question on a schedule: are you up, and are your own numbers within limits? That is enormously valuable, and it is exactly what you should build first. Every experience finding ends in a question that only a component graph can answer. But a user never experiences a component. A user experiences a journey. Open the laptop, connect to Wi-Fi, look up a name, cross the VPN, reach a cloud application. Wait for a server to think, render the page. Every hop on that journey can be individually "fine" while the sum is miserable.
Think of a morning commute. The traffic authority's dashboard shows every road segment flowing normally. Your commute still took ninety minutes. Your car needed a jump start, and your street was blocked by a delivery van. The highway was flowing but at exactly the speed limit, and the parking garage gate was stuck. No single segment would trip an alarm. The commuter, however, is not measuring segments. The commuter is measuring "how long until I am at my desk."
There are three specific reasons the two stories diverge. First, vantage point: your monitoring system lives in the server room and measures from there. So it never sees the last thirty metres of Wi-Fi, the laptop's overloaded disk, or the home router of a remote worker. Second, averaging: a five-minute poll that reports 2% packet loss looks harmless (averages are very good at looking harmless). But if all of that loss happened in one thirty-second burst during a video call, the user experienced a frozen meeting, not a gentle 2%. Third, thresholds describe components, not people: a link at 60% utilization is healthy by any rule you would write. But the one user whose upload is queued behind everyone else is still waiting.
None of this means your dashboards are lying. They are answering the question they were built to answer. DEM exists to ask the other question.
The five layers that make up an experience
The most useful mental model in this whole subject is a stack. When a user clicks something, the click passes through a series of layers, each of which can add delay or failure. The experience the user feels is the total. Learn the layers and every vague complaint becomes a short list of places to look.
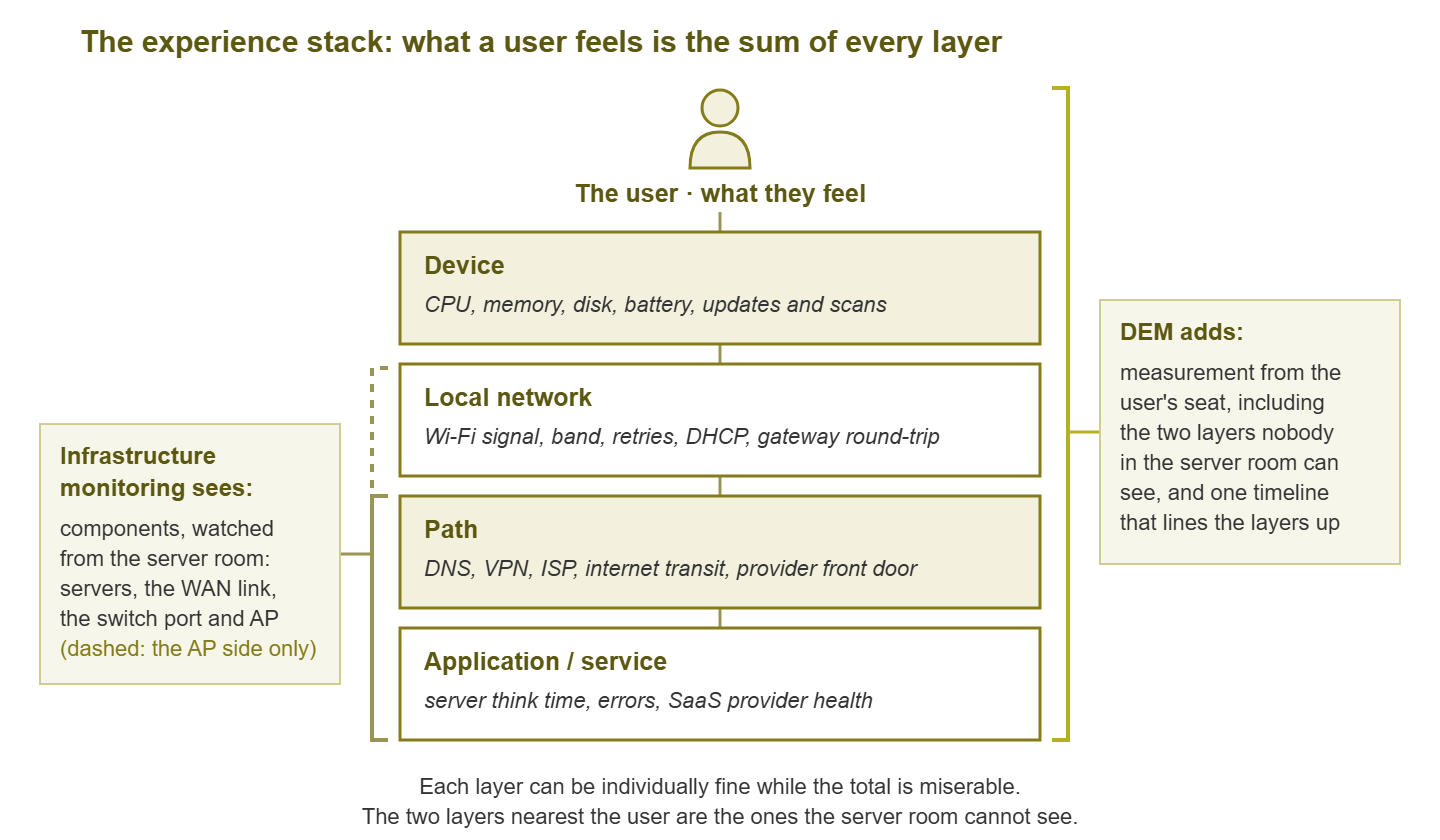
Figure 1: The experience stack. Infrastructure monitoring watches the lower layers from the server room. DEM measures the whole journey from the user's seat and adds the layers the switch cannot see.
Layer 1: The device
The laptop, desktop, tablet, or handheld scanner the user is holding. This layer contributes far more "slowness" than most network admins expect, because a struggling device feels exactly like a struggling network. A machine that has run out of memory and is swapping to disk renders every web page slowly. The user sees a spinning browser and files a ticket about the internet. Watch for CPU saturation, memory pressure, a disk that is full or busy, and a battery in power-saving mode that throttles the processor. Watch for background work — operating system updates, security scans, cloud file synchronization — that quietly eats the machine at ten in the morning. A laptop with forty tabs open reports, quite sincerely, that the network is slow.
Layer 2: The local network
Everything between the device and your first router, which for most people today means Wi-Fi. Signal strength, which frequency band the device chose, how often frames have to be retransmitted, and how long it takes to obtain an address over DHCP all live here. The single most useful number in this layer is the gateway round-trip time: how long a tiny message takes to reach your local router and come back. On a healthy wired connection that is well under a millisecond. On Wi-Fi a few milliseconds is normal. When it climbs into the tens or hundreds, the user's whole world lags, and no server-side graph will show it.
Layer 3: The path
The road from your router to the application. It starts with DNS, the lookup that turns a name into an address. That is a hidden step in front of nearly every action and a famous source of mysterious delay. The path may include a VPN (a virtual private network, an encrypted tunnel that carries a remote user's traffic back to the office, sometimes adding a long detour). Then comes your internet provider, the public internet, and the front door of whatever cloud service the user is trying to reach. You own the first and last few metres of this road and rent the rest, which is why measuring it matters more than controlling it.
Layer 4: The application or service
This is the thing the user actually wanted: a file server, a line-of-business application, or a SaaS product. SaaS is software as a service, meaning an application somebody else hosts and you reach through a browser. The main quantity here is server think time — how long the service takes to build a response once the request arrives. Also relevant are errors, timeouts, and whether the provider is having a bad day. When a SaaS application is slow for everyone on earth, your network is innocent, and it is nice to be able to prove that quickly.
Layer 5: The human
The layer no tool measures directly and every complaint is filtered through. A two-second wait is fine when generating a report and infuriating when typing in a spreadsheet. A slowdown at 8:55 before a 9:00 presentation is a crisis; the same slowdown at lunch is invisible. People also compare against yesterday, against their home connection, and against a colleague's newer laptop. Experience is measured against expectation, not against a threshold. The practical consequence is that "slow" is a relationship between a measurement and a context, and you need to capture both.
What DEM adds, and what it does not replace
Strip away the marketing and DEM adds two things to the monitoring you already run.
The first is measurement from the user's seat. Instead of, or in addition to, asking the server how it feels, you measure how long a real action takes from an actual endpoint. That could be a laptop in the sales office, a handheld in the warehouse, or a remote worker's kitchen table. That single change in vantage point captures the device layer and the local network layer, which your server room can never see. It measures the path in the direction the user travels it. Nobody's desk is in the server room, and that is the whole problem.
The second is correlation across layers. The value is not any one metric. It is putting the device's CPU, the laptop's Wi-Fi signal, the DNS timing, the VPN state, and the application's response time on one timeline, next to the complaint. When a user says "it was slow around ten," you want to look at one screen. You want to see that at ten the machine was installing updates, or the access point was overloaded. Or the SaaS provider was slow for everybody. Correlation turns a vague feeling into a specific layer.
DEM does not tell you which switch port is throwing errors, which disk is full, or which router lost its uplink. It tells you that something between a specific user and a specific service was slow at a specific time, and roughly which layer. Infrastructure monitoring then tells you what. The two are not competitors; they are the two halves of a diagnosis. A shop that has only DEM knows users are unhappy and cannot find the cause. A shop that has only infrastructure monitoring can find causes and does not know which ones users felt.
At Meridian Parts the network team closed a quarter with the cleanest availability report it had ever produced. Every link was above target, every server was green, and not one alert was anything other than a test. During the same quarter the sales team's CRM took nine seconds to open a record, every time, for everyone in the sales office. CRM means customer relationship management system, the application where every customer and order lives. The cause was a proxy setting pushed to the sales laptops the previous spring. It sent each request through a box in another building before it reached the application. Nothing in the server room had ever travelled that road, so nothing in the server room had measured it. Nobody opened a ticket, because the sales team had concluded that the application was "just like that". The two facts met in the quarterly review, in the same slide deck, four pages apart.
| Question | Infrastructure monitoring | Digital experience monitoring |
|---|---|---|
| Is the core switch up? | Yes, directly | Only indirectly, as everyone being unreachable |
| Is the file server's disk full? | Yes, directly | No; it sees slow saves |
| Is Wi-Fi bad at the far end of the warehouse? | Partly: AP up, client counts | Yes: signal and retries as the scanner sees them |
| Is Dana's laptop the reason Dana's apps are slow? | No | Yes, from device metrics |
| Is the SaaS CRM slow for our users right now? | Partly: reachability from the server room | Yes, timed from user locations |
| Which of these did users notice? | No | Yes; that is the whole point |
Three ways to measure experience
There are three families of technique, and a mature setup uses all three. Each answers a slightly different question and has a distinct blind spot.
Synthetic checks from user locations
A synthetic check is a robot user: a scheduled test that performs a fixed action. That might be resolving a name, loading a page, logging in, or opening a file. The test records how long it took and whether it worked. The word "synthetic" just means the traffic is generated by the test rather than by a person. The important twist for DEM is where the check runs. From the server room it measures the path from the server room, which is not where anybody sits. Run it from a small machine in each office, or from a laptop that lives with each team. Then it measures the journey users actually take. Synthetic checks are consistent, cheap, and run at three in the morning when nobody is around to complain. That makes them ideal for trend lines and for catching problems before the first person arrives. Their blind spot is that they measure one fixed action from one fixed device, which is never quite what any real user is doing.
Real-user telemetry from endpoints
Telemetry is data that a device reports about itself. Real-user telemetry means collecting, from the actual laptops and desktops, the numbers that describe the layers above. These are CPU, memory, disk, Wi-Fi signal, gateway round-trip, DNS timing, VPN state, and how long real application requests took. It can be gathered by a lightweight agent (a small always-on program) or by a scheduled script that runs every few minutes and reports a summary. This is the only technique that sees the device layer at all. It is also the only one that measures what real people experienced rather than what a robot did. Its costs are that it touches every machine and produces a lot of data if you are careless. It also raises privacy questions that you must answer in the open. Collect health, not content, and tell people what you collect.
The help desk as a sensor
Your ticket queue is already an experience monitoring system with an extremely sensitive detector: people. It is noisy, biased toward those who complain, and blind to everyone who silently gave up, but it captures the human layer that no telemetry can. The trick is to make it structured. Suppose every "it is slow" report records the time, the location, the application, and the device. The queue becomes data you can lay on the same timeline as everything else. Without those four fields it is just a mood.
| Technique | Sees | Blind to | Effort to start |
|---|---|---|---|
| Synthetic from user locations | Path and application, consistently, all day | Real devices, real usage, the human layer | Low: a script on one box per site |
| Real-user endpoint telemetry | Device, local network, path, and real app timings | Nothing directly, but drowning in data is easy | Medium: a script or agent on many machines |
| Help-desk signal | The human layer: what people noticed and cared about | Silent sufferers; anything nobody reported | Low: four fields on a ticket form |
A worked example: one slow morning, layer by layer
Suppose the finance team reports that their accounting application "has been slow all morning." Your infrastructure dashboard is green. Walk the stack from the top, and do not stop at the first layer that confesses, because problems love to compound.
- The human. Ask what "slow" means and when it started. The answer: opening a ledger takes twenty seconds instead of two, and it began around 9:15. Two people are affected; a third in the same room says it is fine. Already this is informative: it is not the whole office and not the whole application.
- The device. Look at the two affected laptops. Both show a security scan running since 9:10, with the disk busy near its limit. The unaffected colleague's machine finished its scan overnight because it was left on. This is a strong candidate, but do not stop here.
- The local network. The two affected users sit at the far end of the room. And their laptops report a weak signal on a congested band with high retransmissions. The colleague sits under the access point. Now you have two contributing causes, neither of which any switch or server could have reported.
- The path. A synthetic check that opens the same ledger from a test machine in the server room shows two seconds all morning. The path and the application are innocent, and you can say so with evidence rather than a shrug.
- The application. Confirmed healthy by the same synthetic check and by the vendor's status page.
The fix is boring — schedule scans for lunch, move or add an access point — but notice what happened. A complaint that would have led to an hour of staring at green graphs became a ten-minute walk down a list. That was because you knew which layers exist and had at least one way to look at each.
Tip: when infrastructure looks green and a user is unhappy, the most likely layers are the ones your monitoring cannot see: the device and the local network. Start there before you re-check the graphs you have already stared at.
Starting with what you have
You do not need to buy anything to begin. The honest version of DEM for a small team is a handful of habits that make the layers visible one at a time.
- Pick three journeys that matter. Not three servers: three things people do. "Open the CRM and search a customer." "Log in to the VPN and open the shared drive." "Join a video call." Everything you measure should be in service of one of these.
- Run one synthetic check from a user location. Use a small machine or spare laptop in the main office. Have it run those three journeys (or a simplified stand-in, such as a timed page load) every few minutes and log the result. This gives you a trend line that does not depend on anyone complaining.
- Add four fields to the ticket form. Time, location, application, and device name. Nothing else changes. In a month you will have a map of where and when pain happens.
- Instrument a few reference endpoints. Ask two or three friendly users per site or per role whether you can run a small script on their machine. The script records device health and gateway round-trip every few minutes. Their machines become your canaries.
- Put it all on one timeline. Even a spreadsheet works at first. The moment you can see the complaint, the endpoint numbers, and the infrastructure alerts side by side, correlation becomes a routine task rather than an aspiration.
Each of those steps is a rung on a ladder. Climb the first two and correlation stops being a word on a slide and becomes a thing you do on a Tuesday. The ladder is the subject of Digital Experience Monitoring on a Small-Team Budget. That guide also covers the honest signs that you have outgrown do-it-yourself and a dedicated tool would earn its keep.
Where to go next
Keep one idea from all of this: the stack. Infrastructure monitoring watches components from the server room. Users feel journeys from their seats. DEM measures the journey from the seat and lines the layers up on one timeline. That way, the next time the finance team arrives at your desk on a green Monday, you have somewhere to look. You can look beyond the graphs you have already stared at. The wall will still be green. It will just have stopped being the whole story. From here, Endpoint-Side Metrics goes deep on what the laptop knows that the switch does not. The guide on Experience Scores shows how to turn many metrics into one honest number. And Closing the “It Feels Slow” Gap deals with matching feelings to measurements. The pillar page, Digital Experience Monitoring: From Device Health to User Happiness, ties them together.
Put this into practice with SysPeep Monitor
DEM sits on top of infrastructure monitoring, not instead of it. Endpoint numbers only make sense next to a trustworthy timeline of what your switches, servers, and links were doing. SysPeep Monitor builds that timeline. It discovers your devices, collects their health over SNMP and WMI, and puts alerts and graphs in one web console. It has remote probes for the sites where your users actually sit. The free trial installs on any Windows machine.
Download Free TrialLearn About SysPeep - All Rights Reserved.