
Session Tables and Connection Limits: The Ceiling You Forgot
There is a category of outage that makes experienced admins doubt their own sanity. The firewall is up — it answers ping, you can log into it. Some users are working normally. Others cannot load anything. Web pages come up half-drawn, with images missing. A user retries and suddenly it works. Nothing is fully down; nothing is fully up. The monitoring dashboard, naturally, is a wall of green.
That pattern — existing things work, new things fail, retries roll the dice — has a name. It is one of the most predictable failures a firewall can have: the session table is full. Your firewall keeps a small note about every conversation passing through it. It has a hard maximum number of notes. When the notepad is full it simply refuses to start tracking anything new. The number was printed on the datasheet the day you bought the box. Almost nobody monitors it.
This guide fixes that. You will learn what state tracking actually is (in plain language). You will learn why the limit is a hard ceiling rather than a soft slowdown. You will learn how to recognize the signature weirdness of exhaustion from the user complaints alone, and what fills tables up. And you will learn how to monitor session count against capacity. That way, you get a calm warning days — or at least minutes — before the wall.
In this guide
- A note per conversation: state tracking in plain language
- Why the ceiling is hard
- The signature weirdness of exhaustion
- What fills the table
- Monitoring count against capacity
- Finding the session hogs
- Timeout tuning, gently
- A starter checklist
A note per conversation: state tracking in plain language
Modern firewalls are stateful, which is a compact way of saying they remember. When your laptop opens a connection to a web server, the firewall does not just wave the first packet through and forget about it. It writes itself a note: laptop 10.20.14.31, port 61022, is talking to server 192.0.2.80, port 443, over TCP; conversation established; last activity just now. That note is a session (some products say "state entry" or "connection"; same idea). The collection of all current notes is the session table.
The notes are what make a stateful firewall smart. When a reply packet arrives from the internet, the firewall checks its notes: "am I expecting this?" If a note matches, the reply sails through. In that case, there is no need to re-evaluate the whole rule list, and no need for a risky rule allowing inbound traffic. If nothing matches, the packet is an uninvited stranger and gets dropped. State tracking is also what makes NAT (network address translation) possible at all. The note records which inside device each outside conversation belongs to, so replies can find their way home.
One detail that surprises people: notes are not only for TCP. UDP has no formal "connection," but the firewall still creates a session per exchange so replies can return — every DNS lookup briefly owns a slot. Even pings get tracked. If it crosses the firewall, it almost certainly costs a note.
Every note has a lifespan. When a TCP conversation closes politely, the note is torn up within seconds. A conversation may just stop — the laptop went to sleep, the app crashed, the packet got lost. In that case, the firewall cannot know it is over. So it keeps the note until an idle timeout expires. Timeouts are the janitorial service of the session table, and as you will see, they matter enormously.
Why the ceiling is hard
Each note costs a small, fixed chunk of memory, and that memory is set aside when the firewall is designed. A given model can track some maximum number of concurrent sessions. That means tens of thousands on a small office box, millions on a data-center appliance. That maximum is a genuine wall. This is not like CPU, where an overloaded box gets slower and grumpier by degrees. A session table at its limit does not slow down. It hits the limit, and then every packet that would need a new note is dropped on the floor. One connection under the limit: everything is fine. One over: refusal.
Two wrinkles are worth knowing. First, the ceiling is a property of the model, not the license tier alone. On some products, though, licensing or enabled features can lower the effective number. And heavy inspection features can make each session cost more memory. The honest figure for your box is in its documentation, and the firewall itself will usually report both current count and maximum. Second, some firewalls are split into virtual instances (one physical box acting as several logical firewalls), each with its own share of the table. In that setup one busy instance can hit its own ceiling while the box as a whole looks comfortable. So monitor the limit that actually applies to your traffic.
A related ceiling hides nearby: the new-sessions-per-second rate. Even with table space free, a firewall can only create notes so fast. A burst of thousands of connection attempts per second can max out session setup while the table itself is half empty. That burst might be a busy moment, a scan, or an attack. If your product exposes a setup-rate counter, graph it too; it is the same story on a faster clock.
The signature weirdness of exhaustion
Session exhaustion produces symptoms so distinctive that, once you have seen them, you can diagnose it from the hallway complaints alone. The key is the split: established conversations have notes, so they keep working. New conversations need notes, so they fail. Everything strange about the outage follows from that one sentence.
A web page half-loads because the page itself arrived over a connection that already existed. But the images, scripts, and fonts wanted fresh connections, and those were refused. A retry sometimes works because, in the seconds between attempts, an old session somewhere timed out and freed one slot. In that case, your retry won the race for it. The video call that started before the trouble continues in blissful ignorance while the colleague trying to join gets a spinner. File transfers started earlier keep transferring. Logins hang. And the firewall answers ping the whole time. On many setups your monitoring traffic either matches an existing note or does not traverse the data plane at all. So the dashboard stays green while the session table stands at the door like a bouncer at a full club. Nobody new gets in, no matter how nicely they ask.
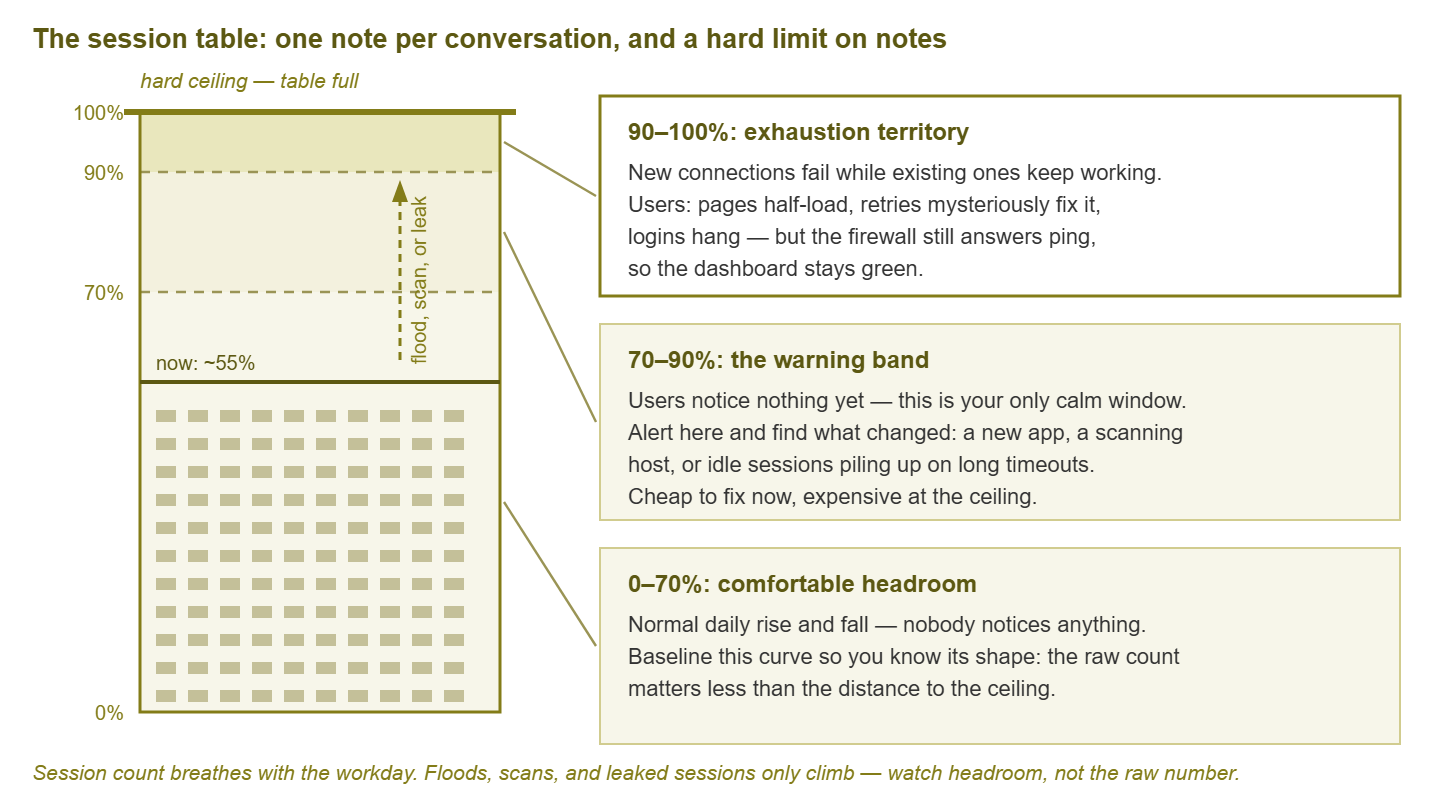
Figure 1: The session table as a tank with a hard ceiling. Each band has a user-visible story — and only the middle band gives you a calm window to act.
The half-broken quality is exactly why exhaustion wastes so much troubleshooting time. It does not look like a firewall problem; it looks like a flaky application, a DNS issue, "the internet being weird." Teams restart web servers, blame the ISP, and clear browser caches while the actual cause sits in one unmonitored counter. The tell to remember: old traffic fine, new traffic failing, retries occasionally winning. When you hear that trio, check the session count before you check anything else.
Confirming it takes about a minute. Log into the firewall (the management plane still works, remember) and ask for the session summary. Every product has a one-line command or status page showing current sessions against the maximum. A number kissing the ceiling is your answer. Most firewalls also write a log message when they start refusing sessions for lack of table space. So if logs are being collected centrally you may find the confession already on file, timestamped minutes before the first complaint. Compare that with the lookalikes. A DNS failure breaks name lookups for new and old alike, and a DHCP problem strands specific machines entirely. Only session exhaustion produces the everything-half-works lottery.
What fills the table
Tables fill for four broad reasons, and telling them apart matters because the fixes are completely different:
- Chatty applications, multiplied by growth. A single browser tab can hold dozens of connections. A phone checks a dozen services in the background. Every smart screen, sensor, and doorbell adds its own steady trickle. None of it is malicious — it is just more sessions per person every year the network grows. This is the slow, honest way to outgrow a table.
- Scanning malware. An infected inside host probing thousands of addresses and ports opens a session attempt for every probe. One compromised desktop can plant tens of thousands of notes almost instantly — which means the session table often notices an infection before the antivirus does. A sudden vertical spike in session count is a security signal, not just a capacity one.
- Denial-of-service traffic. Some attacks aim precisely at state: floods of connection openings (half-open TCP handshakes are the classic) designed to fill tables rather than links. Your internet pipe can be nearly idle while the session table drowns.
- Long timeouts letting the dead pile up. Every abandoned conversation lingers until its idle timeout. Generous timeouts — hours for idle TCP on some defaults — mean the table carries a growing museum of dead sessions. Those sessions use slots that living traffic needs. This one is self-inflicted, common, and very fixable.
Real incidents are often combinations: a table already fat with idle sessions gets pushed over the edge by an ordinary busy morning. The graph you keep (next section) is what lets you say which story you are in.
Monitoring count against capacity
The metric you want is simple: current sessions as a percentage of maximum, polled every few minutes, graphed forever. Most firewalls expose both numbers over SNMP (Simple Network Management Protocol — the standard way monitoring tools query devices) or through their API and CLI. If your product only reports the current count, find the model's maximum in its documentation. Then configure the capacity in your monitoring tool so the percentage is computed for you. A raw count with no ceiling next to it is trivia; the same count as "82% of capacity" is a call to action.
Set two thresholds with real headroom. Warn around 70% of capacity: users feel nothing there. That is exactly what makes it the right moment to investigate on your schedule instead of during an outage. Alert around 85–90%: at that point something abnormal is almost certainly happening and you may be minutes from the wall. Do not set the alert at 95% — a scanning host or flood can cover the last few percent faster than you can read the email. If your tool supports it, add a rate-of-change alert as well. Session count doubling inside a few minutes deserves attention even if it starts from a low floor. That doubling is the shape of a scan or an attack rather than a workday.
The bands translate directly into what users feel, which is worth pinning up next to the graph:
| Table level | What users experience | Your move |
|---|---|---|
| Under 70% | Nothing — normal headroom | Baseline the curve; enjoy the quiet |
| 70–90% | Still nothing — the calm window | Warn; find what changed while it is cheap |
| 90–100% | Sporadic new-connection failures begin | Alert; hunt the hog now |
| At the ceiling | Half-loaded pages, hanging logins, retry roulette | Incident: shed the source, free slots, add capacity |
Then let the graph teach you your baseline. A healthy session curve breathes: low overnight, climbing through the morning, sagging at lunch, falling in the evening. Once you know your shape, deviations become obvious at a glance. A curve that stops falling overnight suggests sessions leaking rather than closing. A staircase that only rises suggests something opening connections and never letting go. The absolute number matters less than the distance to the ceiling and the direction of travel, which is exactly what Figure 1 is about.
Tip: record the session count during your busiest known moment. The first morning back after a holiday is a classic peak. Compare that count to the table maximum. If your normal peak already sits above half of capacity, you do not have an incident. But you do have a planning fact worth writing down before the next growth spurt turns it into one.
Finding the session hogs
When the count spikes, the next question is always the same: who is doing it? The answer is a per-source breakdown — how many sessions each inside host currently owns. Nearly every firewall can produce this at the CLI. That per-source breakdown is the single fastest way to separate "everyone is a bit busier" from "one machine has lost its mind." Generic output looks like this:
fw01> show session summary by-source
Active sessions:      612,449 / 1,000,000   (61%)
Session setup rate:   1,240 per second

Top sources by session count:
  10.20.14.77      31,208    <-- one desktop should not own 31,000 conversations
  10.20.8.51        2,914
  10.20.9.12        2,660
  10.20.8.200       2,481
  10.20.15.3        1,975
Read it the way you would read a donation list with one suspicious entry. The cluster of hosts in the low thousands is probably normal for your environment — servers, proxies, and NAT points legitimately hold many sessions. The outlier at the top, ten times its nearest neighbor, is where you go next. Look at what its sessions are. Thousands of connections to one destination suggests a broken app hammering a server in a retry loop. A few sessions each to thousands of different destinations is the fingerprint of scanning. That machine should come off the network before you finish your coffee.
Notice this is the same investigation you run for bandwidth, with a different currency. A host can hog sessions while barely moving bytes, and vice versa. The judgment framework carries straight over: telling legitimate hogs from suspicious ones works the same whether the hog is eating megabits or table slots.
Timeout tuning, gently
Abandoned sessions occupy the table until their idle timeout expires. So timeouts are your main lever on how much dead weight you carry. The lever deserves a gentle hand, because it cuts in both directions. Too long, and the table fills with ghosts. Too short, and the firewall starts tearing up notes for conversations that are merely quiet. Examples are the database connection that waits patiently between queries and the SSH window someone left open. Another is the monitoring agent that reports once an hour. Those show up as maddening "my connection randomly drops" tickets, which are no improvement on the problem you were fixing.
So tune with restraint, in this order. First, look before touching. Many products can show session counts grouped by state or age. A table where a large share of entries are idle or half-open is the green light that tuning will actually help. Second, prefer per-service adjustments over global ones. Short-lived protocols like DNS lookups have no business holding long timeouts. Long-lived ones (databases, remote sessions, VPN-carried traffic) should keep generous limits. Third, change one thing at a time, modestly, and watch two graphs for a week. Watch session count (should sink) and helpdesk tickets about dropped connections (should not rise). Fourth, leave protections like half-open connection limits and aggressive-aging features (which shorten timeouts automatically only under pressure) to do their job. Enabling a pressure-relief feature is usually safer than hard-shortening everything.
If you find yourself tuning timeouts every quarter to stay under the ceiling, stop and rename the project. In that case, the table is simply too small for the network. The honest fix is capacity, not increasingly creative janitorial work.
A starter checklist
Everything above, condensed into an afternoon of setup:
- 1. Find your ceiling. Get the session maximum for your model (and per virtual instance, if split) from the documentation or the device itself. Write it where the team can find it.
- 2. Graph count vs capacity. Poll current sessions every few minutes; store it as a percentage of the maximum.
- 3. Set headroom thresholds. Warn near 70%, alert near 85–90%, plus a rate-of-change alert for sudden spikes if supported.
- 4. Learn the per-source view. Practice the "top sources by session count" command on a calm day, so the incident is not your first rehearsal.
- 5. Baseline for a few weeks. Know your daily curve and your busiest peak before judging any number.
- 6. Only then consider timeouts. Tune per-service, gently, one change at a time — and treat repeated tuning as a capacity smell.
Where to go next
The session table is the sharpest example of the theme running through this whole pillar. A firewall's worst failures happen behind a green light, in counters nobody put on the dashboard. Session count is one such counter. CPU under inspection load, memory, and the hardware sensors are its siblings. They are covered in Firewall Health: The Metrics Behind the Little Green Light. When the table does hit trouble, the event usually announces itself in the logs before the phones ring. Wiring that warning into a real alert is part of Firewall Logs: Alerting on What Matters. The rest of the series lives at Firewall Monitoring Beyond Up/Down.
Put this into practice with SysPeep Monitor
The session table fails quietly right up until it fails loudly — the trick is watching the counter. SysPeep Monitor polls session counts and the rest of your firewall's health numbers over SNMP. It graphs them against capacity and alerts at the headroom thresholds you choose. That way, you meet the ceiling in a calm week rather than a bad morning. The free trial installs on any Windows machine in minutes.
Download Free TrialLearn About SysPeep - All Rights Reserved.