
Virtual Switches in Plain Language: The Network Inside the Host
Somewhere in your server room there is one machine doing the work of twenty. It is a single physical server with two network cables. Inside it are a domain controller, a file server, a database, and a small crowd of other virtual machines, all busily talking to the world. Now ask the question that quietly stumps most people in their first week with virtualization: what switch are those twenty machines plugged into? You cannot touch it. It has no link lights, no fans, no serial number, and it does not appear in your switch inventory. It is a switch made entirely of software, and it lives inside the host.
That software switch — the virtual switch, or vSwitch — is one of the most important network devices you own. It is usually the least monitored, least documented, and least understood. If you learned networking as boxes and cables, virtualization moved a large chunk of your network inside a computer, where your usual tools cannot follow. Traffic between two VMs on the same host never touches a wire. Your carefully monitored physical switch sees one busy port and has no idea twenty machines are behind it.
This guide explains the virtual switch in plain language: what it actually is, and how virtual ports and port groups work. It explains how VLAN tagging happens at the virtual layer, and exactly how a packet travels from a VM out to the physical world. By the end you will understand why traditional monitoring is half-blind inside a virtualization host, what you can measure, and which five questions to ask of any hypervisor you meet. Everything here is vendor-neutral — every mainstream hypervisor has these pieces, just under slightly different names.
In this guide
- A switch made of software
- Virtual ports, vNICs, and port groups
- VLAN tagging at the virtual layer
- From the VM to the physical world
- Why your physical switch sees one busy port
- Why traditional monitoring is half-blind here
- The monitoring surface: what you can measure
- What exists on almost every hypervisor
A switch made of software
Start with two quick definitions. A hypervisor is the software layer that lets one physical server run many virtual machines (VMs) at the same time. Each VM is a complete computer, with its own operating system, that exists as software instead of hardware. The physical server running the hypervisor is called the host, and the VMs on it are often called guests.
Each guest believes it has a network card, because the hypervisor shows it one. And a network card needs to plug into something. That something is the virtual switch: a program inside the hypervisor that does the same job a physical switch does. A physical switch learns which MAC address (the burned-in hardware address of a network card) lives on which port. It forwards each frame (the unit of traffic at this layer) only where it needs to go. The vSwitch keeps the same kind of table. But its "ports" are software objects, and "forwarding a frame" means copying data from one area of the host's memory to another. No cable, no signal, no electricity crossing a wire. Just a very fast memory copy.
An analogy that holds up well: think of the host as an office building with its own internal mailroom. Mail between two offices in the building goes through the mailroom and never visits the public post office. Only mail addressed to the outside world leaves through the loading dock. The vSwitch is that mailroom; your physical switch is the post office; the loading dock is the host's physical network card. The post office genuinely has no record of the internal mail — not because anyone hid it, but because it never passed through.
One consequence is worth planting early: because forwarding is done by software, its speed and reliability depend on the host's CPU and memory, not on cable ratings. Two VMs on the same host can exchange data faster than any cable in your building. And when the host's CPU is starved, the "network" between VMs gets slow or drops packets even though every physical link is perfect. The vSwitch is a network device whose health metric is the host itself, a theme the guide on monitoring the hypervisor host takes further.
Virtual ports, vNICs, and port groups
Three building blocks make up the virtual side of the picture, and once you can name them, hypervisor networking stops being mysterious.
The vNIC
A vNIC (virtual network interface card) is the network card the hypervisor presents to a guest. The guest's operating system loads a driver for it and treats it exactly like hardware. The vNIC has a MAC address (generated by the platform when the vNIC is created), a link speed, and the usual counters. A VM can have several vNICs, just as a physical server can have several cards. One detail matters for later. The "link speed" a guest reports for its vNIC is mostly a label, not a physical limit. Actual throughput depends on the host, not on the number in the guest's control panel.
The virtual port
Every vNIC plugs into a virtual port on the vSwitch — the software equivalent of a switch port. Virtual ports appear and disappear as VMs power on, power off, or move. There are also special virtual ports facing the other direction: uplink ports, where the host's physical network cards attach to the vSwitch. Keep that word, uplink — it carries most of this pillar.
The port group
Nobody wants to configure hundreds of virtual ports one at a time. So hypervisors let you define a port group (also called a port profile, virtual network, or similar, depending on the platform). It is a named bundle of settings: which VLAN the ports belong to, security options, traffic policies, and which uplinks to prefer. Think of it as a wiring specification for wall sockets. Instead of wiring each socket by hand, you define the "Accounting socket" spec once. Every socket built to that spec behaves identically. Connecting a VM to the network then becomes: pick a port group name from a dropdown. That is the whole act of "cabling" a virtual server.
For you as the person monitoring and documenting all this, the port group name is the closest thing the virtual network has to a patch-panel label. A VM's network identity is essentially "which host is it on, and which port group is it connected to." Well-chosen names make troubleshooting trivial; sloppy ones create mysteries — a problem big enough to earn its own guide on documenting the virtual network layout.
VLAN tagging at the virtual layer
A VLAN (virtual LAN) slices one physical network into several isolated logical networks. Each frame can carry a small numeric tag — the VLAN ID — saying which logical network it belongs to. A link configured to carry many VLANs at once, tags included, is called a trunk. Virtualization leans on VLANs heavily, because a host with two cables might need to reach ten different networks: servers, storage, management, DMZ, and so on. Those two cables are almost always trunks.
The tagging work can happen in three places, and knowing which one your environment uses saves hours of confusion:
- At the physical switch port. The switch port is assigned to one VLAN, and the vSwitch never sees a tag. Simple, but the whole host is stuck on that single VLAN — rare in practice beyond tiny setups.
- At the vSwitch, per port group. This is the everyday arrangement. Each port group carries a VLAN ID. The vSwitch adds the tag as frames head toward the uplink and strips it before delivering frames to a VM. Guests remain blissfully unaware VLANs exist. One vSwitch happily hosts port groups for a dozen VLANs side by side.
- Inside the guest. The port group passes tags through untouched and the guest OS handles its own VLANs. Reserved for special cases like virtualized routers and firewalls.
The middle option creates a quiet contract between two teams' worth of configuration. Every VLAN used by any port group must also be allowed on the trunk of the physical switch port feeding the uplink. Break the contract and you get the classic virtualization failure. Someone creates a port group for VLAN 40, but the physical trunk does not allow VLAN 40. Every VM placed on the new port group is simply unreachable. No error, no log entry, no red icon anywhere — the frames leave the host tagged 40 and the physical switch silently discards them. Keeping the two sides in agreement is a drift problem, and the virtual network inventory guide shows how to catch it before it bites.
From the VM to the physical world
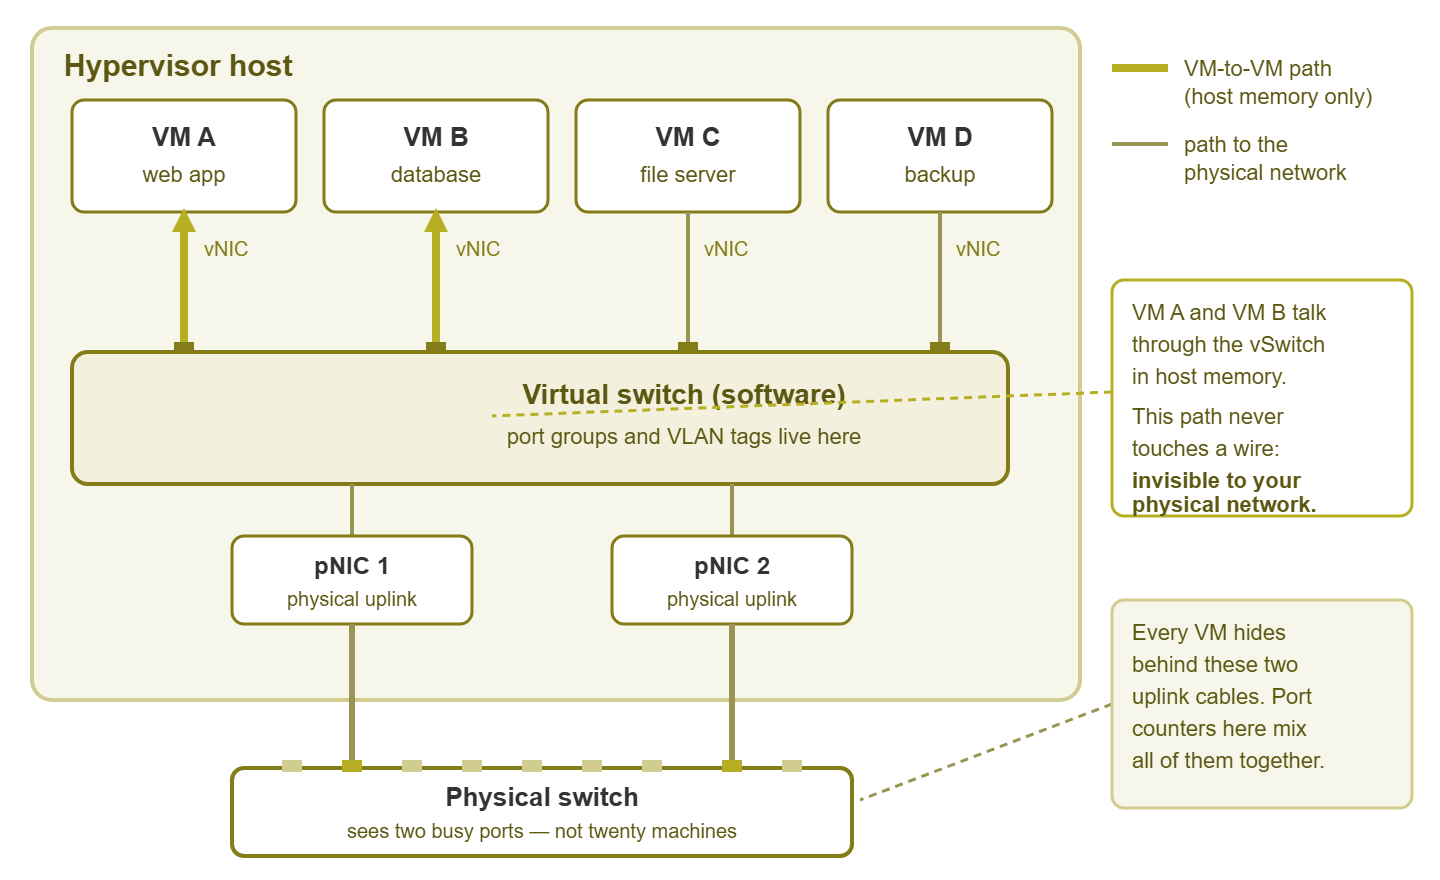
Figure 1: The network inside the host. VM A and VM B talk through the vSwitch in memory — that path never appears on any physical port. Everything else funnels through two uplinks.
Follow one frame from a VM to a desktop PC on the office network, and the whole picture snaps into place:
- Step 1: The guest OS hands the frame to its vNIC driver, exactly as it would on physical hardware.
- Step 2: The hypervisor takes the frame from the vNIC and presents it at the VM's virtual port on the vSwitch.
- Step 3: The vSwitch looks up the destination MAC address in its table. Is the destination another virtual port on this same vSwitch?
- Step 4: If yes — the frame is copied straight to the other VM's buffers. Done. It never existed outside host memory, which is the highlighted path in Figure 1.
- Step 5: If no — the frame heads for an uplink. If several uplinks form a team, the vSwitch picks one according to its load-balancing or failover policy.
- Step 6: The port group's VLAN tag is added, and the physical NIC (pNIC) transmits the frame onto the cable. Your physical switch finally meets it — a frame from the VM's MAC address, arriving on the host's uplink port.
Step 4 deserves its own guide, because "the frame never existed outside host memory" has real operational and security consequences. The guide to VM-to-VM traffic: the invisible east-west path covers when that matters and how to get visibility anyway. Step 5 hides a design topic too. Uplinks are usually built in redundant pairs, so the vSwitch can shift traffic to a survivor when a cable, NIC, or switch dies. That failover is wonderful and silent — silent being the operative problem, as we will see in the monitoring sections.
Why your physical switch sees one busy port
Now stand on the other side of the cable and look back. From the physical switch's point of view, the virtualization host is one port. Maybe two or four, if there are teamed uplinks. Behind that handful of ports: every VM on the host. The switch's MAC address table gives the game away — a normal access port learns one or two MAC addresses; a virtualization uplink port learns dozens. (Handy trick in reverse: a port with a crowd of MACs behind it is almost certainly a hypervisor uplink or another switch. It is a good way to find undocumented virtualization hosts.)
Everything you normally learn from per-port monitoring collapses into aggregates. The traffic counter on the uplink port is the sum of twenty machines. You can see that the host moved a lot of data, but not which VM moved it, or to whom. Port status stops meaning what it used to mean, too: "port up" tells you the host's NIC is alive, nothing more. A VM can be powered off, disconnected from its port group, or on fire in every metaphorical sense, and the physical port stays green. And the VM-to-VM traffic from Step 4 never appears in these counters at all. The busiest conversation in your data center can be completely absent from every physical graph you own.
Tip: label your switch ports and your monitoring accordingly. An uplink to a virtualization host is not "just another server port" — it deserves the treatment you give an inter-switch link: monitored, graphed, and never casually reconfigured. One flapping host uplink is twenty flapping servers.
Why traditional monitoring is half-blind here
Traditional network monitoring, the kind every small shop starts with, does two things. It pings devices to check they are alive. It polls switch ports (usually over SNMP, the standard query protocol for network gear) for traffic and error counters. Point that toolkit at a virtualized environment and it still earns its keep — but only for half the picture.
The half it sees: whether the host and each VM answer pings, how busy each physical uplink is, and whether the physical ports show errors. That half genuinely matters. The uplinks are the shared bottleneck for everything on the host, and watching them is the subject of host uplink contention.
The half it cannot see includes which VM is responsible for uplink traffic, and all VM-to-VM conversations on the same host. It includes frames dropped inside the vSwitch when the host is overloaded, and configuration problems at the virtual layer. A VM on the wrong port group looks, from outside, like a VM that mysteriously cannot reach things. Ping-and-port monitoring answers "is it up and how busy is the cable." Inside a virtualization host, those are no longer the questions that solve tickets. Half-blind is the honest term: not useless, but unable to answer "who" and "why" without help from a second vantage point.
The monitoring surface: what you can measure
The good news: the hypervisor sees everything the physical network cannot. It has to — it is doing the forwarding. Every mainstream platform keeps counters you can read, and together with your existing tools they form a layered monitoring surface:
| Vantage point | What it sees | What it misses |
|---|---|---|
| Physical switch port counters | Total uplink traffic, errors on the cable, link state | Which VM; anything VM-to-VM; virtual-layer drops |
| Host pNIC counters (read on the host) | Uplink traffic from the host's side; drops the host itself records | Which VM; VM-to-VM traffic |
| Hypervisor per-VM / per-vNIC counters | Bytes, packets, and often drops for each VM — including internal traffic | Who each VM talks to (totals, not conversations) |
| Guest OS counters (agent or query inside the VM) | That VM's own view: its interfaces, retransmits, connections | Everything about its neighbors and the host |
| Host health (CPU, memory) | Whether the software switch has resources to forward at all | Not network data — but explains network symptoms |
You reach these numbers in three generic ways, alone or combined. One is the hypervisor's management API (every platform has one; monitoring tools and scripts poll it). Another is SNMP on the host (many hypervisors expose standard system and interface data this way). The third is agents — small programs inside guests or on the host reporting to your monitoring system. Which combination you use matters less than covering the layers: uplinks from the physical side, per-VM counters from the hypervisor, and host health underneath it all.
Per-VM counters typically come back looking something like this — the exact command or screen varies by platform, the shape does not:
vm            vnic     rx-mbit   tx-mbit   drops
web-01        vnic0       41.2      12.8       0
db-01         vnic0      388.6     401.9      12
backup-01     vnic0      903.4       3.1     118
print-01      vnic0        0.2       0.1       0
Even this tiny example tells a story no physical counter could. db-01 and backup-01 are moving serious traffic. And backup-01 is dropping packets — worth a look before anyone opens a ticket.
What exists on almost every hypervisor
This pillar deliberately names no products, because the concepts are what transfer between jobs and platforms. Here is what you can expect to find, in some form, on any mainstream hypervisor:
A per-host virtual switch. The basic arrangement described in this guide: each host has its own vSwitch (or several), configured on that host. It is simple and universal. It is also the source of the drift problems covered later in this pillar. Ten hosts mean ten copies of the configuration that are supposed to match.
Often, a cluster-wide "distributed" switch. Larger deployments usually offer a virtual switch defined once, centrally, and applied to every host in a cluster. That way, port groups exist identically everywhere and per-port statistics can even follow a VM when it moves between hosts. Same concepts, better consistency.
Port groups under assorted names. Port group, port profile, virtual network, logical network, bridge — the vocabulary wobbles. The idea (a named template of port settings, usually carrying a VLAN ID) does not.
Uplink teaming and failover. Every platform can bundle physical NICs for redundancy and spread load across them according to some policy.
Features that vary by platform and edition: the depth of per-port statistics, port mirroring at the virtual layer, flow export from the vSwitch, and traffic shaping. Never assume these exist until you have checked.
Which leads to the practical takeaway. When you inherit any virtualized environment, ask these five questions and write down the answers:
- 1. What is the virtual switch here, and is it per-host or cluster-wide?
- 2. What is the port-group concept called, and where are VLAN IDs set?
- 3. Where do I read per-VM network counters — which screen, API call, or command?
- 4. Can this vSwitch mirror a port or export flow records, and is that licensed and enabled?
- 5. How are the uplinks teamed, and what exactly happens when one fails?
Five answers, one page of notes, and you understand the virtual network layer of that environment better than most people who built it.
Where to go next
You now have the mental model. Guests plug vNICs into port groups on a software switch. The software switch reaches the world through a few physical uplinks. Everything inside is invisible to the physical network. And the hypervisor's own counters are how you get your sight back. The rest of this pillar builds on exactly that model. It covers seeing the invisible VM-to-VM path and surviving twenty VMs on two cables. It covers watching the host itself, and keeping the whole layout documented. Start with whichever pain you have today; they are all waiting in Virtualization & Hypervisor Networking.
Put this into practice with SysPeep Monitor
The physical half of this picture is very monitorable, and it is the half that carries everything. SysPeep Monitor auto-discovers your hosts, switches, and their interfaces. It watches uplink ports and host health over SNMP, WMI, and SSH. It shows the whole estate on live dashboards from one web console. The free trial installs on any Windows machine in minutes.
Download Free TrialLearn About SysPeep - All Rights Reserved.