
The Circuit Evidence File: Logging Outages So They Count
The circuit dropped again this morning. Third time this month, or the fourth? It came back before anyone finished dialing the provider, the way it always does. By lunch the details are gone. By next week the whole event is gone. By contract renewal all that remains is a feeling that the line has been "a bit flaky". Then the account manager asks, pleasantly, "can you give me specifics?" I have been asked that with nothing in my hands. It is a short conversation.
The fix costs five minutes per incident. A circuit evidence file is a running, per-circuit log of every outage and degradation. It includes timestamps, your measurements, the provider's ticket number, and what they said. It is not glamorous. Over time it is one of the most useful documents you own, because small outages are individually dismissible. The same outages listed together with numbers attached are a pattern no provider can wave away. This guide covers what one entry contains and the timestamp and graph-export discipline that keeps entries credible. It covers how scattered incidents build into a chronic case. And it covers how the file gets used for credits, renewals, and escalations.
A scope note. Proving whose side a fault is on during an incident is its own craft, with isolation tests and checks at the demarc. The demarc is the point where the provider's responsibility ends and yours begins. That craft belongs to the incident-side guide. The evidence file is what happens after. It holds the results of that work, and of your continuous monitoring. They are filed so they still exist in three months when they are suddenly worth something.
In this guide
- Why a file beats memory
- The anatomy of one entry
- A worked entry, annotated
- Degradations count too
- Timestamp discipline
- Exporting graphs before retention eats them
- The chronic case: small incidents become a pattern
- Using the file: credits, renewals, escalation
- Keeping the habit sustainable
Why a file beats memory
Three parties keep records of your circuit's behavior, and two of them are unreliable. Your memory compresses a month of small failures into "it's been flaky." It rounds every duration to the nearest dramatic number. And — under the influence of one good week — it forgets the bad ones entirely. The provider's records are precise but curated by their definitions. Under those definitions, outages that never got tickets never happened, and degradations count as up. And the history is kept by the party you would be disputing with. The third record is the one you build: contemporaneous, timestamped, and backed by monitoring data.
"Contemporaneous" is the load-bearing word. An entry written while the graphs are on screen and the support call is fresh carries a credibility that no reconstruction can match. Reconstructions are what you are stuck with otherwise, assembled months later from chat history, old email, and memory. The file also changes your behavior in a quiet way. Once logging an outage costs five minutes, you stop needing the outage to be big enough to be "worth reporting." Everything gets filed. And everything getting filed is precisely what makes chronic problems — the kind made of dozens of forgettable events — visible at all.
The anatomy of one entry
One incident, one entry. The fields below have survived contact with real disputes. Together they answer every question a provider, a boss, or a future you will ask about the event:
| Field | What to record | Why it matters |
|---|---|---|
| Circuit ID | The provider's identifier from the invoice or demarc label | Everything downstream is filed against this, not your company name |
| Start / end | Both timestamps, your timezone stated, from monitoring where possible | Duration claims live or die on these |
| Detected by | Monitoring alert, user report, or found later in graphs | Shows whether the start time is measured or estimated |
| Symptom | Hard down, loss percentage, latency spike, throughput collapse | "Down" and "degraded" follow different SLA clauses |
| Your measurements | Probe results during the event, plus exported graph filenames | The part nobody can argue with later |
| Ticket number | The provider's reference, and when you opened it | Links your record to theirs; starts their clock |
| What they said | Initial explanation and final explanation, dated | The sequence across incidents is often the real story |
| Resolution | What fixed it, who did it, when service actually returned | Distinguishes repairs from lucky recoveries |
| Impact | One line: what the business lost | Turns minutes into meaning at renewal time |
Notice what is not in the list: theories. The file records what was measured, what was said, and what happened. "I think their upstream is oversubscribed" ages badly; "gateway loss 100% for 11 minutes, ticket #4812, they said no trouble found" ages like granite.
A worked entry, annotated
Here is a filled-in entry, of the shape yours should take — plain text, no ceremony:
CIRCUIT: WAN-A  <circuit ID>          ENTRY: 07
START: Tue 08:41 local  (gateway probe alert; last clean probe 08:40)
END:   Tue 08:52 local  (probes recover)        DURATION: 11 min
DETECTED BY: monitoring alert (users called at 08:45)
SYMPTOM: hard down — 100% loss to gateway and both anchors;
         LAN-side probes clean throughout
MEASUREMENTS: graphs exported same morning:
         wan-a_tue_0820-0910_gateway.png, ..._anchors.png
TICKET: #4812, opened 08:44 by phone
THEY SAID: 08:50 "no trouble found"; email Thu: "brief carrier
         maintenance in your area"
RESOLUTION: self-recovered; no dispatch
IMPACT: card terminals offline 11 min; two hosted calls dropped
Read it the way a stranger would. The start time is a measurement, not a guess — the entry says so. The symptom line rules your own network out in one clause, because the LAN-side probes stayed clean. That is the incident-side isolation work, distilled to a sentence. The "they said" line quietly captures a contradiction: no trouble found, followed days later by an admission of maintenance. That means this entry now documents both an outage and an unannounced maintenance event. One entry like this is easy to dismiss. Watch what seven of them become, two sections from now.
Degradations count too
The word "outage" in this guide's title undersells the file. Some of the most valuable entries describe circuits that never went down at all. Examples include forty minutes of 5% packet loss across a midday window and latency that triples every evening and drops back by ten. Other examples are throughput samples that used to brush the ordered rate and now deliver a fraction of it. Users feel these episodes acutely. Calls turn to robot-voice, and shared files take a minute to open. But nobody reboots anything, nobody calls anybody, and without a log entry the episode evaporates completely. Degradations are the purest case for the file, because unlike hard outages they usually generate no ticket and no provider-side record whatsoever. Your entry may be the only evidence anywhere that the event occurred.
Log them with the same anatomy, two fields adapted. The symptom line carries the measured numbers and the window: "loss 4–6% to gateway and anchors, 11:20–12:05." That is because "it was slow" is a mood and a percentage is a fact. And the ticket field is allowed to read "none opened — filed for pattern," which is an honest and perfectly respectable entry. Not every episode is worth a phone call the day it happens. But every measured episode is worth thirty seconds of filing. To keep the file from recording every small wobble, set yourself a logging bar and write it at the top of the file. For example, log any total loss or any loss above a few percent sustained for ten minutes. In this example, also log any latency at multiples of baseline for half an hour. Below the bar, the monitoring history remembers so you don't have to; above it, the file does.
Timestamp discipline
Timestamps are where evidence files most often fail, so the rules are worth stating plainly. Pick one timezone and declare it at the top of the file. Your site's local time is the natural choice, written as "local" plus its offset from UTC (Coordinated Universal Time, the global reference clock). The declaration matters because the provider's systems may stamp tickets in a different zone than their support desk speaks in. And a dispute where one side's "08:41" is another side's "13:41" burns credibility on both. When you quote their timestamps, record them as given and note the zone conversion once. Twice a year, daylight-saving shifts add an hour that occurs twice or not at all. That is one more reason the offset gets written down rather than assumed.
Log the end as carefully as the start. Half the value of the file is duration, and "it came back sometime mid-morning" is not a duration. Your monitoring marks recovery to the minute; use its number, not the moment someone noticed the printers were back. And note the difference between service restored and ticket closed. Providers close tickets on their schedule, sometimes hours after restoration, occasionally before it. Repair-time accounting hangs on which timestamp you can prove. It is worth capturing the detection gap, too: "probes failed at 08:41, first user call 08:45, ticket opened 08:44" is three timestamps telling one tidy story. The start time is measured, not remembered, and you were moving before the complaints arrived. Finally, make sure the monitoring server itself keeps honest time via NTP (the standard network time-sync protocol). A clock drifting by minutes quietly poisons every entry you write.
Exporting graphs before retention eats them
Here is the trap nobody warns you about: monitoring systems eat their own evidence. To keep databases small, nearly every tool rolls up old data — per-minute samples become five-minute averages after some days, then hourly averages after some weeks. Sensible engineering, ruinous for disputes. An 11-minute outage is unmissable in per-minute data and a shallow dent in five-minute averages. By the time the hourly rollup arrives it has been averaged out of existence. The graph you could have shown anyone in week one cannot be reproduced by week eight.
So exporting is part of the incident, not an afterthought. While the event is fresh — same day, same week at worst — export the relevant graphs at full resolution. Those are the gateway probe, the anchor probes, and any interface or error graphs that tell the story. Save an image for humans. Where the tool allows, save the raw data for anyone who wants to check your arithmetic. That means a CSV — a plain spreadsheet-readable text file. Name the files so they sort themselves — circuit, date, window, target — and park them beside the log. Two refinements earn their keep. Export a slightly wider window than the outage. The clean shoulders on either side prove the drop is real, not a graph artifact. And keep one "normal week" export per circuit as a comparison exhibit. If your retention settings allow it, lengthening the fine-grained window — as discussed in the measurement guide — buys you slack for the incidents you did not export in time.
The chronic case: small incidents become a pattern
Now the payoff. A circuit that fails hard for a day gets everyone's attention without any help from you. The dangerous failure mode is the other one. It is a line that drops for eight or twelve minutes at a time, every few days, always recovering before the technician answers. Each event is too small to fight about. First-tier support finds no trouble — by the time they look, there is none. Users adapt, grumbling. And a provider looking at any single ticket is being perfectly reasonable when they shrug: one short blip proves nothing. The chronic problem stays hidden because every constituent incident is dismissible.
Tollgate Foods ran a distribution depot on one business-grade circuit that dropped for about ten minutes every few days. Each drop got a ticket. Each ticket was closed as "no trouble found". After the third closure the depot manager stopped calling. The provider's records interpreted that as the problem going away. Nobody had written any of it down. The depot's admin finally started a file and went back through the monitoring history. She found nineteen drops in eleven weeks, all between seven and nine in the morning. They added up to a month well past its availability allowance. The pattern summary went to the account manager with the three "no trouble found" tickets listed under it. A line card was replaced the following week, and the fault, it turned out, had been findable all along.
The evidence file is the instrument that makes the pattern visible. List the entries together and properties emerge that no single event has. There is a count, a total duration, a clustering in time (the drops that always land in the morning peak), and a trend (getting worse). And — decisive — there is a month whose accumulated minutes exceed what the availability target allows. Individually forgettable events, summed, become a documented service-level miss with ticket numbers riding along as corroboration.
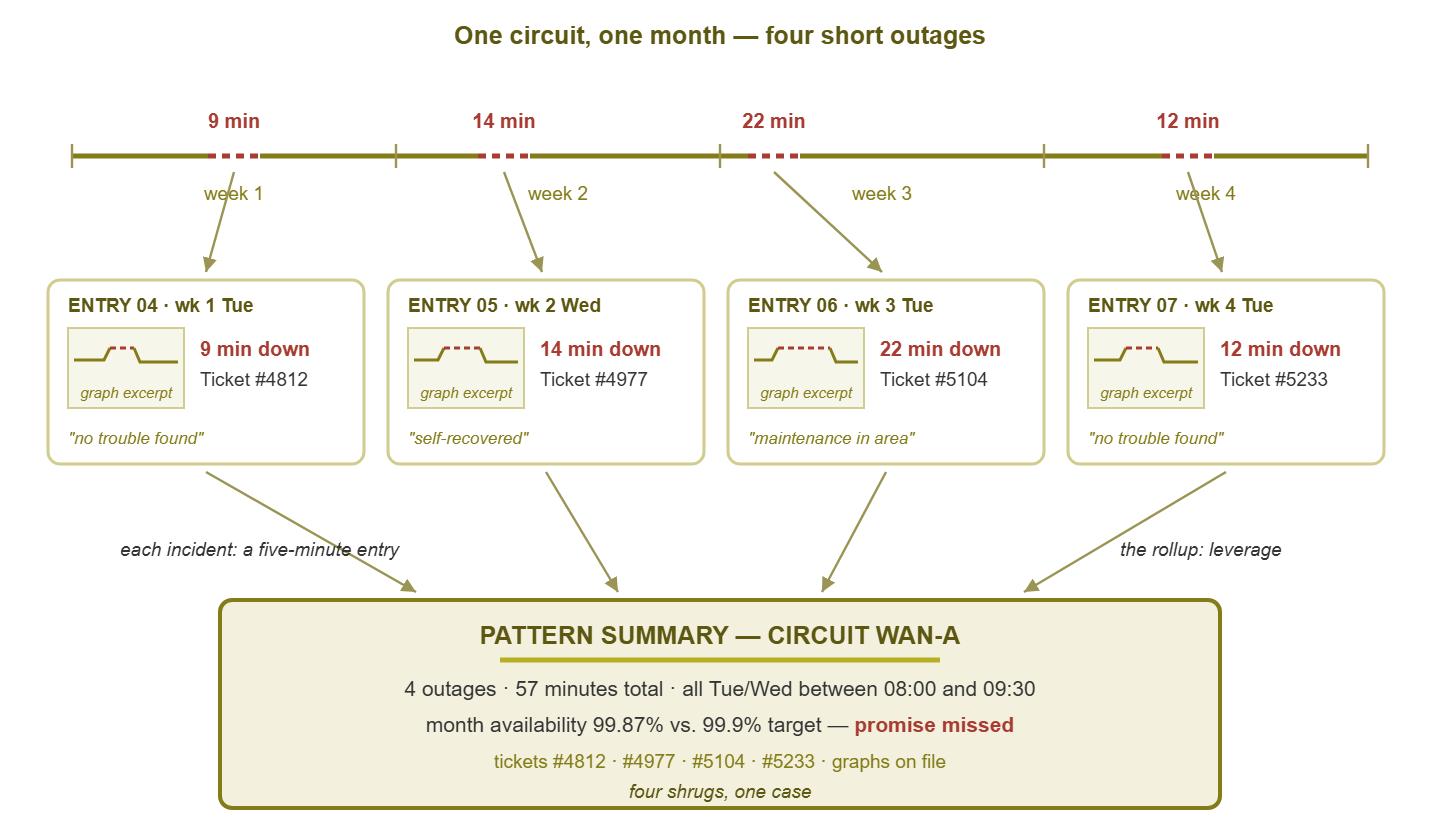
Figure 1: Four dismissible blips become one undeniable pattern. Each outage feeds an entry; the entries roll up into a summary no single ticket could support.
Maintain the rollup as a standing pattern summary at the top of each circuit's file. Include entry count, total minutes, and worst month's availability against the target. Include the time-of-day clustering if any, and the full list of ticket numbers. Update it when you file an entry. The summary is what you paste into an escalation email; the entries beneath it are the footnotes that make it unanswerable. Add correlation notes when you notice them. Drops that follow storms suggest weather-exposed plant. Drops in the evening peak suggest congestion. Drops at the same minute weekly suggest somebody's scheduled job. You are not obliged to explain the pattern — that is the provider's job — but noticing it sharpens the ask.
Using the file: credits, renewals, escalation
The file has three natural audiences. Credit claims, first: service credits are typically claimed within a window, with dates and durations attached. The file means assembling a claim takes minutes instead of an afternoon of forensic email reading. Claim every qualifying miss — less for the money than for the record it creates on the provider's side, as the SLA guide explains. A trail of honored credits is the provider's own signature on your version of events.
Renewals, second. Contract time is when the file converts directly into leverage. A year of monthly rollups plus the pattern summary turns "we have had some problems" into "here is the service history; here is what we need priced and promised differently." The file also arms the quieter decision — whether to add a second provider or change the mix. That is a question the redundancy guide takes up with the same data. Escalation, third: when the chronic pattern demands a campaign — engineering review, intrusive testing, an account-level meeting — the pattern summary is the opening exhibit. The guide escalating with data covers how that campaign is actually run. One file, three doors, all opened by the same five-minute habit.
Tip: file the boring outcomes too. An entry that ends "cause: our own switch rebooted — not the provider" belongs in the log, because a file that only ever blames the provider reads like a grudge. The mixed record is what makes the pattern entries credible: you are demonstrably keeping score, not keeping a vendetta.
Keeping the habit sustainable
Evidence files die of ambition. The version that survives is the one that costs five minutes. It has a template at the top of the document, copied and filled while the incident is fresh. Graphs are exported before closing the laptop. Keep the file wherever your documentation already lives — wiki page, shared document, a folder of text files. The tool is irrelevant; the habit is everything. Give the file one owner per circuit (with a named backup), because a shared duty is a forgotten one. Make the entry part of your incident checklist so it happens on autopilot. And pair it with a monthly ten-minute review where you update the pattern summary and the circuit record's rollup line together.
Resist two temptations. Do not editorialize — the file's power is that it reads like a lab notebook, not a complaint letter. And do not skip "minor" events — the entire chronic-case machinery depends on the minor events being filed. The day you need the file, it will be too late to start it. The entries you almost did not write are usually the ones that carry the argument.
Starting from zero is a twenty-minute job:
- 1. Create one document per circuit, headed by the circuit ID, the declared timezone, and your logging bar.
- 2. Paste the entry template and an empty pattern-summary block at the top.
- 3. Backfill what your monitoring history still holds — and label those entries "reconstructed from graphs." That is because honesty about provenance is part of the file's credibility.
- 4. Add "write the evidence entry + export graphs" as the closing step of your incident checklist.
- 5. Put the monthly ten-minute review on the calendar, paired with the circuit record's rollup.
Where to go next
An evidence file turns outages from anecdotes into assets. Every drop now leaves a residue of timestamps, graphs, and ticket numbers, and the residue compounds. Feed it from continuous measurement and read it against the SLA's actual promises. Spend it on credits, on renewals, and on escalations that finally fix the line. The next time someone asks, pleasantly, for specifics, you will have a page of them. The rest of the program is in Monitoring Your ISP & Holding Them Accountable.
Put this into practice with SysPeep Monitor
The hard part of an evidence file is having measurements worth filing. SysPeep Monitor supplies them. It provides per-minute probes on every circuit and dashboards that show an outage's exact start and end. And it provides graphs and reports you can export while the event is fresh. It runs on one Windows machine, and the free trial takes minutes to set up.
Download Free TrialLearn About SysPeep - All Rights Reserved.