
Uptime Reporting as Reputation Defence
One bad afternoon is remembered. A year of good ones is not. Picture the invoicing system that ran without interruption for eleven months and then stopped for ninety minutes on a Thursday. It will be described, for the rest of the year, as "the invoicing system that went down". And the eleven months will not come up, because nobody has a way to bring them up. They were not written down anywhere the person doing the describing can see.
This guide is about writing them down. You do not hide the Thursday, which would be dishonest and would not work. You put the Thursday next to the eleven months so the reader sees both at once. That is reputation defence: a record that exists before the bad day, so the bad day is judged in context rather than in isolation. It is the cheapest thing in this pillar to maintain and the one that pays off most suddenly.
By the end of this guide you will be able to keep a standing availability record per critical service. You will be able to share it the same way every month so that it is trusted when it matters. You will be able to report a bad month without spin and write the one sentence that gives a bad day its context. You will know what to do when the record is genuinely poor. And you will have a table to copy so you can start the record today.
In this guide
- One bad afternoon
- The standing availability record
- Reputation defence, defined
- Sharing it regularly and boringly
- Showing the bad month honestly
- The context sentence
- When the record is genuinely bad
- The availability record template
- The short meeting at Northgate Retail
- The checklist
- Where to go next
One bad afternoon
Memory keeps the outage and drops the uptime, because an outage is an event and uptime is the absence of one. The invisible work problem describes this asymmetry for the work you do; the same asymmetry applies to the services you run. A service that is up is not doing anything anyone notices. A service that is down is the only thing anyone notices, and for the length of the outage it is the only thing IT is.
The asymmetry has a shape over time. In the week after an outage, the outage is the whole story. A month later it is "that time invoicing went down". A year later it is still the one thing the finance director remembers about the invoicing system. That is because nothing else about the invoicing system has ever been said to her. The eleven good months did not fade; they were never recorded in the first place, so there was nothing to fade.
You cannot fix how memory works. You can only give it something else to hold. A standing record of availability is shared every month whether or not anything happened. By the time the Thursday arrives, the finance director has seen it twelve times. When that Thursday arrives, she reads it in the same table as the eleven months, and the table does the remembering for her.
The standing availability record
The standing availability record is one number per critical service per month, kept for years, in a table that never changes shape. Availability is the percentage of the time a service was working when it was supposed to be, with planned maintenance excluded and the exclusion stated. "Critical" means the handful of services whose failure someone outside IT would notice within the hour. Those are the line-of-business application, email, the internet link, the phone system, and whatever the organisation sells with. Five to eight rows is usual. Twenty is a dashboard, not a record.
The record is built from the monitoring system's availability report, not by hand. Building the uptime evidence file covers how to assemble it. That includes which checks count, how to handle planned windows, and where the evidence for each number lives. This guide does not repeat that. What this guide adds is what the record is for once it exists. It is the thing you show, every month, so that it is already familiar on the month you need it.
Two properties matter more than the numbers. The first is that the record predates the bad day. A record started after the outage is a defence document, and reads like one. A record that has been arriving monthly for a year is simply the record, and the bad month is one more row. The second is that the record is kept for years, not months. The question "has this happened before?" is the question every bad day raises, and a two-year table answers it in one glance.
Reputation defence, defined
Reputation defence is the practice of keeping a factual record of what you run before anything goes wrong. That way, when something does, it is judged against the record rather than against the mood of the room. It is not a defence in the sense of an argument. It is a defence in the sense of a fence. It was built earlier, and it is in the same place it always was. And it does not need you to stand next to it.
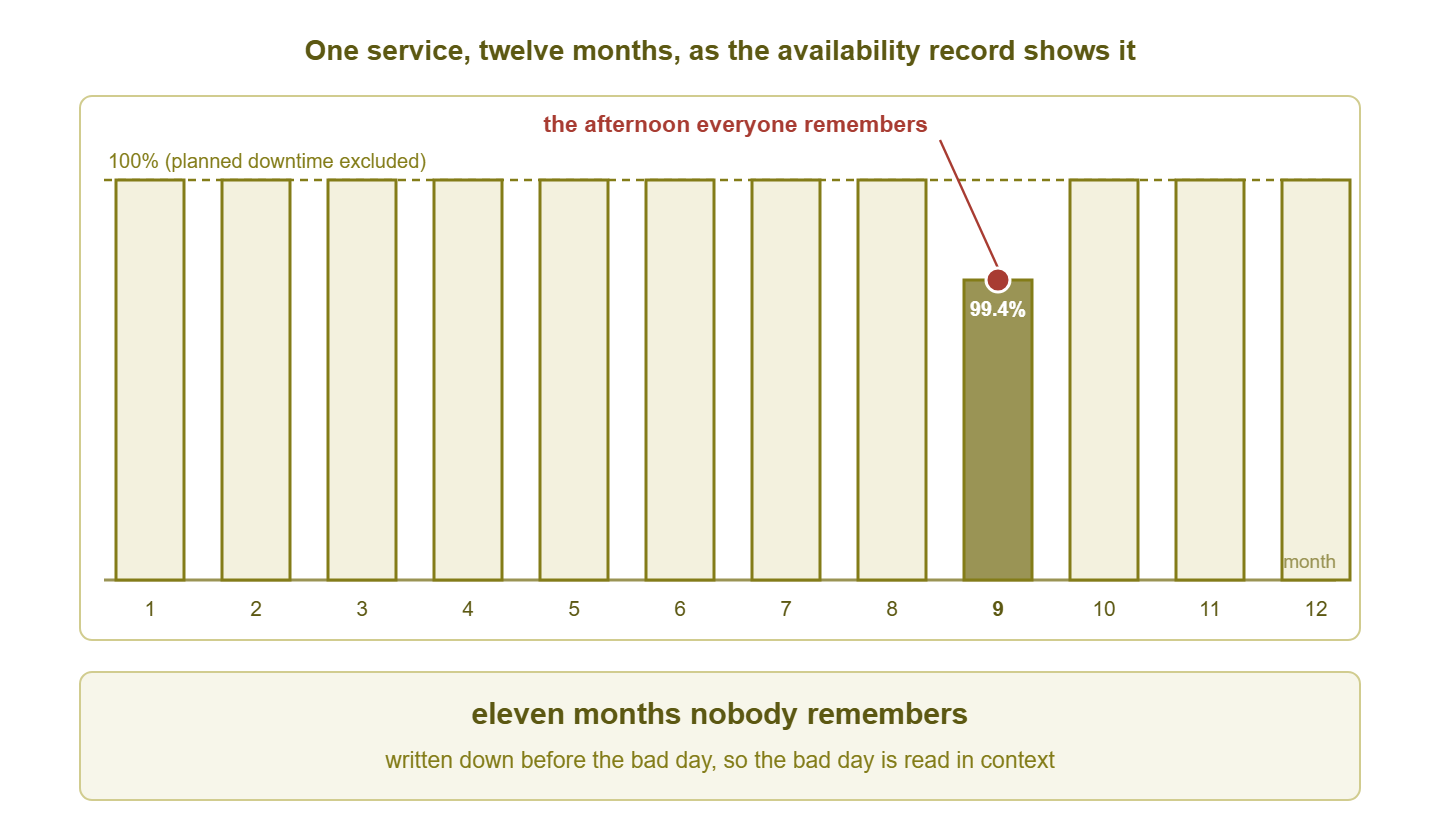
Figure 1: What the availability record shows that memory does not. The short bar is the outage everyone will describe. The eleven tall ones exist only because they were written down each month before the ninth.
The figure is the whole idea. Month nine is real, it was bad, and it is on the chart in a colour that does not pretend otherwise. But it is on the chart with eleven other months, and the reader's eye does the arithmetic before anyone says a word. Without the record there is no chart. There is one bar, and it is the short one.
The defence works only because the record was there first. Suppose the first availability table the finance director ever sees is the one you send the week after the outage. In that case, it is not context; it is an excuse with columns. The same table, seen for the twelfth time, is a fact. This is why the next section matters more than any of the others.
Sharing it regularly and boringly
Send the same table, in the same format, on the same day every month, and do not make it interesting. A record that is trusted when it matters is one the reader has seen so many times that they no longer read it. That is the correct outcome. They have learned its shape. On the month with a short bar, the shape is what tells them something has changed. The eleven months of not reading it are what make the twelfth month credible.
Boring means fixed. The same services, in the same order, with the same columns, and the same footer stating the method. Do not add a service without a note saying so. Do not change the exclusion rule quietly. Do not reformat because a new tool makes prettier tables. Every change to the shape of the record costs a little trust. That is because the reader has to ask whether the numbers still mean what they did. And a defence that has to be re-explained is not a defence.
The table travels inside the quiet month report as its availability line, and on its own to anyone who signs things. Most months it will be the least-read attachment in the organisation. That is the job. (A report nobody reads for a year and everybody reads in one week has done more work than one people read every month.)
Tip: put the method sentence in the footer every single month, even though it never changes. "Availability is measured by the monitoring system's checks every sixty seconds; planned maintenance windows are excluded; the raw data is available on request." On the bad month, that sentence is the first thing a sceptical reader looks for. Finding it already there settles the question before it is asked.
Showing the bad month honestly
The bad month goes in the record exactly as it happened, and the record is only a defence because it does. The temptation, in the week after an outage, is to find a way to make the number less bad. One temptation is to reclassify the afternoon as planned. Another is to measure from when the fix started rather than when the users noticed. Another is to average the outage across all services so it looks like a rounding error. Each of those works once. Then someone checks, and every number the record has ever contained is suspect. SLA reporting without spin lists the ways a number gets bent and why each one is found out. The short version is that the reader remembers the afternoon, so the number had better agree with them.
Honesty here is arithmetic, not confession. The bad month's row says the availability, the number of incidents, the worst one and how long it lasted. It includes a note that says what the worst incident was and what was done. It does not apologise and it does not explain at length. The explanation belongs in the incident report, which reporting incident metrics covers; the record just points to it. A row that says "99.41 per cent; one incident; 4 h 12 min; storage controller failure, see incident note" is complete.
A hidden bad month destroys the defence, because the defence is the reader's belief that the table is the truth. The moment they learn it is the truth minus the inconvenient parts, the eleven good months become claims rather than facts. Claims from the department that just had an outage are worth very little. Show the short bar. It is the price of the eleven tall ones being believed.
The context sentence
The context sentence is one line, written from the record, that places the bad day among the good ones. "This was the first outage of the invoicing system in eleven months." "The last unplanned interruption to email was fourteen months ago and lasted twenty minutes." "This service has been available for 99.96 per cent of working hours over the past two years, including this incident." It goes at the top of the incident summary and in the covering note with the month's table.
The sentence works because it is a fact the reader can check against a document they have already seen. It is not "we usually do better", which is an opinion. It is a number from the table with a date next to it, and the reader has the table. The record can produce the sentence in seconds if it has been kept. The sentence cannot be produced at all if the record has not been kept. That is one more reason to start the table before you need it.
If the monitoring database keeps an outage or downtime table, the gap between incidents for a service is one query away. The shape below is illustrative — names differ by product, and not every database supports window functions, so check the product documentation for yours:
-- Illustrative: adapt table and column names to your monitoring database
SELECT service,
       started_at,
       ROUND(julianday(started_at)
             - julianday(LAG(started_at) OVER (PARTITION BY service
                                               ORDER BY started_at))) AS days_since_previous
FROM outages
WHERE service = 'invoicing'
  AND planned = 0
ORDER BY started_at DESC
LIMIT 5;
The top row is the incident you are writing about; its days_since_previous is the number in the context sentence. Divide by thirty for months and round down. Round down, not up. "Eleven months" that turns out to be ten and a half is the kind of thing a sceptic finds. The sentence is only useful if it survives being found.
When the record is genuinely bad
Sometimes the record does not defend you, because the service has been unreliable and the table says so. Keep the table. A bad record shown honestly is still worth more than no record. That is because it turns "invoicing is always down" into "invoicing had four unplanned interruptions in the last six months totalling nine hours". That is a number you can do something about and a number nobody can inflate in a meeting.
Three moves turn a bad record into a plan. Say so, first and in your own words, before anyone else does: "the availability of this service has not been acceptable". Show the plan next: what is being changed, when, and what the record should look like afterwards. Then show the trend as the months come in, on the same table. That makes the improvement visible in the same place the problem was. A record that shows a bad service getting better is more persuasive than a record that was always good, because the reader can see the work.
What you must not do is stop sending the table. A monthly record that goes quiet during a bad period tells the reader exactly what they would have guessed. The return of the table when things improve reads as spin even when it is not. The table arrives on the same day whether the month was good, bad, or the one with the ninety-minute Thursday in it.
The availability record template
Copy this table into a spreadsheet, one row per service per month, and add a row each month for as long as the service exists. The numbers below are an illustrative year for one fictional service.
| Service | Month | Availability | Incidents | Worst incident | Note |
|---|---|---|---|---|---|
| Invoicing | 1 | 100.00% | 0 | — | — |
| Invoicing | 2 | 100.00% | 0 | — | Planned window 2 h, excluded |
| Invoicing | 3 | 99.98% | 1 | 9 min | Database restart; see note |
| Invoicing | 4 | 100.00% | 0 | — | — |
| Invoicing | 5 | 100.00% | 0 | — | — |
| Invoicing | 6 | 100.00% | 0 | — | Planned window 3 h, excluded |
| Invoicing | 7 | 100.00% | 0 | — | — |
| Invoicing | 8 | 100.00% | 0 | — | — |
| Invoicing | 9 | 99.41% | 1 | 4 h 12 min | Storage controller failure; incident note 14 |
| Invoicing | 10 | 100.00% | 0 | — | Controller replaced under warranty |
| Invoicing | 11 | 100.00% | 0 | — | — |
| Invoicing | 12 | 100.00% | 0 | — | — |
Rules for the columns. Availability comes from the monitoring system's availability report, planned windows excluded, to two decimal places. Incidents counts unplanned interruptions the users could have noticed, not alerts. Worst incident is the duration of the longest one, as the users experienced it, from first failed check to first passing check. Note is one line: what it was and where the detail lives, or the planned window that was excluded. An empty note is fine. A long note is the incident report trying to get into the table, and it should be sent back.
Keep one sheet per service, or one sheet with a service column and a filter. Never delete a row. Never edit a past row without a note in the note column saying what changed and why. And never average across services. Honest availability math explains why an average of five services is a number about nothing; the record is per service or it is decoration.
The short meeting at Northgate Retail
At Northgate Retail the point-of-sale back end failed for two hours on the busiest Saturday of the quarter. The following Tuesday's meeting had been booked for ninety minutes with the commercial director, the finance director, and a title slide reading "POS reliability". The IT manager opened with one sheet: eighteen months of the point-of-sale availability record. That Saturday's row was at the bottom in the same font as the rest. One sentence above it noted that this was the first unplanned interruption to the service in sixteen months. The commercial director read the sheet and asked what had failed and whether it could fail again. The director got a two-line answer and a date for the replacement, and closed the meeting at eleven minutes past. The slide deck was not opened. The finance director asked to be sent the sheet every month, which she already was, and had been for a year and a half.
The record did not make the Saturday smaller. It made the Saturday one row, in a table the room had already agreed was true. And the room's anger had nowhere to go but the actual question, which was "will this happen again?". That is what reputation defence is for. It does not win the argument; it removes the argument, so that the meeting can be about the fix.
The checklist
Run through this once a month, when the table goes out.
- Every critical service has a row for every month since the record began, with no gaps.
- Each availability figure comes from the monitoring system's availability report, not from a hand calculation.
- Planned windows are excluded, and the exclusion is stated in the footer every month.
- The incident count is unplanned interruptions users could have noticed, not alerts raised.
- Every month with an incident has a duration and a one-line note pointing to the detail.
- No past row has been changed without a note saying what changed and why.
- No number is an average across services.
- The table has the same services, in the same order, with the same columns as last month, or the change is noted.
- The table was sent on the same day as last month, regardless of what the month contained.
- You can write the context sentence for any critical service from the table in under a minute.
Where to go next
One bad afternoon is remembered and a year of good ones is not, unless the year was written down first. The standing availability record is the writing down: one number per service per month, from the monitoring system, planned downtime excluded. It is sent the same boring way every month for years. On the bad day it is already in the reader's hands. The short bar sits beside eleven tall ones, and the context sentence turns a furious meeting into a short one. Show the bad month exactly as it was; the eleven good months are only believed because you do.
The record is one of the sources for answering "what do we pay you for?", where it supplies the first of three sentences. Counting the outages you prevented is the companion record for the outages that never made it into this table. Both are part of Making Invisible Work Visible With Monitoring Data.
Put this into practice with SysPeep Monitor
A standing availability record is only as boring to produce as the report behind it. SysPeep Monitor generates availability reports per service from its check history and can deliver them on a schedule, alongside alert history. It does so from one web console fed by a central Windows service and optional remote probes. The free trial installs on a Windows machine if you want to start the record for your own critical services this month.
Download Free TrialLearn About SysPeep - All Rights Reserved.