
APIs and Webhooks in Plain Language
Somewhere in your monitoring system's settings there is a page you have probably never clicked. It is called "API," or "Integrations," or "Webhooks," and it looks like it was written for developers. It was not. It was written for anyone who has ever thought "I wish I could get this device list into a spreadsheet without retyping it." It was also written for anyone who has thought "I wish the monitor would tell the ticketing system directly instead of telling me."
This guide explains what an API is, what a webhook is, and how the two differ. It uses no term that is not defined on the spot. By the end you will be able to read your product's API documentation without your eyes glazing over. You will be able to understand what "a GET request with a bearer token" means. And you will be able to decide whether you want to pull data out on a schedule or have the monitor push events to you the moment they happen. You will not build a full integration today. You will, however, stop being intimidated by one.
In this guide
- An API is a front desk for programs
- REST basics: URLs are things, methods are verbs
- JSON: the envelope everything travels in
- Status codes: the receptionist's face
- Authentication: the token is a password
- Pull versus push: polling and webhooks
- What monitoring systems typically expose
- A glossary you can keep
- Where to go next
An API is a front desk for programs
Picture a hotel front desk. You ask a question in a form the receptionist expects: "Is room 214 free tonight?" You get an answer in a form you expect: "Yes," or "No, but 216 is." You do not walk behind the desk and rummage through the booking ledger yourself. The desk is the agreed place where outsiders ask things and get things done, and the ledger stays out of reach.
An API (Application Programming Interface) is exactly that desk, built for software instead of people. Your monitoring system already has a front desk for humans: the web console, with its buttons, colours, and menus. The API is the same desk with the buttons removed and replaced by a strict rule. Ask in this fixed format, and you will be answered in this fixed format. A script, a scheduled task, or another product can walk up to that desk, ask a question, and get a machine-readable reply. Requests include "list every device," "which alerts are open right now," or "mark alert 981 as acknowledged."
The fixed format is the whole point. Humans cope with ambiguity; a receptionist understands "any rooms tonight?" and "got a bed?" as the same question. Programs do not. The API defines precisely how to phrase each request and how each answer is laid out, so a script written once keeps working. That strictness is what makes automation possible. Anything you can do by clicking in the console, you can usually do by asking the API. A script never gets bored, never mistypes an address, and is happy to run at three in the morning.
REST basics: URLs are things, methods are verbs
Most monitoring APIs follow a style called REST. The letters stand for Representational State Transfer, which you may immediately forget. What matters is that REST APIs work over ordinary HTTP, the same protocol your browser uses, and they follow three simple ideas.
Every thing has an address
In a REST API, the URL names a thing, and the things are nouns: devices, alerts, users, maintenance windows. A collection has one address; an individual item in the collection has a longer one. Against an invented monitoring server, the addresses might look like this:
https://monitor.example.local/api/devices        # the list of all devices
https://monitor.example.local/api/devices/42     # one device, the one with id 42
https://monitor.example.local/api/alerts         # the list of alerts
https://monitor.example.local/api/alerts/981     # one alert
Each of those addresses is called an endpoint. The product documentation is essentially a list of endpoints and what each accepts and returns. Real products vary in the exact paths (the ones above are placeholders), but the collection-then-item pattern is nearly universal.
The method is the verb
Every HTTP request carries a method, a single word that says what you want to do to the thing at that address. Four of them do almost all the work:
| Method | Plain meaning | Example | Changes anything? |
|---|---|---|---|
GET | Read it | GET /api/devices/42 — show me device 42 | No |
POST | Create it (add to the collection) | POST /api/maintenance — create a maintenance window | Yes |
PUT / PATCH | Update it (replace all of it / change some fields) | PATCH /api/alerts/981 — set acknowledged to true | Yes |
DELETE | Delete it | DELETE /api/devices/42 — remove device 42 | Yes, permanently |
The same address means different things with different verbs: GET /api/devices lists devices; POST /api/devices adds one. Notice too that only GET is harmless. A script that only reads can be given a read-only credential, a theme we will return to.
Filters and headers refine the question
Two more pieces complete a request. Query parameters are filters tacked onto the URL after a question mark, like boxes ticked on a form at the desk. For example, /api/alerts?state=open&severity=critical asks only for open critical alerts. Headers are notes on the outside of the envelope rather than in the letter. They say who you are (Authorization), what format you are sending (Content-Type), and what format you want back (Accept). Put together, a complete request for the command-line tool curl looks like this:
curl -s "https://monitor.example.local/api/alerts?state=open" \
     -H "Authorization: Bearer <TOKEN>" \
     -H "Accept: application/json"
Read it as: quietly (-s) fetch the open alerts, presenting this token as identification, and please reply in JSON. Which brings us to JSON.
JSON: the envelope everything travels in
JSON (JavaScript Object Notation) is the text format almost every modern API uses for both questions and answers. Despite the name it has nothing to do with needing JavaScript. It is just a tidy way of writing structured data that both humans and programs can read. The rules fit on an index card:
- Curly braces hold an object: a set of named fields, written as
"name": valuepairs separated by commas. - Square brackets hold a list of values, in order.
- Text is wrapped in double quotes. Numbers are bare. The words
true,false, andnullare special and unquoted. - Objects and lists can nest inside each other as deep as needed.
Here is what one device might look like when a monitoring API answers GET /api/devices/42:
{
  "id": 42,
  "name": "sw-core-01",
  "address": "192.168.1.2",
  "type": "switch",
  "status": "up",
  "tags": ["core", "building-a"],
  "interfaces": 26,
  "last_check": "<timestamp>",
  "location": null
}
Walk through it line by line. "id": 42 is a number, the device's permanent identifier inside the monitoring system, and what you use in URLs. "name", "address", and "type" are text, so they are quoted. "status": "up" is also text. The documentation will tell you it can only ever be one of a few words. Those are what your script will test against. "tags" is a list of two text values. "interfaces": 26 is a count. "last_check" would carry a timestamp in a standard date format. And "location": null means "nobody filled this in," which is different from an empty string and different from zero. Scripts that forget this crash on exactly this line.
A list of devices is simply several of those objects inside square brackets: [ {...}, {...}, {...} ]. Many APIs wrap the list in an outer object carrying bookkeeping such as a total count and a pointer to the next page. The guide on pulling data out covers that pagination in practice. When JSON arrives as one long line, any pretty-printer, or PowerShell's ConvertFrom-Json, unfolds it into the readable shape above.
Status codes: the receptionist's face
Before you read the reply, look at the receptionist's expression. Every HTTP response begins with a three-digit status code that tells you, at a glance, how the request went. The rule of thumb has three parts. Codes starting with 2 mean "done". Codes starting with 4 mean "you asked wrong". Codes starting with 5 mean "something is broken on our side." The handful you will actually meet:
| Code | Name | What the desk is telling you |
|---|---|---|
| 200 | OK | Here is what you asked for. |
| 201 | Created | Your POST worked; the new thing exists now (its details are often in the reply). |
| 400 | Bad Request | Your question was malformed: broken JSON, a missing field, a value of the wrong type. |
| 401 | Unauthorized | Who are you? The token is missing, expired, or wrong. |
| 403 | Forbidden | I know who you are, and you are not allowed to do that. |
| 404 | Not Found | No such thing at that address. Check the id and the path. |
| 429 | Too Many Requests | Slow down; you have hit the rate limit. |
| 500 | Internal Server Error | Something broke inside the monitoring system while handling your request. |
| 502 / 503 | Bad Gateway / Unavailable | The service is down, restarting, or overloaded. Try again later. |
Two habits make status codes useful. Always check the code before reading the body. A script that assumes every answer is a device list falls over the first time it receives a 503 error page. And when the code is in the 400s, read the body anyway: most APIs include a short JSON message explaining what was wrong.
Authentication: the token is a password
The front desk needs to know who is asking, both to refuse strangers and to decide what each visitor is allowed to do. APIs handle this with authentication. The most common form for monitoring products is a token: a long random string the system generates for you. You present it in the Authorization header on every request. The word Bearer in front of it simply means "whoever bears this string is trusted as its owner." That should tell you everything about how carefully to handle it.
You may also meet basic authentication, where a username and password travel in a header (safe only over HTTPS). You may also meet OAuth-style flows, where you exchange a client credential for a short-lived token. These are more common with cloud services than an on-premises monitor. Whatever the mechanism, the same rules apply:
- A token is a password. It goes where your other passwords go: a password manager, a secrets store, or a protected credential file. Never in a script on a shared drive, a chat message, a screenshot, or a ticket.
- Least privilege. If the product offers read-only tokens, use them for anything that only reads. A report script has no business holding a credential that can delete devices.
- One token per job. Name each token after the script that uses it, so when something misbehaves you know which door to close.
- HTTPS always. The token travels in every request; without TLS, anyone on the path can read it. If the monitor's certificate is self-signed, fix that properly rather than teaching your scripts to ignore certificate errors.
Tip: the first thing to do with a new token is prove it works with the most harmless request the API offers. One example is GET /api/devices?limit=1. A 200 means token and URL are right. A 401 means the token is wrong. A 403 means it is right but under-privileged. Sorting that out before writing real code saves an hour of confusion.
That is enough to be safe on day one. The full treatment, including rotation, logging, and what to do when a token leaks, is in API security and hygiene.
Pull versus push: polling and webhooks
Everything so far has been you asking the desk. There is a second way to get information, and it is the difference between an API and a webhook.
Pull means your script asks, on a schedule. This is called polling. It is like phoning the front desk every five minutes to ask whether your parcel has arrived. It is simple, entirely under your control, and mostly answered with "no, nothing new." The cost is delay (a parcel arriving just after your call waits for the next one) and wasted calls.
Push means the monitoring system calls you. You give it a URL that belongs to you. When something happens, the monitor makes an HTTP request to that URL. Events include an alert opening, an alert clearing, or a device being added. The request is usually a POST carrying a JSON description of the event. That is a webhook: a reverse phone call. The desk takes your number and rings you the moment the parcel arrives. The name is not mysterious: "hook" as in a place to hang your own code, "web" because it happens over HTTP.
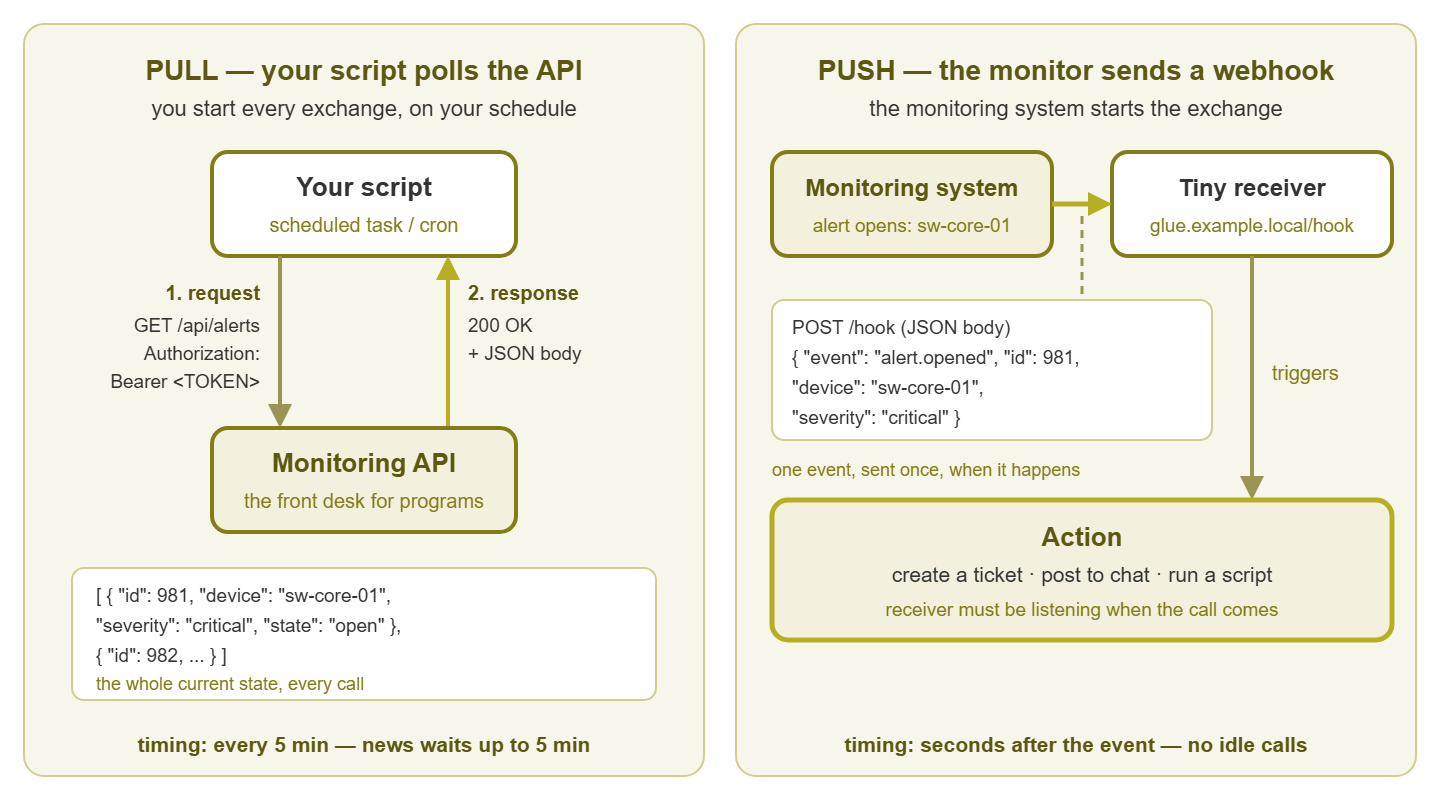
Figure 1: Pull versus push. On the left your script initiates every exchange on your schedule. On the right the monitoring system initiates the exchange the moment an event happens. A small receiver of yours turns it into an action.
Push is near-instant and wastes nothing, but it moves work onto you. Something of yours has to be listening at that URL, reachable from the monitor, and running when the call comes. If your receiver is down at the wrong moment the event may be lost, because not every product retries. Pull is slower and chattier, but needs nothing listening and nothing exposed. With pull, if a run is missed the next one simply sees everything that happened in between. Neither is better; they suit different jobs.
| Pull (polling an API) | Push (a webhook) | |
|---|---|---|
| Who starts the conversation | Your script | The monitoring system |
| Timing | On your schedule; delay of up to one interval | Immediately when the event happens |
| What you must run | A scheduled task or cron job | A receiver listening on a URL, always on |
| Network exposure | Outbound only, from you to the monitor | Inbound; the monitor must reach your receiver |
| What you get | Whole state: every device, every open alert | One event at a time: this alert just opened |
| If something is down | The next run catches up | The event may be lost unless the sender retries |
| Good for | Inventory sync, reports, dashboards, periodic checks | Ticket creation, chat notices, triggering a script |
Concretely: a spreadsheet of every device refreshed nightly is pull, one scheduled script and one GET. A ticket opened the moment a core switch goes down is push, a webhook to a tiny receiver that creates the ticket. Many real integrations use both: a webhook to react quickly, plus a periodic pull to catch anything the webhook missed.
What monitoring systems typically expose
Products differ enormously here, so treat this as a map of what to look for rather than a promise. When a monitoring system has an API, the endpoints usually cluster around a familiar set of things:
- Devices and inventory. List devices, read one device's details, list its interfaces or sensors, see groups and tags. Sometimes create and delete devices, which lets an inventory tool drive monitoring rather than the other way round.
- Alert state. List open alerts, filter by severity or device, and read alert history. Often you can also acknowledge an alert. That marks it as "a human is on this." Acknowledgement through an API is what lets a ticketing system talk back to the monitor.
- Metrics. Current values and sometimes history for a time range. History endpoints return large answers, and products often cap how much you may ask for at once.
- Maintenance windows. Create, list, and end them. This is gold for change automation. A deployment script that opens a window before it starts and closes it afterwards eliminates a whole category of false alerts.
- Outbound webhooks. Where you register your URL, choose which events trigger a call, and sometimes shape the payload.
Some products expose none of the above, or only a slice. That is not the end of the road. Every monitoring system sends email and most produce scheduled reports. Those are an integration surface too, as the guide on gluing systems together shows with the email-to-script pattern. Before you plan anything, find the documentation page titled API, REST, Integrations, or Webhooks and read what your product actually offers. That is the only source of truth on endpoints and payloads.
A glossary you can keep
These are the words you will meet in any API documentation. Once they stop being noise, the documentation stops being scary.
| Term | Plain meaning |
|---|---|
| API | The front desk a program puts up so other programs can ask it questions and give it instructions in a fixed format. |
| Endpoint | One address on that desk, such as /api/devices. Each endpoint handles one kind of thing. |
| REST | The common style where URLs name things and HTTP methods say what to do with them. |
| Query parameter | A filter added after ? in the URL, such as ?state=open. |
| Header | A note on the outside of the request or reply: identity, content type, rate-limit hints. |
| JSON | The text format for structured data: objects in braces, lists in brackets, quoted text, bare numbers. |
| Status code | The three-digit result: 2xx done, 4xx you asked wrong, 5xx broken on their side. |
| Token / API key | A long random string that identifies and authorizes your script. Treat as a password. |
| Bearer | The style of token where possession alone grants access; sent as Authorization: Bearer <TOKEN>. |
| Rate limit | The maximum number of requests the desk will serve in a period; exceed it and you get a 429. |
| Pagination | Delivering a long list in pages; each reply tells you how to ask for the next page. |
| Webhook | Push: the system calls a URL of yours when an event happens; polling is the pull equivalent. |
| Receiver / listener | The small web service you run to accept webhook calls. |
| Idempotent | Safe to repeat: doing it twice has the same effect as once. GET is; POST usually is not. |
Where to go next
You now have the mental model every integration is built on. An API is a front desk with strict manners. URLs name things, and methods say what to do with them. JSON carries the details, and a status code tells you how it went. A token proves who you are and deserves the care of a password. Pull means you ask on a schedule; push means the monitor calls you through a webhook the moment something happens. Everything else is detail that lives in your product's documentation, which you can now read.
From here the natural next steps are practical. Pulling data out turns the GET requests above into working scripts for inventory sync, reports, and dashboards. Pushing events in goes the other direction, feeding backup results and deployment events into the monitor. Gluing systems together shows the small, honest patterns that connect a monitor to tickets, chat, and remediation without an integration pack. And API security and hygiene keeps the whole thing from becoming a liability. The pillar page for Monitoring APIs and Webhooks collects them all.
Put this into practice with SysPeep Monitor
If you are shopping for a monitor to build on, look at what it exposes before you look at anything else. SysPeep Monitor's integration surface is the practical set: email and other notifications on every alert, scheduled reports, and live dashboards. It also includes the device data it collects over SNMP, WMI, and SSH from one Windows machine. Check the product documentation for what else is exposed. The free trial is the quickest way to see what you would have to work with.
Download Free TrialLearn About SysPeep - All Rights Reserved.