
Where the Monitoring Server Should Live
Most monitoring servers live wherever there happened to be space on the day they were installed. That might be a leftover VM slot, a corner of the busiest cluster, or the old desktop under someone's bench. It feels like a small decision, because on day one the software runs fine anywhere. Then a real outage arrives, and the placement quietly decides everything. It decides what the monitor could see, whether it went down with the very thing it was watching, and whether anyone got an alert at all.
The monitor's home determines three things. What it can see: network position sets which devices it can reach and poll. What can take it down: every piece of infrastructure it depends on is now a way to lose your eyes. And it determines whether the monitor survives the disasters it exists to report. A monitoring server that dies in the same instant as the systems it watches is a smoke detector wired to the building's own fuse.
This guide walks the placement decision dimension by dimension — network position, failure domains, VM versus physical, sizing, and base hygiene. Then it puts them together in a dependency audit you can run in twenty minutes and a worked example for a realistic small shop. None of it requires money you do not have; most of it requires only choosing on purpose.
In this guide
- Network position: a seat that sees everything
- Failure domains: keep the doctor off the patient's ward
- VM or physical?
- Sizing: what actually drives the load
- A boring base: rules for the monitor's own house
- The dependency audit
- A worked example: the 150-person shop
- The placement checklist
Network position: a seat that sees everything
A monitoring server watches mostly by polling — reaching out to devices and asking questions over ICMP, SNMP, WMI, and SSH. That only works if the network lets it reach every device it is responsible for. So the first placement question is pure plumbing: from this address, can the monitor get to all of its targets, and can the targets get back? Concretely, that means:
- A route to every monitored subnet — server VLANs, user VLANs, the DMZ if you watch it, remote sites, the management network. (A VLAN is a virtual LAN: a logically separate network segment sharing physical switches.)
- Firewall rules that allow the monitoring protocols from the monitor's address to each segment — and that someone has written down.
- A return path for pushed data: SNMP traps, syslog messages, and agent check-ins all travel from devices to the monitor and need their own rules.
- Working DNS resolution and time sync, because checks reference names and every reading gets a timestamp.
That checklist already rules out the most common accidental placement: a corner of a user VLAN. User segments are the most filtered, most churned, least privileged place on the network — the exact opposite of what a central vantage point needs. (Measuring from where users sit is genuinely valuable. But that is a job for a small remote probe, not for the central server. The central server's job is reach and stability.) The natural home is the server or data-center segment. There it is close to the machines it polls hardest, behind stable addressing, with deliberate rules out to everything else.
Shops with a dedicated management network usually give the monitor a leg in it. That network is a separate segment where device management interfaces live. It is where the SNMP and SSH doors are. Here is the tradeoff to know. The management network is deliberately isolated, so a monitor that lives only there measures a path no user traffic takes. Give it management reach and keep at least one check on the user-facing path. The design of that management segment — what belongs in it and who may enter — is its own topic, covered in the management path guide.
Failure domains: keep the doctor off the patient's ward
A failure domain is a set of things that fail together. Examples are everything on one physical host, everything on one storage array, or everything on one power circuit. Other examples are everything behind one switch or everything in one building. The prime placement rule is one sentence: do not host the doctor on the patient. Put the monitoring server in a different failure domain than the systems whose failure it exists to report.
The classic violation is so common it deserves its own retelling. The monitor runs as a VM on the main hypervisor cluster — convenient, free, instantly approved. The cluster's shared storage has a bad day. Every VM freezes, including the monitor. Result: the biggest outage of the year produces zero alerts, because the one system whose job was to shout went silent in the same instant. You find out from a user, by phone, like it's the old days. The post-incident report contains the saddest sentence in monitoring: "monitoring was affected by the outage."
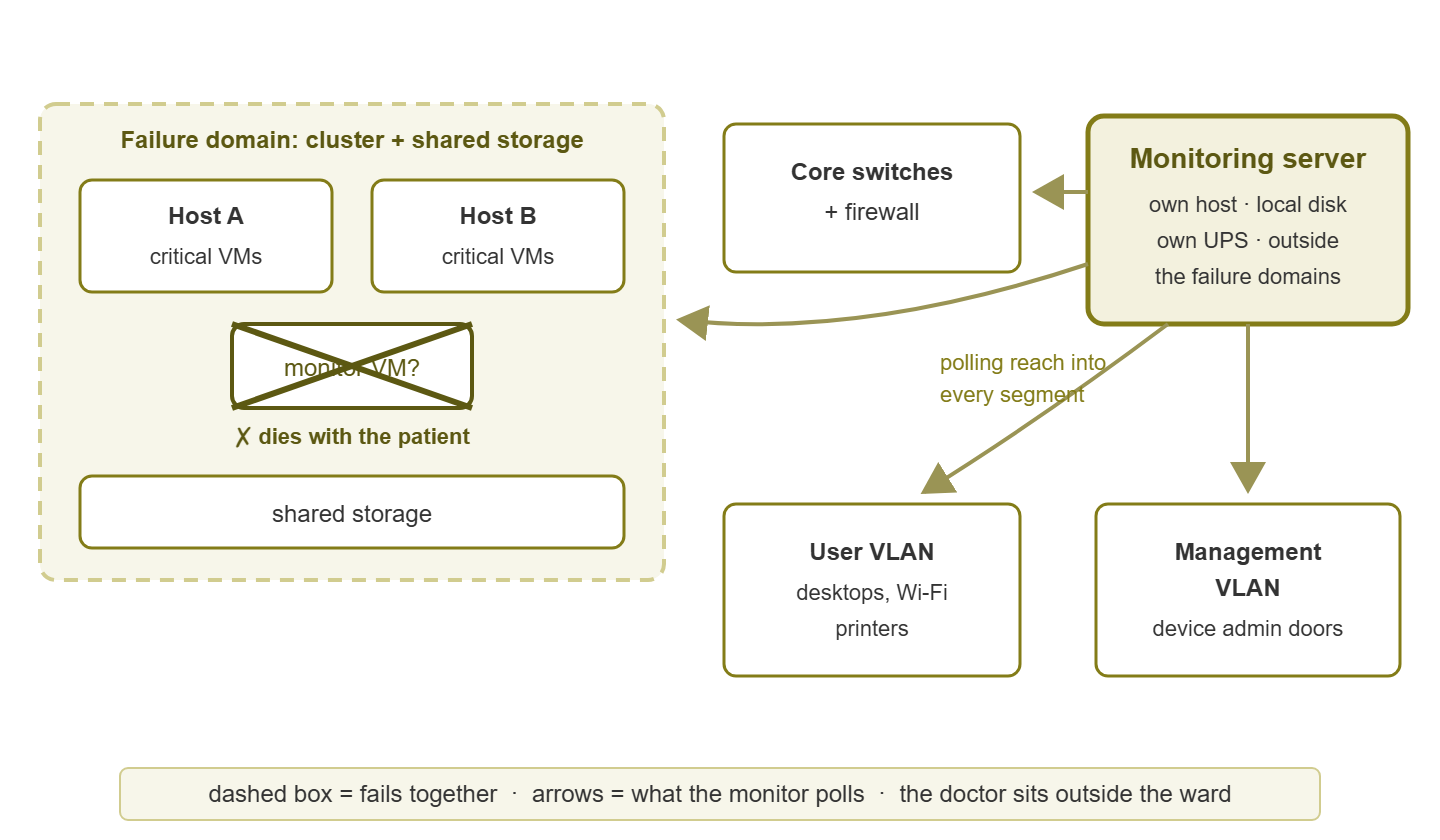
Figure 1: The monitor lives outside the failure domains it watches, with reach into all of them. The crossed-out placement — a VM inside the cluster it monitors — dies with the patient.
Perfect separation is a luxury; useful separation is cheap. Work down this ladder and take every rung you can afford, in order of impact:
- Separate host. The monitor does not run on a machine it monitors, and ideally not on the cluster that hosts your critical VMs. This is the rung that matters most.
- Separate storage. Local disk in its own host rather than the same SAN or storage cluster everything else uses. A storage outage is the exact scenario you want reported from outside.
- Separate power. Its own small UPS, or at least a different circuit than the rack it watches. Costs little; pays off precisely during power events.
- Separate switch or uplink where the cabling allows, so one line card failure cannot blind you and break things at the same time.
- Separate room or site — the luxury rung. Most small shops get this later through remote probes or a high-availability pair rather than by moving the server.
Here is the honest small-shop compromise. Suppose literally everything you own is one cluster on one SAN. In that case, consider a modest standalone box — even a humble one — running the monitor with local disk and its own UPS. Architecturally, it is worth more than a generously specced VM inside the blast radius. Whatever you choose, write down what still takes the monitor out. Knowing your blind spot is half of covering it.
VM or physical?
Virtual machines are the default home for good reasons. Snapshots before upgrades turn risky maintenance into a five-minute rollback. Live migration moves the monitor off a failing host without downtime. Adding memory or disk is a form field instead of a purchase order. If your virtualization spans more than one failure domain — two clusters, or independent hosts with local storage — a VM placed thoughtfully gives you both convenience and separation.
The caution is the circular dependency: a monitor that runs inside the virtualization platform it monitors depends on the patient for its own heartbeat. When the platform itself has the bad day — shared storage, the management layer, a cluster-wide misconfiguration — the observer disappears with the observed. That is precisely the class of outage where you most need an outside voice.
So the choice is less "VM versus physical" than "inside versus outside the blast radius." There are three defensible answers, in increasing order of independence. One is a VM pinned to a specific independent host (affinity rules keep it there) using that host's local disk. That way, cluster-wide storage trouble cannot touch it. Another is a VM in your second cluster, if you have two, so each can watch the other. The third is a deliberately independent small physical box — a compact server or well-built mini machine with mirrored disks. Its whole job is to be the outside observer. The physical box earns its keep exactly when everything else you own shares one fate.
Tip: whichever platform you pick, resist the urge to make the monitor "highly available" by tying it into more shared infrastructure. Availability that depends on the patient is not availability. If you need the monitor to survive more failures, prefer mechanisms designed for it over deeper entanglement. Those mechanisms are an independent second instance or a proper high-availability pair.
Sizing: what actually drives the load
New admins tend to oversize the CPU and undersize the disk, because they imagine monitoring as computation. It is not; it is bookkeeping. Four things drive a monitoring server's load, roughly in this order:
- Check volume: the number of checks times their frequency. Two thousand checks every sixty seconds is about thirty-three questions per second — light work for a few modern cores.
- Database writes: nearly every answer becomes a row in the monitoring database. This constant drizzle of small writes is the real workload, and it rewards fast disk far more than fast CPU.
- Retention: how long you keep history decides disk space. This is the number that grows forever if unmanaged.
- Readers: dashboards, maps, and reports scanning weeks of history add bursts of read load — noticeable, rarely dominant at small scale.
Think in capability terms rather than brand specs. Take a small estate — say, up to a few hundred devices at ordinary polling intervals. A machine with a few CPU cores, a modest allocation of RAM, and solid-state storage is comfortably enough for it. The same box will usually grow to the next size band without drama. Disk is the variable to actually compute: polls per day times bytes per reading times retention days. That sum quietly reaches tens of gigabytes and keeps going. The retention arithmetic — and the art of keeping old data coarser than new data — is covered in depth in Polling and Granularity.
Two sizing rules of thumb serve better than any spec sheet. First, leave headroom for double. Monitoring estates grow by discovery, and every guide that tells you to monitor more (including this library) is load on this box. Second, make the monitor watch its own resources from day one — its CPU, memory, and above all its database volume's free space. It is the one machine whose exhaustion nothing else will report.
A boring base: rules for the monitor's own house
The monitoring server is infrastructure now — the same tier as your domain controller, not the same tier as a test box. That promotion comes with house rules, all of them dull, all of them earned by someone's bad week:
- Dedicated duty. No double life as a file server, print server, or "it also runs that one script." Shared duties bring shared reboots, shared load spikes, and shared compromise.
- A boring, patched OS. Current, supported, updated on a schedule. Monitoring servers rot precisely because they work — "don't touch it" becomes "three years unpatched." Give it a declared maintenance window like any other production system.
- Time sync, non-negotiable. Every alert, graph point, and log line carries a timestamp. And you will one day lay those timestamps against firewall logs and server events to reconstruct an incident. A monitor whose clock drifts writes fiction.
- Its own backups. The configuration (every check, threshold, and notification rule you ever tuned) and the history database. Losing them means rebuilding your monitoring memory from scratch. The full discipline of protecting the protector lives in Monitoring the Monitor.
The dependency audit
Here is the twenty-minute exercise that turns placement from a feeling into a design. Take a blank page and list everything that must be working for the monitoring server to do its job. Be ruthless; the list is always longer than expected. A typical list starts with the power circuit and UPS, the physical host and (if virtual) the hypervisor and its storage. It includes the switch and uplink the monitor hangs off, and the routing and firewall path to each monitored segment. It also includes DNS, the directory service admins use to log in, and the database, if it lives elsewhere. Finally, it includes time sync and the email path that carries alerts out.
Now walk the list twice. Pass one: for each entry, ask "does the monitor die or go mute when this dies?" Every yes is a scenario where you get no alert for exactly the failure you would most want reported. Pass two: ask "can I shrink this dependency cheaply?" Often you can:
- DNS: define the monitor's most critical checks — core switch, firewall, DNS servers themselves — by IP address. That way, name resolution failing cannot blind the checks that would report it.
- Directory authentication: if admins sign into the monitor with domain accounts, keep one documented local break-glass account. Otherwise the AD outage locks you out of the very console showing you the AD outage.
- Alert delivery: if alerts leave via the mail server the monitor also watches, that mail server's death arrives silently. At minimum know the coupling; better, add a second notification path that does not share it.
- Storage and power: already handled if you took the failure-domain ladder seriously.
What remains on the list after shrinking is your accepted risk. Write it at the top of the monitoring runbook: "this system goes blind if X." Future-you, mid-incident, will be glad the sentence exists.
A worked example: the 150-person shop
Theory earns its keep on a concrete case. Picture a 150-person company in one building. It has a two-host hypervisor cluster on shared storage running about twenty VMs, a firewall pair, and a dozen switches. It also has wireless, printers, and UPS units — call it 120 monitored devices. Where does the monitor go?
Network position: the monitor lives in the server segment. Firewall rules allow SNMP, WMI, SSH, and ping out to the management, user, and DMZ segments, and traps and syslog back in. DNS and NTP reachable; the rules documented as "the monitoring rule set."
Failure domain: the cluster plus its shared storage is one big domain containing every critical VM — so the monitor must not be a VM in it. The shop repurposes a compact but sound machine as a standalone host with mirrored local SSDs. It is plugged into its own small UPS on a different circuit than the server rack. The host is patched into a different switch than the cluster's primary uplink.
Platform and sizing: physical, for the independence; a few cores and modest RAM are plenty for 120 devices polled every minute. Disk sized by the retention math with room for years, and a check watching that volume's free space from day one.
Hygiene: dedicated duty, current OS, monthly patch window, NTP against the same sources as the fleet. Configuration and database are backed up nightly to the file server. The shop notes honestly that the file server lives on the watched cluster. So a copy also goes offsite with the regular backup job.
Dependency audit: core network checks are pinned by IP. A local break-glass admin account sits beside the domain login. Alert email flows through the internal mail VM, so a second path is added for the handful of severity-one alerts. Accepted residual risk, written down: "monitoring goes dark if its own switch or the building does."
Total spend: one modest box, one small UPS, an afternoon. When the shared storage eventually has its bad day — and it will — the monitor stays up and the alerts fire. The incident then starts with knowledge instead of a phone call.
The placement checklist
| Dimension | Ask yourself | Good sign |
|---|---|---|
| Network reach | Can it poll every monitored segment, and receive traps and syslog back? | Documented rules; no "we'll open that later" gaps |
| Failure domain | Which outages take the monitor down with the patient? | Separate host and storage; own UPS; residual risk written down |
| Platform | Is it inside the blast radius of what it watches? | Independent host, second cluster, or standalone box |
| Sizing | Is disk sized by the retention math, with headroom for double the devices? | Fast disk; free-space check on the database volume |
| Hygiene | Is it dedicated, patched, and time-synced? | Maintenance window on the calendar; NTP verified |
| Dependencies | What must work for the monitor to work? | Audit done; DNS, auth, and alert-path couplings shrunk |
| Backups | Could you rebuild config and history after a loss? | Config and database backed up, one copy off the watched systems |
Where to go next
Placement is the quiet half of monitoring architecture: nobody notices a well-placed server, ever, and that is the point. Give it a seat that sees every segment and a home outside the failure domains it watches. Give it a boring well-kept base and a dependency list you have actually read. Then the worst day of your year becomes the day monitoring proves its worth instead of joining the casualty list. From here, the natural next reads are designing the management path it will poll through, and choosing the database backend underneath it. Both are part of Monitoring Architecture.
Put this into practice with SysPeep Monitor
SysPeep Monitor keeps the footprint this guide assumes: one central service on a single Windows machine. A modest VM or standalone box is enough. SysPeep Monitor has an embedded SQLite backend to start and MySQL/MariaDB or SQL Server when you grow. Remote probes extend reach into other segments, and high-availability clustering is there when the doctor needs a partner. The free trial installs in minutes.
Download Free TrialLearn About SysPeep - All Rights Reserved.