
Monitoring as Code in Plain Language
Somewhere in your monitoring system there is a threshold that someone changed. You do not know who or when. And you do not know why. You only know that the file servers stopped alerting on disk space a while back. Nobody noticed until one of them filled up on a Sunday. If you have ever clicked through a web console trying to reconstruct a change from memory, you have already met the problem that monitoring as code solves.
The phrase sounds like something for large engineering teams with a build pipeline and a generous coffee budget. It is not. At its heart, monitoring as code is a plain habit. The configuration that describes your monitoring lives in files. The files live in version control, and changes get a second look. The running system is produced from those files instead of being the only copy of the truth. Nothing about that requires a big team. It arguably helps a small one more, because a small team cannot afford to remember everything.
By the end of this guide you will know what the idea means in practice. You will know why it pays off even for two people and a closet full of switches. You will know what can and cannot be expressed this way. And you will know where your own setup sits on an honest maturity ladder. You will also know the smallest step that moves you up one rung.
In this guide
- The recipe, not the cake
- The four habits that make it "as code"
- Why it matters even for a small team
- What can be expressed as code — and what cannot
- The honest maturity ladder
- A worked example: one threshold change
- Common objections, answered
- Where to go next
The recipe, not the cake
Think of a running monitoring system as a cake. It contains hundreds of devices, thousands of checks, thresholds that were tuned over many months. It contains alert rules that route the right problem to the right person, and dashboards somebody arranged with real care. It is the product of a great deal of work, and it exists in exactly one place: the database of your monitoring server. If that server dies, the cake is gone. If someone changes a threshold, the cake changes and nobody wrote it down. You can inspect the cake all you like, but you cannot easily tell how it was made.
Monitoring as code means keeping the recipe. The recipe is a set of plain text files. They contain a list of devices with their addresses and roles, templates describing what to check on each kind of device, and threshold values. They also contain alert rules, notification routing, dashboard layouts, and recurring maintenance windows. Given the recipe and an empty monitoring server, you can bake the cake again. Given two versions of the recipe, you can see exactly what changed between them. Given a bad change, you go back to the previous recipe and bake again.
The word "code" puts people off, so it is worth being precise. It does not mean you write a program every time you add a switch. It means the configuration is expressed in text with a structure. That might be YAML or JSON for nested settings, CSV for spreadsheet-style tables, or whatever export format your tool produces. Both a person and a script can read it. Text is the important part. Text can be compared line by line, stored with a history, searched, generated from a template, and reviewed by a colleague. A screenshot of a settings page can do none of those things, and a database only the tool can read is not much better.
The four habits that make it "as code"
Strip away the jargon and monitoring as code comes down to four habits. They build on each other, and you can adopt them one at a time.
1. Configuration lives in files
Not only in the tool's database, and not only in someone's head. Every decision about what is monitored, how often, with which thresholds, and who gets told is written down in a file. That file can be opened in a text editor. For most teams this begins with the tool's own export or backup feature. The mechanics differ from product to product, so check the product documentation for its import and backup options.
2. The files live in version control
A repository is a folder with memory. Every time you save a change into it — a commit — the repository records what changed, who changed it, when, and a short note explaining why. Git is the common tool for this, and it runs perfectly well on one machine with no server involved. A sibling guide covers the mechanics in plain language: Version-Controlling Your Checks and Thresholds.
3. Changes are reviewed
Before a change to something that pages people is applied, a second person reads the difference between the old file and the new one. The diff — the line-by-line comparison — is small and specific, so the review takes minutes. "You lowered the CPU warning on every server, not just the terminal servers — was that intended?" is a question that is very cheap to ask at review time. It is very expensive to discover at three in the morning.
4. The running system is produced from the files
This is the habit that separates real monitoring as code from "we keep backups." The direction of truth runs from files to system, not from system to files. When you want to change a threshold, you change the file and apply it. You do not click in the console and hope to remember to export later. How "apply" works depends entirely on your monitoring tool. Some read a configuration directory. Some offer bulk import from a spreadsheet. Some expose an API (an application programming interface — a way for a script to talk to the tool directly). And some only have manual import through the console. The habit is the same; only the mechanics differ. If your tool has an API, the guides under Monitoring APIs and Webhooks explain how scripts talk to it.
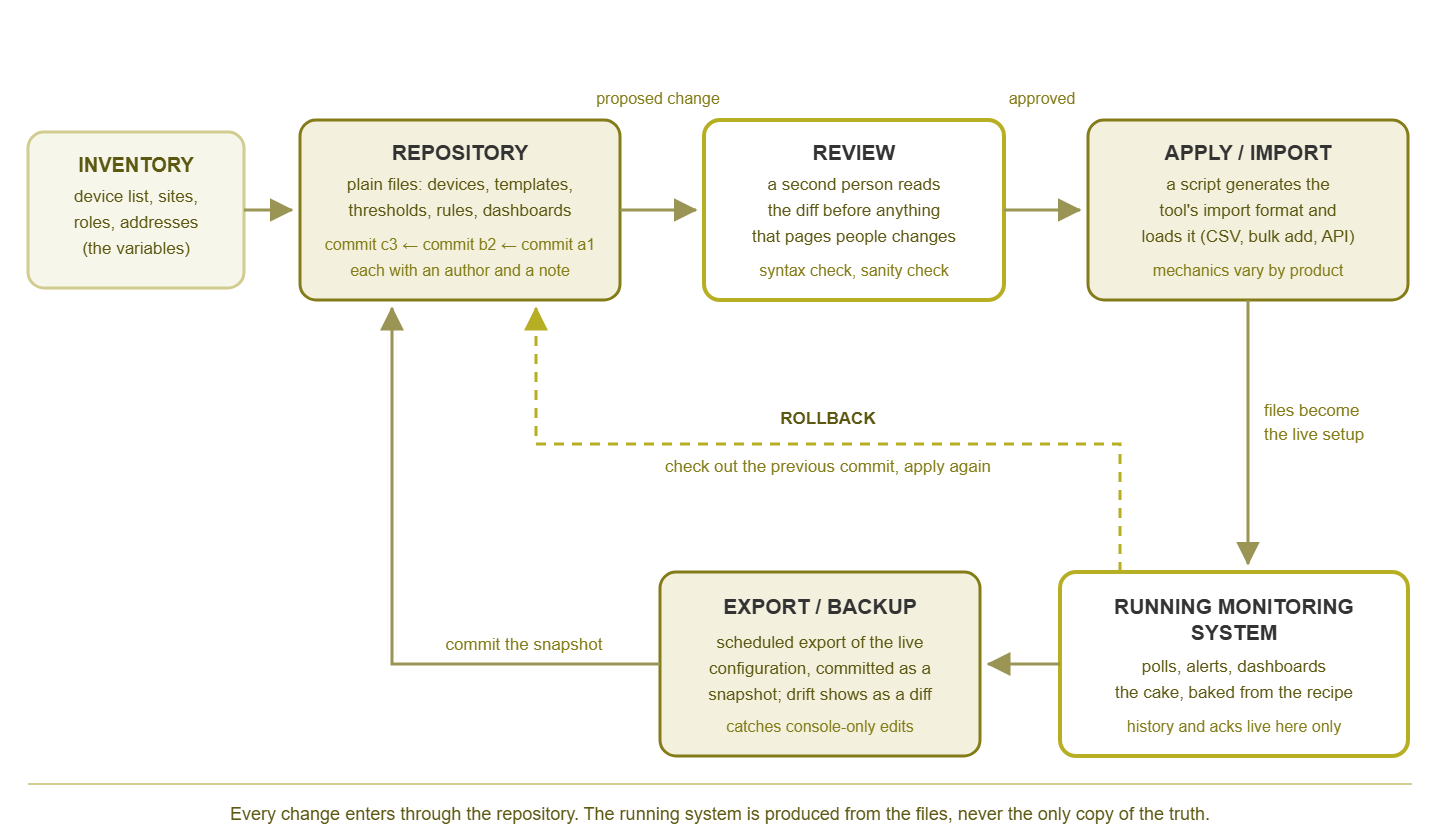
Figure 1: The loop. Every change enters through the repository. The running system is produced from the files, and exports flow back so that drift shows up as a diff.
Why it matters even for a small team
Large teams adopt this because they have no choice: twenty people editing one console is chaos. Small teams arguably gain more, because they have no spare person to remember how things were set up.
Every change has an author and a reason
A commit note is the cheapest documentation you will ever write. "Raised disk warning on the archive server to 92% — it is meant to be nearly full" takes ten seconds to type. It answers, forever, the question that would otherwise be asked every time a new admin sees the odd threshold. When something breaks after a change, the history tells you what changed and who to ask.
Rollback is a command, not an archaeology project
If a change turns out to be wrong, you tell version control to undo that commit and you apply the files again. That is the whole procedure. Compare that with trying to remember which of fourteen console settings you touched and what each one said before. Rollback being cheap also makes you braver about improvements, because a mistake costs minutes instead of an evening.
Onboarding ten sites is a loop, not a week
When a branch office comes online, its router, switch, firewall, access points, and UPS should be monitored exactly like the ones at every other branch. In a console, that is an afternoon of clicking and a good chance of missing one uplink. With templates and a device list, it is one row per device in a CSV file and a script that generates the rest. The sibling guide Templated Device Onboarding walks through that pattern.
The configuration is the documentation
Written standards go stale the day after they are written, because the standard and the reality live in different places. When the standard is the template that produces the reality, they cannot drift apart. The guide on monitoring standards covers what those written standards should say. Monitoring as code is how you make them enforceable rather than aspirational.
Rebuilding after disaster is possible
The monitoring server is a server, and servers die. A backup of its database gets you back the cake as it was. The recipe gets you a fresh cake on new hardware or a new operating system. Or it gets you a fresh cake on a newer release of the tool that cannot read the old database. The guide on backing up the monitoring system covers the backup side; Reproducible Setups covers the rebuild-from-files side.
What can be expressed as code — and what cannot
The dividing line is between configuration and state. Configuration is what you decided: which devices, which checks, which numbers, which people. State is what happened: the measurements collected, the alerts that fired, the acknowledgement someone clicked at lunchtime. Configuration belongs in files. State belongs in the database and in its backups. Trying to force state into files produces enormous, useless diffs; trying to keep configuration only in the database produces the mystery threshold from the introduction.
| Item | As code? | Notes |
|---|---|---|
| Device list (names, addresses, sites, roles) | Yes | Usually generated from the inventory rather than typed by hand |
| Check templates per device role | Yes | The heart of the recipe; one template, many devices |
| Thresholds | Yes | The values most worth reviewing before they change |
| Alert rules and notification routing | Yes | Who is told, about what, through which channel, after how long |
| Dependencies between devices | Yes | Often a field on the device: "this switch depends on that router" |
| Dashboards and maps | Usually | Depends on whether the tool exports them in a readable format |
| Recurring maintenance windows | Yes | "Patch Tuesday, second Tuesday, midnight to four" is configuration |
| One-off maintenance windows | Rarely | Set in the console for tonight; not worth a commit |
| Historical metric data | No | That is data, not configuration; back up the database instead |
| Acknowledgements, silences, current alert state | No | Runtime state; it lives and dies with the running system |
| Credentials and community strings | Never in files | Referenced by name; the value comes from a secret store at apply time |
Two rows deserve a closer look. Auto-discovered devices are a mixed case. Discovery finds what is on the network. But the decision to accept a found device into monitoring, with a role and a site, is a decision. And decisions belong in files. A good pattern is to let discovery feed the inventory, and let the inventory feed the repository. That way, nothing ends up monitored without a row somewhere that says why. The guides under Discovery and Inventory cover that side.
Credentials are the other one. Consider the SNMP community string (the shared password a network device accepts for monitoring queries). Also consider the read-only account the collector logs in with and the token the notification integration uses. None of these ever go into the repository, even a private one. The file says credential: snmp-readonly-branch and the value is fetched by name from a secret store when the configuration is applied. This is not paranoia; repositories get copied, shared, and attached to tickets. And a secret in a commit is a secret in every copy forever.
The honest maturity ladder
Nobody goes from a console-only setup to a fully automated, tested pipeline in one step, and nobody should. Here is a ladder with five rungs. Each is useful on its own, is a reasonable place to stop for a while, and makes the next one easier. Be honest about which rung you are on; there is no prize for claiming a higher one.
| Rung | What it looks like | Effort to reach | What you gain |
|---|---|---|---|
| 1. Exports in a folder | A scheduled export or backup of the configuration lands in a folder on a file share | An hour: find the export feature, schedule it | You can restore; you can look at an old export and compare by eye |
| 2. Exports in version control | The same exports are committed to a repository on a schedule and after every deliberate change | An afternoon: install git, commit, write a wrapper script | Diffs, history, "who changed what and when," rollback of the files |
| 3. Generated from templates | Devices are defined as role plus variables; a script fills templates and produces the tool's import format | A few days, mostly deciding on roles and naming | Consistency across sites; onboarding becomes a loop; standards are enforced by construction |
| 4. Applied automatically | Committing to the main branch triggers the generate-and-import step with no clicking | Depends heavily on the tool's import or API options | The console stops being where changes are made; drift becomes visible as a diff |
| 5. Tested before applying | Validation scripts and a staging instance catch bad values before production sees them | A staging install plus a handful of lint checks | A bad threshold is caught by a script, not by the person on call |
Most small teams live happily at rung two or three for years, and that is a perfectly good outcome. Rung two alone removes the "mystery threshold" problem completely. Rung three is where multi-site consistency arrives. Rungs four and five earn their keep when several people make changes, when there are many sites, or when a bad change has already burned you once. The sibling guide Testing and Rolling Out Monitoring Changes Safely describes rung five at a size that fits a small team.
Tip: the fastest way up the first two rungs is to find your tool's export feature today. Schedule it to run nightly into a folder. Then commit that folder once a day with a script. You will have history within a week. And the first time a diff shows you a change nobody remembers making, the rest of the ladder will sell itself.
A worked example: one threshold change
Here is what a change looks like at rung three or above. The file server role has a disk-usage check, and after a full-disk incident the team agrees to lower its thresholds. The file is a small YAML document in the repository; the exact keys will differ in your tool, but the shape is typical.
$ git diff roles/file-server.yaml
 role: file-server
 description: Windows file servers, all sites
 checks:
   disk_used_percent:
     interval_minutes: 5
-    warn: 85
-    critical: 95
+    warn: 80
+    critical: 90
   memory_used_percent:
     warn: 90
     critical: 95
The diff is the entire change. Two numbers went down; nothing else moved. Whoever reviews it can see at a glance that the memory thresholds were not touched. They can see that the interval is the same, and that the role affects every file server, not one. Then it is committed with a note that explains the reason and points at the incident record:
$ git commit -am "Lower disk thresholds on file servers after the FS02 full-disk incident (ticket 4471)"
[main 3e9c1a0] Lower disk thresholds on file servers after the FS02 full-disk incident (ticket 4471)
 1 file changed, 2 insertions(+), 2 deletions(-)
The apply step then does whatever your tool needs. It might regenerate the import file for every device with the file-server role and load it. Or it might call the API once per device, or produce a file you import through the console. Every file server now has the new thresholds, and the history says who changed them, when, and why. If the new value turns out to be too chatty, the way back is one command that creates a new commit undoing the old one. That is followed by the same apply step:
$ git revert 3e9c1a0
[main 7b2d44f] Revert "Lower disk thresholds on file servers after the FS02 full-disk incident (ticket 4471)"
 1 file changed, 2 insertions(+), 2 deletions(-)
Notice that the rollback is itself recorded. Nothing is silently undone; the history shows the change, the revert, and ideally a note about why the first attempt did not work. Months later, the history can tell you "we tried 80 and it was noisy on the archive server, so we added an override." The alternative is a new admin trying 80 again.
Common objections, answered
"Our tool does not support any of this"
Almost every tool supports rung one, because almost every tool can export or back up its configuration. Start there. The habits — write it down, keep the history, review the diff, treat the files as the truth — apply to any product. The higher rungs depend on the product's import and automation options; some tools make rung four easy and some make it a project. Check the product documentation before planning past rung three.
"We are two people; this is overkill"
Two people is precisely the team size where one person's memory is a single point of failure. The person who tuned every threshold will go on holiday, change jobs, or simply forget. Rung two costs an afternoon and means their reasoning survives them. Rung five for thirty devices would be overkill; rung two is basic hygiene.
"Discovery already finds everything for us"
Auto-discovery is genuinely useful. But discovery answers "what is on the network?", not "what should its thresholds be, who should be woken up, and which router does it depend on?" Those answers are configuration, and they deserve a home in files. Let discovery populate the inventory; let the inventory drive the templates.
"Is this not just backups with extra steps?"
Backups are rung one, and they are essential. The difference is direction and review. A backup copies the system into files after the fact; monitoring as code produces the system from files that were reviewed before the fact. Backups tell you what the configuration was; the repository tells you why. You want both, and they protect against different failures.
"What about changes made in the console anyway?"
They will happen — someone in a hurry, a contractor, a well-meaning manager. The scheduled export in the diagram is your defence. When the nightly export is committed, any console-only change shows up as a diff with no commit note. That is drift, and the fix is to either write the change into the files properly or apply the files again to undo it. Either way it stops being invisible.
Where to go next
Monitoring as code is four habits, not a product. The habits are configuration in files, files in version control, changes reviewed, and the running system produced from the files. Even the lowest rungs of the ladder answer the question that started this guide — who changed the threshold, and why. The higher rungs turn multi-site onboarding into a loop and disaster recovery into a rebuild. The rest of the Monitoring as Code guides take each piece in turn: templated onboarding, version-controlling checks, reproducible setups, and testing changes before they reach production. Pick the rung above the one you are on and start there.
Put this into practice with SysPeep Monitor
Monitoring as code is a set of habits that works with any monitoring tool. The mechanics of importing configuration differ from product to product. Check the product documentation for its import and backup options. SysPeep Monitor's part of the loop is the running system. It auto-discovers devices and interfaces. Its thresholds, dependencies, and alert rules are exactly the settings this guide suggests you record, review, and version. The free trial installs on a Windows machine in minutes.
Download Free TrialLearn About SysPeep - All Rights Reserved.