
Metrics, Logs, and Traces: The Three Data Types Explained
Every observability slide deck arrives, sooner or later, at the same slide. It has three columns of equal width, headed metrics, logs, and traces, under a title that calls them "the three pillars." The words are used as if everyone in the room grew up with them. If you quietly suspect you could not define a "trace" under oath, you are in good company. Most working admins learned one or two of these by necessity and nod politely through the third.
All three are simple ideas wearing intimidating vocabulary. A metric is a number tracked over time. A log is a written record of something that happened. A trace is the travel diary of a single request as it hops across systems. That is the whole concept list. The rest is detail, cost, and knowing which one answers which kind of question.
This guide defines each type in plain language, then does the more useful thing. It walks through one outage — an overloaded file server — three times, once through each lens. That lets you see what each data type reveals and what it misses. Along the way you will learn what each type costs to collect and keep. You will learn which ones a small infrastructure team should actually invest in first, and how collection works in practice. I have lived through the file-server hour below more than once. It went better on the days I had all three lenses, and it went fine on the days I had two.
In this guide
- First, the umbrella word: telemetry
- Metrics: numbers over time
- Logs: the written record
- Traces: one request's journey
- One outage, three lenses
- What each type costs to collect and keep
- What a small team should collect first
- Collection basics for each type
- Where to go next
First, the umbrella word: telemetry
Before the three types, one word above them. Telemetry just means measurement at a distance — the same word used for spacecraft and race cars applies to your server closet. Any data a system sends or exposes about its own condition is telemetry. Metrics, logs, and traces are simply the three shapes that data commonly takes. When a vendor says "we ingest your telemetry," they mean "your machines' numbers and event records get sent to us." Nothing more mystical than that.
Metrics: numbers over time
A metric is a named number sampled repeatedly: CPU load is 43% at 09:00, 45% at 09:01, 44% at 09:02. Each sample is tiny — a name, a number, a timestamp — and the value comes from watching how the numbers move. Plotted, they become the graphs you already know. Those show bandwidth on an interface, free space on a disk, temperature in a rack, or response time of a ping. If you have ever glanced at a chart and said "that climbed all week," you were using metrics.
The analogy: metrics are the vital-signs monitor beside a hospital bed. Pulse, blood pressure, oxygen — a handful of numbers, refreshed constantly. A nurse can see at a glance that something is wrong and roughly how wrong, which is exactly the job. But no one diagnoses the cause from the beeping box alone. Metrics are superb at "when did it start, how bad is it, is it getting worse" and famously weak at "why."
Two flavors are worth knowing by name. A gauge is a level that goes up and down, like memory in use. A counter only climbs — total bytes sent since the device booted — and your tools turn it into a rate by subtracting successive readings. That distinction matters mostly when graphs look absurd; a counter that resets when a switch reboots can briefly masquerade as a traffic miracle.
One more idea pays rent later: a metric is only as useful as the labels attached to it. "Disk latency: 40 ms" is a trivia fact. But "disk latency, server fs01, volume D: 40 ms" is something you can slice, compare, and act on. When you set up collection, the labels tell you which device, which interface, which volume, and which site. They let you later ask "show me only the file servers" without starting over. Consistent naming is not housekeeping fussiness; it is what makes the data answer questions.
The character of metrics: cheap to collect, tiny to store, fast to graph, easy to alert on with thresholds. Their weakness is that all detail is squeezed out at collection time. "Disk latency averaged 40 ms in that five-minute window" survives; which files, which process, which user never existed in the data at all.
Logs: the written record
A log is a timestamped record of an event, written by software at the moment the event happens. For example, a service started, a login failed, a job finished, or an error occurred. Where a metric says "a number moved," a log entry says "a specific thing happened, and here are the particulars." Every operating system, network device, and application you own already writes logs today. Windows machines write into the Event Log. Network gear and Linux boxes typically use syslog (the long-standing standard for sending log lines over the network to a collector).
Logs come in two styles. Free-text lines are written for human eyes; structured logs record the same event as labeled fields a program can filter on. Same event, two outfits:
Mar 3 08:35:02 fs01 backupsvc: verify job "Nightly-Full" started, set BK-2291
{"time":"08:41:17","host":"fs01","level":"warn","event":"smb_slow","share":"projects","ms":4813}
The analogy: if metrics are the vital-signs monitor, logs are the nurse's notes — "08:35, patient given medication; 08:41, patient reports dizziness." Sparse numbers tell you that something changed; the notes tell you what happened around the change. Nearly every root cause you will ever find is written down in a log somewhere. A root cause is the first thing that went wrong, as opposed to the symptoms it produced. It is usually written with embarrassing clarity, discovered two hours into the investigation.
Logs also carry a built-in triage system: severity levels. Most logging schemes grade every entry on a ladder something like debug, informational, warning, error, critical. Two practical habits follow. When searching, start at warning-and-above and only descend into the informational chatter if you must. And when configuring what gets written, remember the ladder is a volume knob. Turning on debug-level logging "just in case" is how a quiet server starts producing more prose than a novelist. It is also how log disks fill at the least convenient hour.
The character of logs: rich, specific, and the place where "why" lives. The price is bulk. A busy server can write thousands of lines an hour, most of them routine noise. Finding the one line that matters means searching. That in turn means keeping the logs somewhere searchable, for long enough to still have last Tuesday when last Tuesday becomes interesting.
Traces: one request's journey
A trace follows a single request across every system it touches and records how long each step took. When a user clicks "open file," that click might pass through their PC, a namespace lookup, a file server, and finally a disk. The namespace lookup is the step that turns a share name into the server holding it. A trace stitches those steps together into one connected picture of that one click. Each step is called a span, with its own start time and duration. The stitching works by passing a shared ID along the chain, so every system's contribution can be matched up afterward.
The analogy is parcel tracking. A tracking number shows your package scanned in at the depot, on the truck, at the sorting hub, and out for delivery — with times. So when it is late, you can see where it sat. A trace is a tracking number for a request. And its superpower is exactly that: in a chain of suspects, it points at the slow link instead of letting everyone blame everyone else.
The catch, and it is a big one for infrastructure folk: traces do not exist unless the software in the chain cooperates. Applications must be instrumented — built or modified to create spans and pass the ID along. Your switches, firewalls, and off-the-shelf vendor applications generally will not participate, however nicely you ask. That makes tracing mostly a tool for teams that write and run their own applications. That is why it sits last in this guide and last on a small infrastructure team's shopping list.
One outage, three lenses
Now the promised experiment. The scene: Monday morning, and the tickets say "saving files is really slow." The file server fs01 is up, pings clean, disk far from full. Let us replay the same hour through each data type and see what each one hands you.
Through the metrics: when, and which resource
The graphs for fs01 show CPU normal and network normal. But disk latency, flat at a few milliseconds all weekend, begins climbing at 08:35. It is spiking past several hundred milliseconds by 08:40, exactly when tickets started. In thirty seconds of looking, metrics have given you the two things they are best at. Those are a precise start time and the resource under strain (the disk subsystem, not the network everyone was blaming). What they cannot say is what is causing the load. The vital-signs monitor is beeping; the cause is not on the screen.
Through the logs: what, and why
Armed with "08:35, disk," you open the logs on fs01 and look around that timestamp. There it is, in plain text. The backup system's verification job started at 08:35. That is the one that reads every byte of the weekend's full backup to confirm it. It normally runs at 02:00 and finishes long before anyone arrives. A hung previous job pushed it into business hours, and now it is fighting the entire office for the same disks. The log has answered "what" in one line. Notice the order of operations, though: the metric told you where and when to look. Without it, you would be scrolling thousands of lines with no idea which minute or which server mattered.
Through a trace: where in the chain
Now imagine the "open file" click was traced. One user's request, laid out span by span: client 3 ms, namespace lookup 2 ms, server accepts 4 ms — disk read 4,810 ms. The trace does not know about backup jobs, but it settles a different argument instantly. The time is going into storage on fs01, not the network path, not the user's laptop, not name resolution. In a multi-team or multi-vendor blame session, that one picture ends the meeting. Most Windows-centric shops will not have real traces of file operations. The walkthrough shows you can triangulate the same answer from metrics plus logs. But this is what the third lens buys when it exists.
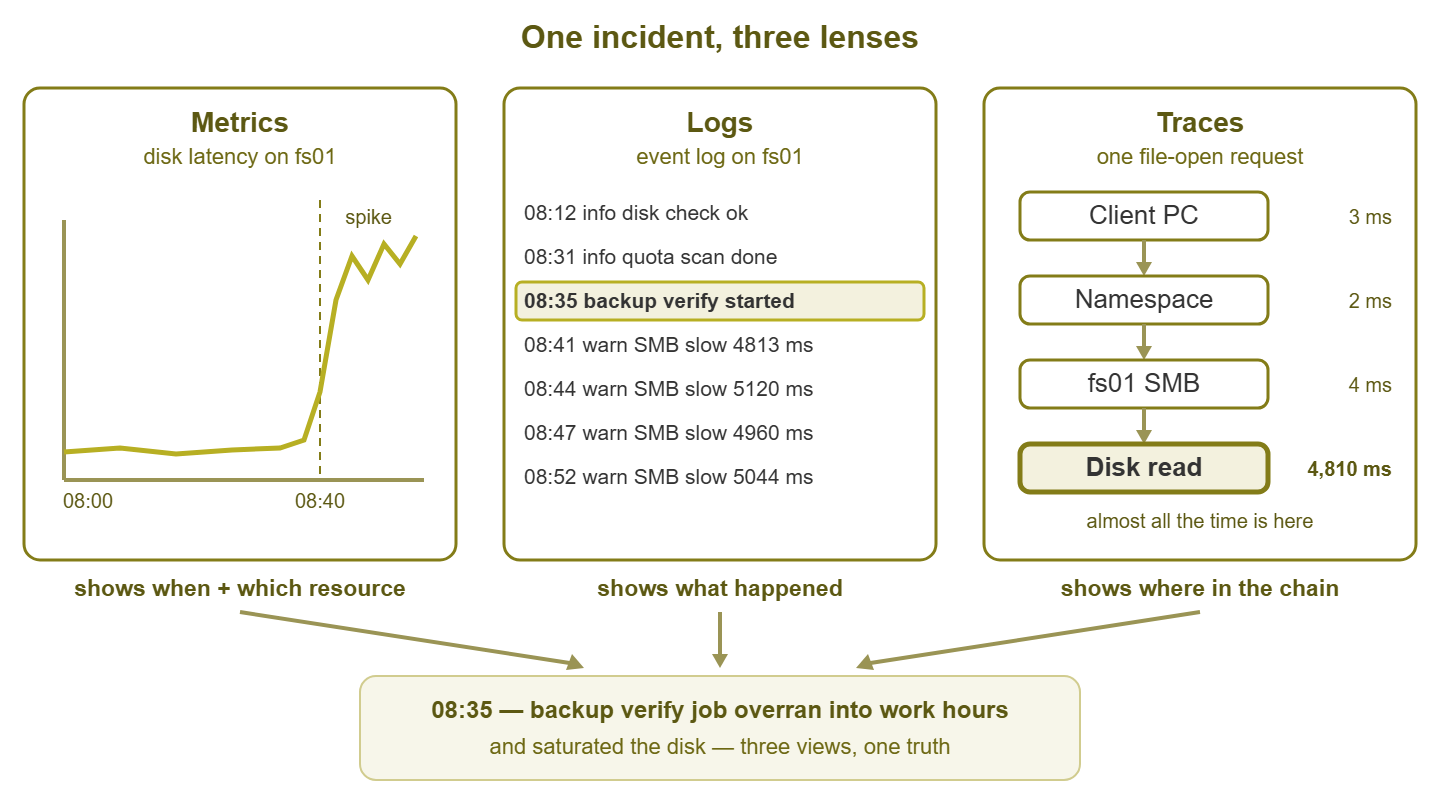
Figure 1: one incident, three lenses — the metric shows when and which resource, the log shows what happened, the trace shows where in the chain the time went.
Same outage, three different questions answered. That is the honest heart of the "three pillars" talk: the types are complements, not competitors. The fastest diagnoses hop between them. A metric finds the when-and-where, a log finds the what, and a trace (if you have one) settles the where-exactly. The slide draws them as three columns of equal width, which is the last thing about them that is equal.
What each type costs to collect and keep
The three types have very different appetites, and the differences drive every practical decision about them:
| Metrics | Logs | Traces | |
|---|---|---|---|
| One record is | A name, number, timestamp | A timestamped event, text or fields | A tree of timed spans for one request |
| Typical size | A few bytes per sample | Hundreds of bytes per line | Kilobytes per traced request |
| Volume driven by | Devices × metrics × polling rate | How chatty software is; verbosity settings | Request rate × sampling rate |
| Usual retention | Months to years, thinned with age | Days to months; cost decides | Days; usually only a sample kept |
| Queried by | Graphing and thresholds | Searching and filtering | Following one request end to end |
| Weakness | Detail discarded at collection | Bulk; noise buries the signal | Needs instrumented software |
Three retention tricks keep the appetites affordable, one per type. Metrics get downsampling: keep one-minute detail for recent weeks, then thin older data to hourly averages — trends survive, storage shrinks enormously. Logs get rotation and tiering. Recent logs stay hot and searchable. Older ones get compressed or dropped on a schedule you choose deliberately (the default schedule was chosen by nobody, for nobody). Traces get sampling: keep every slow or failed request but only a small fraction of routine ones. The millionth healthy request teaches nothing the first thousand did not.
Tip: whatever you collect, sync every clock first with NTP (Network Time Protocol). Timestamps are the only join key the three data types share. The entire walkthrough above worked because "08:35 on the graph" and "08:35 in the log" meant the same instant. Five minutes of clock skew quietly breaks all of it.
What a small team should collect first
The priority order for a small infrastructure team follows straight from the cost table.
Metrics first. They are the cheapest to collect and the broadest in coverage. Every device you own can produce them with no changes to anything. They power the alerting that tells you a problem exists at all. A modest metrics setup covers availability, interface traffic, CPU, memory, disk space, and disk latency. It answers "is something wrong, where, since when" across the whole estate for almost no storage.
Logs second, and mostly by not throwing them away. The charming secret of log collection is that production is already running at full capacity: everything you own writes logs today. Your project is not creating them but keeping them — longer than the defaults, and ideally gathered somewhere central. That way, an investigation does not mean logging into nine consoles. Even a basic central collector changes incident work completely, because logs are where root causes live.
Traces last, and possibly never — and that is fine. If your shop mostly runs Windows infrastructure and vendor-supplied applications, you cannot instrument what you did not write. In that case, buying a tracing backend (the system that stores and displays the traces) gives you nowhere to point it. Tracing earns its keep for teams operating home-grown, multi-service applications. If your organization has such a development team, tracing is properly their project on their layer. It rests on the metrics and logs you provide underneath. Meanwhile, you can get a rough version of the trace lens for free. Measure at each hop you do control — ping the path, time the DNS lookup, time the share open. Let synced timestamps stitch the story together.
Collection basics for each type
Collecting metrics: polling
Metrics collection is mostly polling: a collector asks each device the same questions on a schedule, typically every one to five minutes. Network gear answers over SNMP (Simple Network Management Protocol). Windows machines answer over WMI (Windows Management Instrumentation) or an installed agent. Linux and other systems answer via SNMP, SSH, or agents. Under the hood it is as plain as this — one question, one number:
C:\> snmpget -v2c -c public sw-core1 ifHCInOctets.10
IF-MIB::ifHCInOctets.10 = Counter64: 918273645120
That is a counter of bytes received on port 10; poll it every minute, subtract, and you have a traffic graph. The practical decisions are the polling interval and consistent naming. One to five minutes suits most estates; faster multiplies load and storage for little insight. Consistent naming makes a graph findable when you are in a hurry.
Collecting logs: forwarding
Logs flow the other way — devices push them to you. Network gear and Unix-family systems send syslog to a collector's address. Windows has built-in Event Log forwarding to a central machine, or agents can ship selected events. There are two decisions that matter. One is which events to ship (errors, warnings, security events, job results — not debug chatter, which can flood a collector impressively). The other is how long to keep them. Resist the urge to collect everything on day one; a small, curated stream you actually search beats a swamp. Log collection is a craft of its own, and this library covers it in depth elsewhere.
Northgate Retail took "collect everything" literally on the day its central log collector went in. That was because the setup wizard offered it, and the wizard seemed confident. Every switch, every server, and every checkout terminal sent debug-level logs to one machine with a modest disk, and the disk filled in four days. The one useful line from that week, a certificate warning from the payment gateway, was in there somewhere. It was underneath the terminals announcing each receipt they had printed. The team found it three weeks later, after the certificate had expired, by reading the log the gateway had kept for itself. The collector was rebuilt to accept warning-and-above, and it has held a year of logs on the same disk ever since.
Collecting traces: instrumentation
Traces are produced inside applications, by code. Developers add an instrumentation library that creates spans around interesting work and forwards them to a trace backend. Open standards exist so the pieces interoperate. There is no polling and no forwarding switch to flip on a router. If the software in the chain was not built to trace, there is nothing to collect. For the infrastructure side of the house, the actionable version is simply: know what traces are. Then, when the dev team shows you one, you can read the parcel-tracking view. You can see instantly which hop — possibly one of yours — ate the time.
Where to go next
You now own the vocabulary. A metric is a number over time and tells you when and which resource. A log is an event record and tells you what and usually why. A trace is one request's journey and tells you where in the chain. They answer different questions and cost wildly different amounts to keep. For a small infrastructure team the honest shopping order is metrics, then logs, then — maybe, someday, if you write your own software — traces. The next time the three-column slide comes round, you will know that the columns are not the same width. You will also know that one of them has been writing to your disks all along. How do these types fit into the bigger monitoring-versus-observability picture, and should any of it cost you money at all? The rest of Monitoring, Observability & Telemetry continues from here. The wider topics library covers the neighboring crafts in depth.
Put this into practice with SysPeep Monitor
Of the three data types, metrics are where a small team gets the fastest win — and that layer is exactly what SysPeep Monitor handles. It discovers the devices on your network and polls health and performance metrics over SNMP, WMI, and SSH. It graphs them on live dashboards and alerts on sensible thresholds. Pair it with the log collection of your choice and you have covered the two lenses that matter most, first. The free trial installs on any Windows machine.
Download Free TrialLearn About SysPeep - All Rights Reserved.