
The Incident Clock: What MTTD and MTTR Actually Measure
Sooner or later somebody will ask for your MTTD and MTTR. It may be a manager, an auditor, or a vendor's slide deck, and they will say the letters as if everyone agreed what they meant. MTTD is mean time to detect and MTTR is mean time to repair. In most rooms both are said with confidence and meant loosely. Pinned down, they are the two most useful improvement instruments a small IT team owns. I have produced flattering versions of both, and this guide is partly an apology.
Every incident is two races run back to back. The first is how long the fault existed before anyone knew: the time you were blind. The second is how long it took to fix once you could see it. The two races have different causes, different cures, and different budgets. Measure them separately and every incident tells you where to invest next. Measure them as one number, or not at all, and every outage is just another bad day that teaches you nothing.
This guide gives you the precise version. It covers the six timestamps inside every incident and the intervals between them that MTTD and MTTR name. It explains why the word "mean" deserves suspicion. It also gives the short list of definitions your team must agree on before the numbers mean anything. By the end you will be able to draw the incident clock on a whiteboard and defend every line on it.
In this guide
- The two questions hiding inside every outage
- The six timestamps of every incident
- A worked example on the clock
- The metrics: intervals between timestamps
- Why "mean" deserves your suspicion
- What each number tells you to fix
- Agree on the rules before you measure
- The incident-clock reference card
The two questions hiding inside every outage
Imagine the file server died at seven this morning and users could work again at quarter past nine. From the users' side that is one unhappy fact: two and a quarter hours without their files. From your side it is two separate questions. How long was it broken before we knew? If the answer is "forty-nine minutes, because nothing was watching the RAID controller," that is a monitoring problem. In that case, no amount of heroic troubleshooting shortens it, because nobody was troubleshooting yet. And how long did it take to fix once we knew? If that answer is "an hour and a half, most of it spent figuring out what was wrong," that is a response problem. In that case, better checks would not have helped, but a runbook would have.
MTTD measures the first question. MTTR measures the second. The reason to keep them separate is that they point at different shopping lists. One points at checks, polling intervals, and alert routing; the other at documentation, access, spare parts, and practice. A team that only tracks total outage time knows it is hurting but not where. A team that tracks the two clocks separately knows which half of the problem to attack, which for a small team is most of the battle.
The six timestamps of every incident
To measure the two clocks you need the moments they start and stop. Every incident, from a full site outage to a wobbly Wi-Fi access point, passes through the same six timestamps. Three of them are the load-bearing ones (FAULT, DETECTED, VERIFIED); the middle three explain where response time goes.
1. FAULT — when it actually broke
The moment the problem began, whether or not anyone knew. It is the trickiest of the six, because you were not there and nothing announced it. You estimate it from evidence after the fact. That might be the last successful entry in a log, the last good data point on a graph, or the first failed transaction. It might be the timestamp on the first "is the server down?" email. Like dating a roof leak from the size of the water stain, you will usually get close, not exact. That is fine. Record your best estimate and mark it "estimated" so nobody later mistakes it for gospel.
2. DETECTED — when you first knew
The moment your team first had the information that something was wrong. In a well-monitored network this is an alert timestamp, recorded automatically by the monitoring system. That timestamp is the most honest timestamp you will ever get, because no human wrote it down. In a badly monitored network it is the moment a user report arrived. An alert that fires into a mailbox nobody reads has technically detected the problem, but it has not told anyone. For the definition here, DETECTED is when the alert fired or the report landed. If your alerts routinely sit unseen for half an hour, that routing lag is a detection problem to fix. The MTTD playbook deals with it directly.
3. RESPONDED — a human engaged
This is the moment a person actually started working the problem. They did not just glance at their phone or think "I'll look after this meeting," but engaged: acknowledged the alert and began investigating. The gap between DETECTED and RESPONDED is where notification delays, paging failures, and "I assumed someone else had it" live. On paper this gap should be minutes; at 3 a.m. it has been known to contain an entire sleep cycle.
4. DIAGNOSED — cause identified
The moment you knew what was wrong, specifically enough to act on it. "The file server is down" is a symptom; "the RAID controller has hung and needs a reset" is a diagnosis. For unfamiliar problems this phase quietly eats more response time than any other. It is also the phase that runbooks and good alert context shrink the most.
5. FIXED — corrective action applied
The moment you did the thing: restarted the service, swapped the disk, rolled back the config, failed over to the spare. Note the careful wording — the action was applied, not proven to work. Many teams stop their clock here, and it flatters the numbers, because some fixes do not take. The reboot that "fixed" the switch at 9 p.m. and needed doing again at 9:40 produced one incident, not two.
6. VERIFIED — confirmed working
This is the honest end of the incident. Monitoring shows green again and a real test succeeds (a file opens, a mail flows, a page loads). And it stays that way long enough to trust — many teams wait ten or fifteen quiet minutes before calling it. This is the "all clear" discipline that incident response practice formalizes; the incident response guides cover how to declare it. VERIFIED is when users are genuinely back to work, which is why it — not FIXED — is where the user-facing clock stops.
A worked example on the clock
Here is an ordinary bad morning, timestamped. The file server's RAID controller (the card that manages its disks) hangs before dawn. The server still answers pings — the operating system is alive — but every file share is frozen solid.
| Timestamp | Clock time | How you know |
|---|---|---|
| FAULT | 06:52 (estimated) | Last successful write in the server's event log |
| DETECTED | 07:41 | Share-access check alert fired (the ping check stayed green — a coverage lesson for later) |
| RESPONDED | 07:49 | You acknowledged the alert and logged in |
| DIAGNOSED | 08:24 | Event log plus vendor lookup pointed at the hung controller |
| FIXED | 08:51 | Controlled restart completed, shares remounted |
| VERIFIED | 09:07 | Checks green, test file opened, fifteen quiet minutes |
Now read the intervals off the table. Blind time: 06:52 to 07:41, or 49 minutes — the fault existed for most of an hour before anything told you. Response time: 07:41 to 09:07, or 1 hour 26 minutes from first knowledge to confirmed recovery. And the users' experience: 06:52 to 09:07, 2 hours 15 minutes of "the files are down," which is the only number they will remember. One incident, three measurements, each answering a different question.
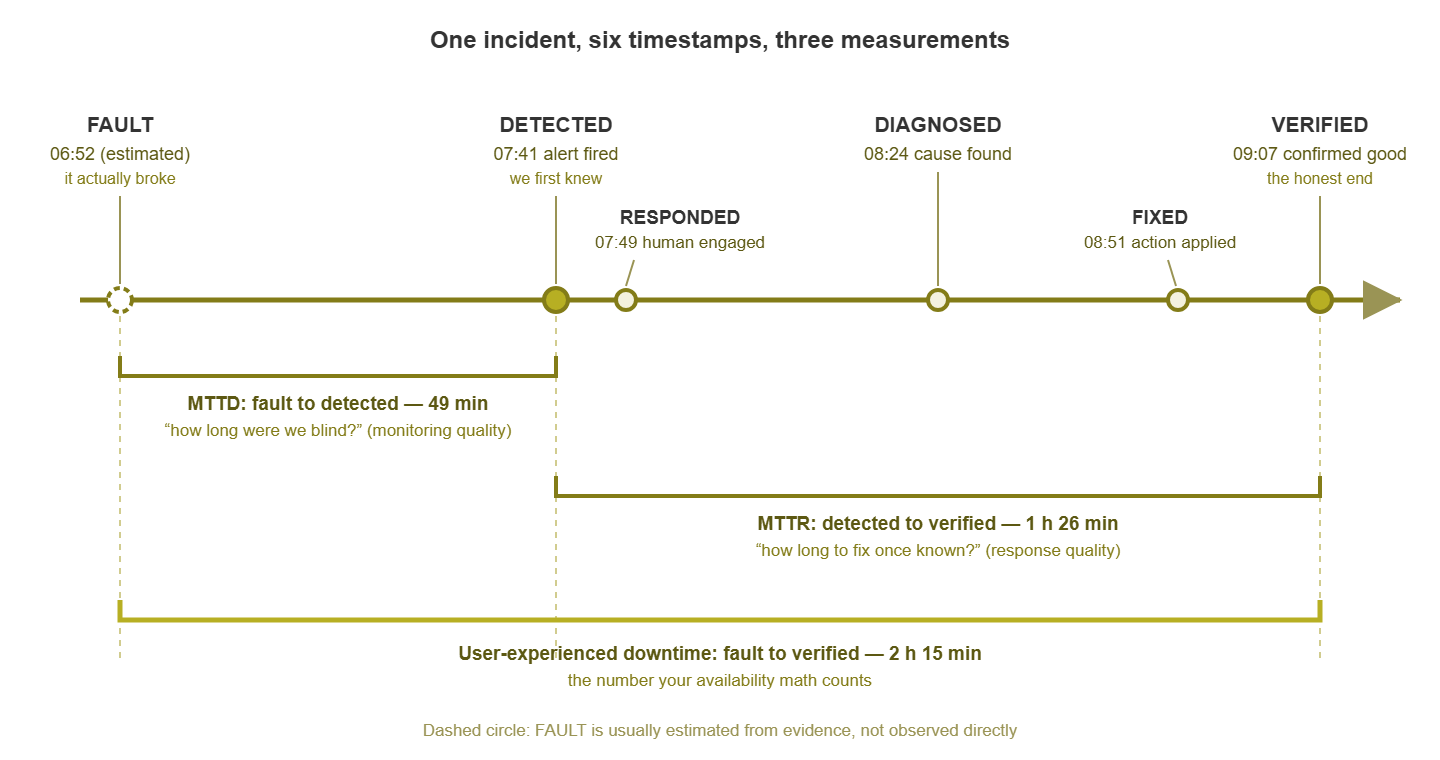
Figure 1: The incident clock. Six timestamps, and the three measurements drawn between them.
The metrics: intervals between timestamps
With the timestamps defined, the acronyms become simple arithmetic: each is the average of one interval, taken across your incidents. ("Mean" is the everyday average — add them up, divide by the count.)
MTTD: fault to detected
Mean time to detect is the average of the FAULT → DETECTED interval. It is the "how long were we blind?" number, and it is purely a monitoring-quality metric. Nothing about your troubleshooting skill, your documentation, or your caffeine intake appears in it — only whether the right checks existed, ran often enough, and reached a human. In the worked example, MTTD's contribution was 49 minutes, and the cause was a coverage gap: the ping check watched the wrong layer.
MTTR: detected to verified
Mean time to repair is most usefully defined as the average of the DETECTED → VERIFIED interval. It is the "how long to fix once we knew?" number, the response-quality metric. The acronym is slippery. In the wild that final R gets expanded as repair, recover, resolve, or respond. Different definitions start the clock at detection or at response, and stop it at FIXED or at VERIFIED. Vendors, frameworks, and the person interviewing you may each mean something different. There is no One True Definition to find. Pick one definition and write it down, so every number in your log measures the same thing. Detected-to-verified is a good pick for a small team: it starts when you could first act and stops when users are honestly back. It is the same discipline as writing down what "down" means before you measure uptime; the definitions-page guide is this one's sibling.
The full arc: fault to verified
The whole span, FAULT → VERIFIED, is user-experienced downtime — MTTD and MTTR laid end to end. This is the interval your availability percentage is made of. Every minute of it is a minute subtracted from uptime, whether it was a blind minute or a wrenching-on-it minute. That link runs both ways. If you already keep honest availability numbers, your outage durations are this arc under another name. The two clocks are how you explain why an outage lasted as long as it did. Availability tells you the score; MTTD and MTTR tell you why.
Why "mean" deserves your suspicion
Incident durations are skewed data: lots of small values, the occasional monster. Means behave badly on skewed data. Suppose a quarter brings ten incidents fixed in ten minutes each, plus one that took eight hours. The mean of those eleven is about 53 minutes — a number that describes none of them. It makes your routine response look five times worse than it is, while making the eight-hour disaster vanish into an average. Improve nothing next quarter and the mean might still swing wildly, purely on whether a monster showed up.
The practical fix is to keep the acronyms (everyone knows them) but report the median. That is the middle value when you sort the list, ten minutes in that example, which honestly describes your typical incident. Report the worst case alongside the median, which honestly describes your bad day. "Median 10 minutes, worst 8 hours" tells the true story that "mean 53 minutes" hides. There is more to honest measurement than this. That includes where timestamps come from and the ways numbers get gamed without anyone quite deciding to cheat. The guide Measuring Without Lying to Yourself is the full treatment. For now, just refuse to let a lone mean summarize your quarter.
What each number tells you to fix
The two clocks form a diagnostic, and that is the payoff for a team of two or three. Each one, when it is bad, points at a specific and different set of causes. So knowing which number is bad tells you where to invest, before you spend a single hour or dollar.
High MTTD is a monitoring problem, full stop. Its causes live in three places. There is coverage (the thing that broke had no check watching it — like our RAID controller). There are intervals and sensitivity (a check existed but polled too rarely or alerted only on catastrophe). And there is routing (the alert fired but took forty minutes to reach a human). Troubleshooting skill is irrelevant to all three; you cannot out-diagnose a problem you have not heard about. The cures are checks, tuning, and notification plumbing — the MTTD playbook works through them cheapest-first.
High MTTR is a response problem, and its causes live in people-and-process land. Causes include having no runbook (every diagnosis starts from scratch). Another is having no access (twenty minutes fumbling with the VPN — the remote-access tunnel into your network — before work begins). Another is having no spares or rollback path (the fix waits on a part or a maintenance window). Another is having no practice (the first time anyone failed over the firewall was during the outage). More monitoring fixes none of these. The cures are documentation, preparation, and drills — the MTTR playbook's territory.
Picture the two numbers as levers side by side. A team with a 49-minute median detection and a 25-minute median repair should not buy training — it should add checks. The responders are clearly fine once they know. A team that detects in 3 minutes and repairs in 4 hours should not add checks — it should write runbooks and stage spares. Without the split, both teams just know "outages take too long" and are equally likely to spend the budget on the wrong half. With it, the next move is nearly always obvious. That is a lot of steering for one small table of timestamps.
Agree on the rules before you measure
Numbers only mean something if every incident is measured the same way. That means agreeing on three things in advance, in writing, on one page. This takes half an hour once and prevents every future argument about whether the numbers are "real."
What counts as an incident?
You need a severity floor: the line above which an event is an incident that gets timestamped, and below which it is just a ticket. Without the floor, your incident count swings with recording enthusiasm — a diligent month "has more incidents" than a lazy one — and averages become mush. A simple three-level scheme is plenty. Severity 1 means a critical service or the whole site is down for many users. Severity 2 means one service is down or degraded for some users. Severity 3 means one user or a cosmetic issue. Measure sev 1 and sev 2; log sev 3 in the ticket system and move on. (Severity schemes and who declares them are core incident response material; borrow yours from there.)
When do the clocks start and stop?
Write down your chosen definitions of FAULT, DETECTED, and VERIFIED — the three load-bearing timestamps — using the definitions from this guide or your own variants. The details matter less than the consistency: a team that always stops at FIXED has comparable numbers over time. A team that stops at FIXED in good months and VERIFIED in honest months has noise.
At Meridian Parts the quarterly response time fell from fifty-one minutes to twenty-four in a single quarter, and nothing on the network had changed. Nobody had written down where DETECTED started. So when the log changed hands the new keeper used the ticket's "opened" time. At Meridian, that meant when somebody answered the phone, not when the alert had fired half an hour earlier. Old numbers and new sat in the same column under the same heading. The definition now lives at the top of the sheet, and the number has gone back up, which everyone agrees is an improvement.
Who records, and when?
The person who handled the incident writes the timestamps down, within a day, while the evidence (and memory) is fresh. One named owner keeps the log itself, because a log with no owner stops being kept.
A one-page measurement policy you can adapt, the whole thing:
INCIDENT MEASUREMENT POLICY (v1 — one page, on purpose)

1. WHAT COUNTS
   An incident is any unplanned sev 1 or sev 2 event.
     Sev 1 = critical service or site down for many users
     Sev 2 = one service down or degraded for some users
     Sev 3 = single-user or cosmetic (ticket only, not timed)

2. THE CLOCKS
   FAULT    = best evidence of when it broke (mark "estimated")
   DETECTED = first alert fired OR first user report arrived
   VERIFIED = checks green + real test passed + 15 quiet minutes

3. THE METRICS
   Detection time = FAULT to DETECTED
   Response time  = DETECTED to VERIFIED
   We report the median and the worst case each quarter,
   plus the incident list itself.

4. RECORDING
   The responder logs timestamps within 24 hours.
   Log owner: (name). Reviewed at the quarterly roll-up.

5. THE POINT
   These numbers judge systems and gaps, never people.
Tip: resist the urge to build a grander system than this — more severity levels, more timestamps, a workflow tool with mandatory fields. Every extra field is friction, and friction is why incident number four goes unlogged at small shops. Six timestamps, three definitions, one page. You can always add ceremony later; you cannot retroactively log the incidents that friction lost.
The incident-clock reference card
Everything above, compressed into one table. Pin it next to the incident log.
| Measurement | From → to | Question it answers | A bad number points at |
|---|---|---|---|
| Detection time (MTTD) | FAULT → DETECTED | How long were we blind? | Coverage, check sensitivity, intervals, alert routing |
| Engage time | DETECTED → RESPONDED | How long before a human worked it? | Notification channels, on-call habits |
| Diagnosis time | RESPONDED → DIAGNOSED | How long to find the cause? | Runbooks, alert context, familiarity |
| Fix time | DIAGNOSED → FIXED | How long to apply the cure? | Spares, rollback paths, permissions |
| Verify time | FIXED → VERIFIED | How long to prove it worked? | Verification steps, recovery checks |
| Response time (MTTR) | DETECTED → VERIFIED | How long to fix once known? | Everything in the four rows above |
| User downtime | FAULT → VERIFIED | What did users experience? | Feeds your availability math |
Where to go next
Six timestamps, two clocks, one full arc, and a one-page policy that makes every incident measure the same thing. That is the whole vocabulary, and it is enough to draw the clock on a whiteboard and defend it. Write the definitions down first; every flattering number I ever produced came from one nobody had written down. The next step is collecting the numbers without fooling yourself. Learn where trustworthy timestamps come from and the five ways teams accidentally game them in Measuring Response Times Without Lying to Yourself. When you are ready to move a number, the MTTD and MTTR playbooks each take one clock apart lever by lever. The rest of Measuring Detection & Response covers turning the results into budget and backing.
Put this into practice with SysPeep Monitor
Half of the incident clock is detection, and detection is exactly what monitoring software is for. SysPeep Monitor discovers your devices, watches them over SNMP, WMI and SSH, and timestamps every alert automatically. That gives you an honest DETECTED clock without anyone writing anything down. The free trial installs on any Windows machine.
Download Free TrialLearn About SysPeep - All Rights Reserved.