
Network Diagrams People Actually Use
Most network diagrams fall into one of two failure modes. The first is wall art: a gorgeous, laminated masterpiece with drop shadows and vendor-accurate icons. It is lovingly produced once, printed large, and never updated. So within a year it depicts a network that no longer exists. Everyone quietly knows not to trust it. The second is the hairball: a dutiful attempt to draw everything, every cable and desktop and printer. It produces a tangle so dense that finding anything takes longer than walking to the server room. Both fail the same test: nobody reaches for them when something is broken.
Useful diagrams are the opposite of both. They are small — each one fits on a screen and answers one question. They are layered — instead of one drawing that shows everything badly, a few views that each show one aspect well. And they are honest — dated, attributed, and marked with question marks where knowledge runs out. So a reader always knows how much to trust them.
This guide teaches that discipline. It covers the three views worth drawing and the craft rules that keep each one readable. It covers how to pick tooling your successor can actually open. And it covers — the part everyone skips — the system that keeps drawings true after the week you made them. By the end you will be able to produce a small set of diagrams that people grab during an outage. That is the only compliment a diagram can earn.
In this guide
- The three-view discipline
- Craft rules that make diagrams readable
- Tooling: what matters more than which tool
- Keeping diagrams true
- A worked example: three views of one small company
- Your diagram standards on one page
The three-view discipline
The root cause of the hairball is trying to answer every question with one drawing. Networks have layers, and each layer has a different audience asking a different question. Draw one view per question. For nearly every small and mid-size network, three views cover everything that matters.
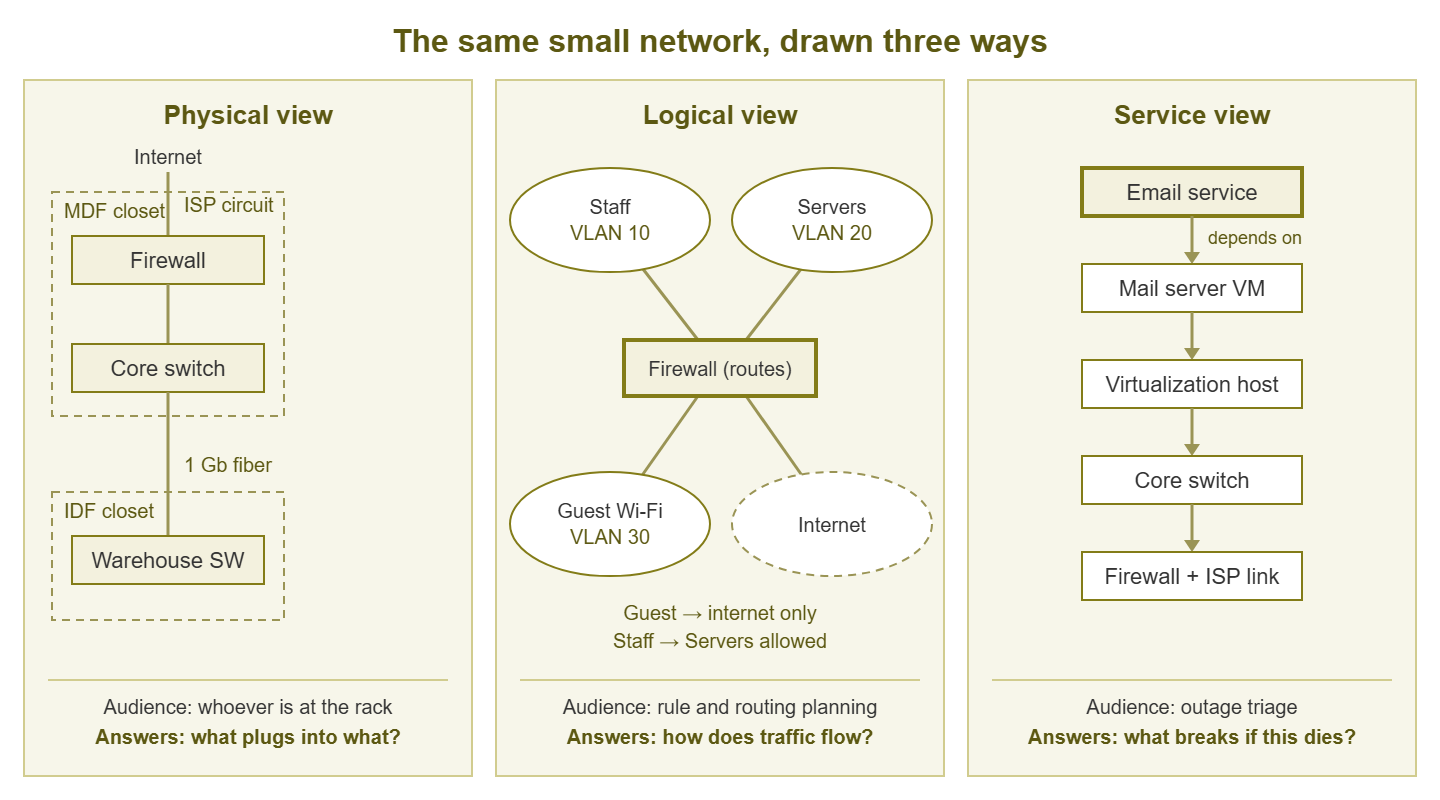
Figure 1: One small network, three views. Same boxes, different questions — which is why one diagram cannot do all three jobs.
The physical view: what plugs into what
The physical view shows hardware and cabling. It shows which closets exist, which switches live in them, and which uplinks connect closet to closet. It also shows where the outside circuits (internet lines, site-to-site links) land. Its audience is whoever is standing in front of a rack — you at midnight, an electrician, the contractor covering your vacation. The question it answers: if I unplug this, what happens? It is the companion to every cable chase.
The detail rule that keeps it legible: infrastructure links yes, endpoints no. Draw every switch-to-switch uplink and every connection to routers, firewalls, servers, and access points. And do not draw the two hundred desktop cables. Endpoint-to-port mapping belongs in switch port descriptions and patch-panel labels, not in a drawing. That physical-layer craft has its own guide: Labels, Port Descriptions, and Cable Hygiene. A physical view that includes desktops is a hairball with a head start.
The logical view: how traffic flows
The logical view ignores cables and shows networks: your subnets and VLANs, and how traffic routes between them. A VLAN (virtual LAN) is a way one physical switch fabric carries several separate networks. A subnet is the block of IP addresses each of those networks uses. On this view, each subnet or VLAN is drawn as a cloud or box — "Servers, VLAN 20, 10.0.20.0/24." The routers and firewalls go between them, with arrows showing which paths exist. Its audience is whoever is reasoning about reachability: planning a firewall rule, debugging "A cannot reach B," deciding where a new system should live. The question it answers: how does traffic get from here to there, and what stands in its way?
The logical view leans entirely on your address plan — the names, numbers, and purposes you assign to subnets. Keep the two consistent: the conventions in Documenting Your Address Space are exactly the labels this view should reuse. If the address plan calls VLAN 20 "Servers," the diagram must not call it "Prod."
The service view: what depends on what
The service view is the least drawn and the most useful during incidents. It shows how a key service actually chains together. Email depends on the mail server, which depends on the virtualization host. The host depends on the core switch and the storage box, which depend on the UPS. One small dependency sketch per critical service — five or six sketches for most organizations. The audience is whoever is triaging an outage, possibly while being shouted at. The question it answers: this service is down — which boxes could be the cause, and what else is about to break? Dependency thinking is a cornerstone of monitoring design too. The Building a Monitoring Strategy pillar goes deeper on it. The service view is that thinking, drawn.
If you are starting from zero and can only draw one view this week, draw the physical view first. It is the hardest to reconstruct from memory later, and the one a stranger can least figure out alone at the rack. The logical view comes second, usually falling out of your address plan almost mechanically. The service views can be built one at a time, each one ideally sketched in the calm week after the incident that proved you needed it.
Craft rules that make diagrams readable
Whatever you draw with, a handful of rules separate diagrams that get used from diagrams that get admired once.
- One purpose per diagram, and split when crowded. Every diagram should answer one question for one audience. The moment a view stops fitting comfortably on one screen or sheet, split it along a natural seam. For example, use one physical view per site or closet, one service view per service. Link them with a small "continues on" marker. Crowding is a signal, not a challenge to draw smaller boxes.
- Consistent shapes and colors, with a tiny legend. Pick one shape per device class — say rectangles for switches, a distinct border for firewalls, rounded boxes for servers. Pick one accent color per meaning, then never improvise. Put a three-line legend in the corner of every diagram. Consistency is what lets a reader parse your third diagram instantly because they have seen your first two.
- Give traffic a direction. Pick a flow convention — internet at the top, endpoints at the bottom is the common one. Keep it across every diagram. When "up" always means "toward the world," a reader's eye finds the firewall without hunting. With that convention, a dependency chain reads like a sentence instead of a maze.
- Label the edges, not just the nodes. The lines carry half the information. Write link speeds on uplinks. Write VLAN numbers on trunks (a trunk is a link that carries several VLANs at once). Write circuit IDs on provider lines. "Two boxes, one line" tells you almost nothing; "1 Gb trunk, VLANs 10/20/30" tells you what breaks when the line does.
- Mark unknowns with a question mark. Where you are not sure, draw it and stamp a
?on it. That might be a link you suspect but have not traced, or a box whose role is unclear. This is the same honesty rule that makes inherited-network survival possible (see the ethos in Your First Week With an Inherited Network). A marked unknown invites verification, while a confident guess invites a 2 AM mistake. A diagram with three question marks is more trustworthy than one with none, and everyone reading it knows that. - Date and author on every diagram, every time. This is the staleness stamp. "Drawn by R. Alvarez" plus a date, small, in a corner. It tells the reader how much to trust the drawing and who to ask about it. And it makes silent staleness impossible, because an old date is visible in a way an outdated box is not.
Tooling: what matters more than which tool
Admins argue about diagram tools the way people argue about text editors. So let us skip the brand war and name the three real options and the criteria that actually matter. Option one: general drawing tools — boxes-and-arrows applications, from free to fancy. Quick to start, fully flexible, and entirely manual to maintain. Option two: diagram-as-code — tools that render a drawing from a plain-text description you write, along the lines of:
core-sw -> firewall  [label "1 Gb"]
firewall -> isp-router [label "fiber, circuit 4471"]
core-sw -> sw-floor2 [label "trunk: VLANs 10,20,30"]
The text file is the diagram. That means it can live in version control, show line-by-line diffs, and be edited with any text editor forever. The tradeoff: you give up hand-placed layout, and the learning curve is real. Option three: your monitoring tool's maps. Many monitoring systems draw topology from what they discover. That is unbeatable for currency and covered in depth in Auto-Generated Topology Maps. The short version is that they excel as the physical/logical skeleton and need human curation for the rest.
Whichever you choose, judge it on three criteria. Editable by your successor: the proprietary-format trap is real. A diagram in a format only one licensed, discontinued, or single-user application can open dies with that application or that user. Prefer open or at least widespread formats, and check that a colleague can actually open and edit the file today. Diffable and versionable where possible: being able to see what changed between last quarter's diagram and this one answers questions nothing else can. Text-based formats win here; for drawing tools, dated export copies are the fallback. Exportable to a plain image: every diagram needs to become a PNG or PDF for the wiki, the wall, and the break-glass folder. No special software should be needed to view it.
Tip: the whiteboard photo is a legitimate version one. Suppose a network is sketched on a whiteboard during an outage postmortem, photographed, dated, and uploaded to the doc system. That beats a perfect diagram that does not exist yet. Many of the best physical views started life exactly this way and were redrawn properly later. Ship the photo; schedule the redraw.
Keeping diagrams true
Diagrams drift faster than any other document, because topology changes casually — a new switch here, a moved uplink there. And nobody's mental model flags "I just invalidated a drawing." Three habits counter the drift.
First, the change-hook rule: diagram edits ride along with the changes that cause them. If the work order says "add switch to floor 3," the work is not done until the physical view shows the new switch. Same sitting, same day, while the port numbers are still in your head. This is the same inside-the-workflow principle that keeps the rest of your documentation alive (see Minimum Viable Network Documentation). It costs two minutes when done immediately — or an archaeology session when done in six months.
Second, the quarterly reconcile: once a quarter, compare the drawn topology against what the network itself reports. Modern switches announce their neighbors over LLDP (Link Layer Discovery Protocol — a standard where each device periodically says "I am switch X, and this port connects to switch Y"). Your discovery or monitoring tool can render that into an as-built map. Lay the discovered map beside your drawn one and hunt differences. Look for a link you never drew, a drawn link that no longer exists, or a device in the wrong place. Every difference is either a drawing error to fix or — more interesting — a change nobody documented. Auto-Generated Topology Maps covers how to make this comparison nearly automatic.
And whenever a diagram actively misleads you during an incident, treat that as an incident of its own. Perhaps you trusted a drawn link that was not there, or missed one that was. Fix the drawing the same day, and spend sixty seconds asking which hook failed to catch the drift. A diagram that has burned someone once gets side-eyed forever; repairing it fast, visibly, and with a fresh date is how it earns its way back.
Third, manage the wall copies. A printed physical view on the server-room wall is genuinely useful — it is there when the network is not. But wall copies do not update themselves, so print them with the date large enough to read at arm's length. And when you print a new one, take the old one down in the same motion. Retire it ceremonially if it helps. Some teams keep a "museum" folder of old topology printouts, which doubles as a surprisingly enjoyable history of the network. What you must never do is leave two undated versions on two walls, because someone will trust the wrong one at the worst time.
A worked example: three views of one small company
To make this concrete, here is the full diagram set for a fictional 60-person company — one office, one small warehouse, a handful of servers. Three views, four pages total.
The physical view (one page): two closet boxes labeled "MDF — server room" and "IDF — warehouse." Inside the MDF: the firewall, core switch, two access switches, the server rack's top-of-rack switch, and the UPS. Inside the IDF: one switch and its UPS. Between them: a single fiber uplink labeled "1 Gb fiber, ~90 m." From the firewall: the internet circuit labeled with provider name and circuit ID. Each access point is drawn once with its switch port noted. Deliberately omitted: all desktops, phones, and printers — sixty-odd endpoints that would have turned one readable page into wallpaper. Date and author bottom-right.
The logical view (one page) has five VLAN boxes — Management (VLAN 1, 10.0.1.0/24), Staff (VLAN 10, 10.0.10.0/24), Servers (VLAN 20, 10.0.20.0/24), Guest Wi-Fi (VLAN 30, 10.0.30.0/24), and Warehouse devices (VLAN 40, 10.0.40.0/24). The firewall is drawn in the middle as the router between them. Arrows note the intended rules in plain words: "Staff → Servers: allowed," "Guest → internal: blocked, internet only." Deliberately omitted: switches and cabling, because this view answers routing questions, and hardware would only blur it. One question mark: an old VLAN 50 still configured on the core switch, purpose unknown — drawn, flagged ?, and on the to-investigate list.
The service view (two pages): one sketch for "File and print," one for "Internet and cloud apps." The file-and-print sketch chains: users → access switch → core switch → file server VM → virtualization host → storage → UPS. The print server is hanging off the same host. Reading it during an outage takes ten seconds: if storage is down, file service is down regardless of how healthy the network looks. The internet sketch chains: everyone → core → firewall → circuit → DNS. A note adds that the phone system rides the same path. That explains why "the internet is slow" and "the phones sound bad" arrive together. Deliberately omitted: any service nobody would page you about at night.
Four pages, each answering one question, each dated. That is a complete, maintainable diagram set for a network this size — and honestly, for networks a good deal larger.
Your diagram standards on one page
Write your own version of this table into your documentation home, and every future diagram — yours or a colleague's — starts from the same rules:
| View | Audience | Must show | Must omit | Update trigger |
|---|---|---|---|---|
| Physical | Whoever is at the rack | Closets, switches, uplinks, circuits, link speeds, date | Desktops, phones, per-endpoint cables | Any cabling or hardware change |
| Logical | Whoever plans rules and routing | VLANs/subnets, routers and firewalls between them, allowed paths | Physical hardware detail, cable runs | Any subnet, VLAN, or rule-intent change |
| Service | Whoever is triaging an outage | Dependency chain per critical service, shared single points of failure | Services nobody would page about | Any dependency change; after incidents |
Where to go next
Three small views, drawn honestly and kept true by hooks and a quarterly reconcile, will outperform any single masterpiece. Diagrams are one document of a deliberately small set. Minimum Viable Network Documentation shows the whole kit. The reconcile habit gets much cheaper once discovery draws the as-built map for you. That is exactly where Auto-Generated Topology Maps: Promise and Reality picks up. The rest of the Network Documentation & Topology Mapping pillar covers the physical labels and the succession test that complete the picture.
Put this into practice with SysPeep Monitor
The reconcile step gets a lot easier when the as-built map draws itself. SysPeep Monitor auto-discovers your devices and interfaces and renders network maps from what it finds. It shows live status on the same web console. That gives you a current picture to check your drawings against, and a map that never forgets to update itself. The free trial runs on any Windows machine.
Download Free TrialLearn About SysPeep - All Rights Reserved.