
What Should You Actually Monitor? The First 10 Checks for Any Small Network
Somebody has just handed you a network. Maybe you are the new junior admin. Maybe you fixed the printer once and have been "the IT person" ever since. Either way, someone has told you that you should be monitoring it. That advice is correct and completely unhelpful, because nobody tells you what to monitor. A modern monitoring tool will happily let you watch ten thousand different numbers, and it will look pleased with itself while you do. Watching all of them is the same as watching none of them.
Here is what I wish someone had sat down and told me in my first week. A small set of well-chosen checks catches most of the problems that matter. The other nine thousand nine hundred and ninety numbers can wait. This guide walks you through the ten checks to set up first on any small or mid-size network, in priority order. For each one you will learn what to check, why it matters, and a sensible starting alert threshold you can tune later. You can set up all ten in an afternoon.
In this guide
- Why you should start small
- The 10 checks, in priority order
- A quick-reference threshold table
- What not to monitor yet
- Where to go next
The three ways checks actually work
Before the list, it helps to know that nearly every check below uses one of three simple methods. These are the three questions a monitoring system knows how to ask. The first is the ping: a tiny "are you there?" message any device will answer if it is alive. It proves reachability and measures response time, but nothing more — a server can answer pings while every service on it is on fire. The second is SNMP (Simple Network Management Protocol), the standard way to ask a network device about its internals: port status, traffic counts, CPU, temperature. Almost every business-grade switch, firewall, printer, and UPS speaks it. The third is the host-level query or agent — asking an operating system directly about itself. On Windows, this typically uses WMI, Windows Management Instrumentation, or a small installed agent. An agent is a helper program that runs on the machine and answers questions about it. Host-level queries or agents are how you learn about disk space, services, and memory.
That is genuinely most of the theory. A monitoring system is a machine that asks these three kinds of questions over and over, remembers the answers, and shouts when an answer changes for the worse. The rest of the brochure is upholstery. Every check below tells you which method it uses, so as you configure them you will also be learning the toolbox.
Why start small?
There are two ways monitoring projects fail. The first is never starting, because the tool looks overwhelming. The second is more sneaky: monitoring everything, getting fifty alert emails a day, learning to ignore them, and then missing the one alert that mattered. Admins call this alert fatigue — the state where alerts arrive so often that you stop reading them. Alert fatigue is the single most common way a monitoring system quietly dies.
Starting with ten checks avoids both failures. Ten is small enough to configure carefully, small enough that every alert still means something, and large enough to cover the things that actually take a small network down. Once these ten are stable and trusted, growing to fifty or five hundred checks is easy. At that point, you will add them gradually, with baselines (a record of what "normal" looks like for each number) to compare against.
Harbourview Clinic bought a monitoring tool and, on the first afternoon, pointed it at every device the discovery scan could find. By the following Monday there were three hundred and eighty checks and an inbox receiving roughly one alert a minute. So the admin did what anyone would do and wrote a mail rule that filed them in a folder. Six weeks later the backup server's disk filled, the nightly job began failing, and its alert went into the folder with the others. They found out on the morning a receptionist deleted the wrong shared folder, which is the traditional morning for finding out. The rebuilt system has eleven checks, and every one of them goes to a phone.
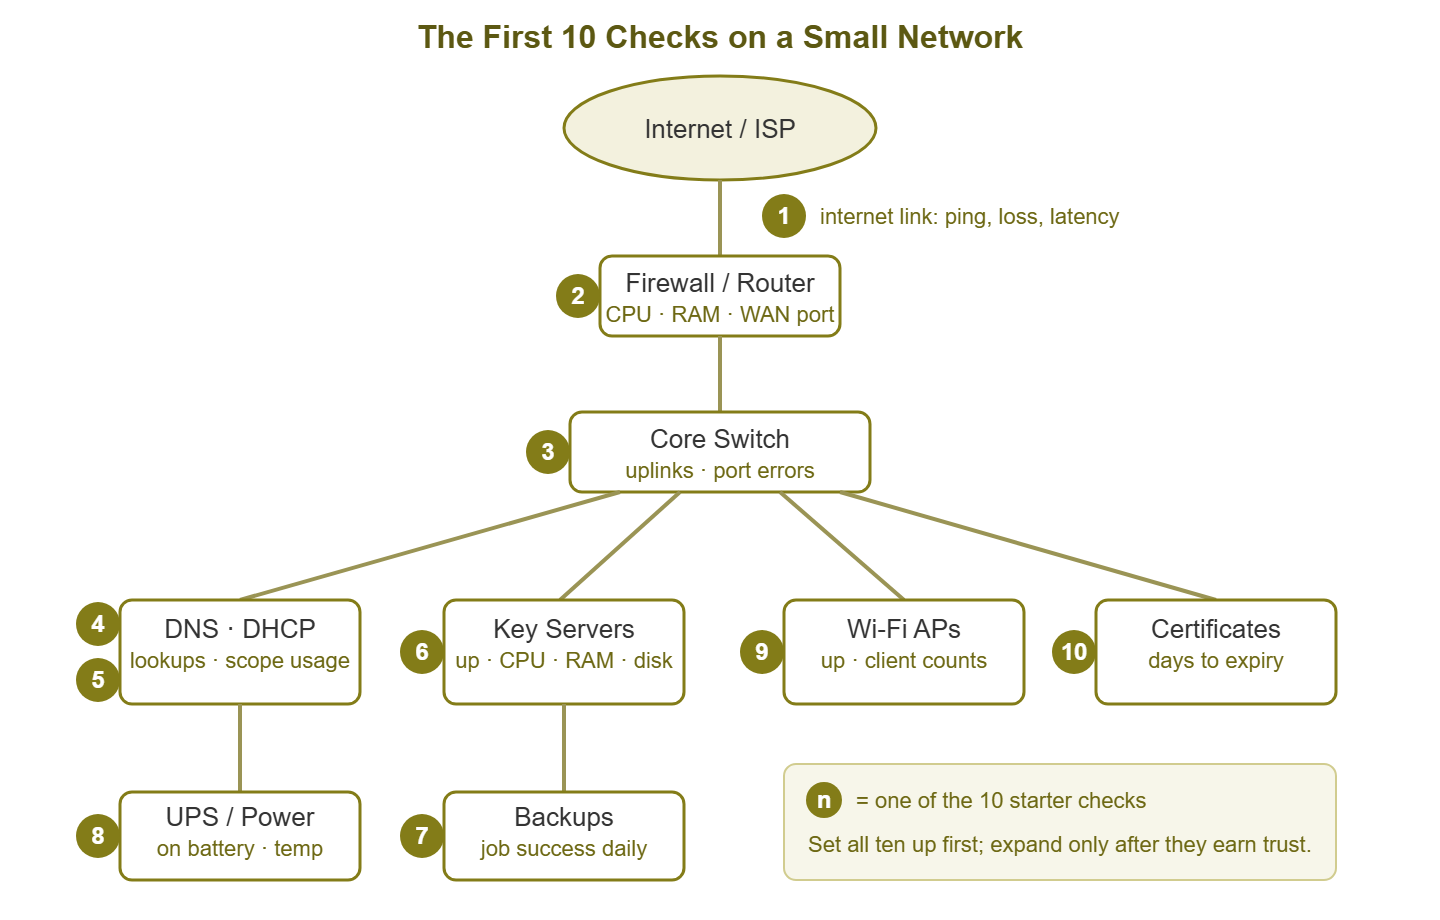
Figure 1: The ten checkpoints on a typical small network. Most outages that users notice start at one of these spots.
Check 1: The internet connection
What to check: that your internet link is up, and how much delay (latency) and data loss (packet loss) it has. The standard way is to send a small test message called a ping every minute to a reliable outside address and record the response time. For example, use the gateway of your ISP (internet service provider, the company you pay for the link) and a public service such as 1.1.1.1.
Why it matters: when the internet goes down, everything modern goes with it: cloud apps, email, phones, video calls. It is also the failure users report first and loudest. Monitoring it yourself means you know about the outage before the complaints arrive. You can tell the difference between "our link is down" and "one website is having a bad day." Over time, the recorded response times also become evidence when you need to hold your ISP accountable. (Their graph will show a different picture. Bring yours.)
Starting thresholds: alert if 3 pings in a row fail (the link is probably down). Warn if response time stays above 100 ms to a nearby target, or if more than 2% of pings are lost over 10 minutes.
Check 2: The firewall or router
What to check: that the device itself is reachable, plus its CPU load, memory use, and the status of its WAN and LAN ports. The WAN port faces the internet; the LAN ports face your office. Most business firewalls can report these numbers over SNMP — the standard question-and-answer protocol that monitoring tools use to ask devices how they are feeling.
Why it matters: every packet between your network and the world passes through this one box. If it reboots, hangs, or runs out of CPU during busy hours, the whole office feels it. A firewall running at 95% CPU is also an early warning. Something changed — maybe a misbehaving device, maybe an attack. It is much nicer to investigate that on Tuesday afternoon than during Thursday's outage.
Starting thresholds: alert if the device stops responding for 2 minutes. Warn at 80% CPU or memory sustained for 10 minutes, and alert on any WAN port going down.
Check 3: The core switch
What to check: check reachability of your main switch (the one everything else plugs into). Check the up/down status of its important ports — uplinks to other switches, ports feeding servers and access points — and the error counters on those ports.
Why it matters: a dead core switch is a total outage, but the sneakier problem is a sick port. A damaged cable or a failing transceiver produces a rising count of errors while technically staying "up." A transceiver is the small plug-in module that turns a fibre or copper link into a switch port. Users experience that fault as mysterious slowness that comes and goes. (It goes whenever you walk over to look at it.) Port error counters are how you catch it in minutes instead of weeks.
Starting thresholds: alert if the switch is unreachable for 2 minutes or an uplink port goes down. Warn if any monitored port shows a growing error count — more than a handful of new errors per hour is worth a look.
Check 4: DNS
What to check: that your DNS servers answer name lookups, and how quickly. A good check actually resolves a real name — something like "look up www.example.com against server 10.0.0.5 and confirm an answer arrives within one second." Check every internal DNS server separately. And check that an outside name and an inside name both resolve. For example, use the name of your domain controller, the Windows server that handles everyone's logins.
Why it matters: DNS is the phone book of your network — it turns names like mail.company.com into addresses computers can reach. When DNS breaks, users say "the internet is down" even though the internet is fine; nothing can be found. DNS failures are also famously confusing to troubleshoot from scratch, which is why admins joke that "it's always DNS." A direct DNS check turns an hour of confusion into a ten-second diagnosis.
Starting thresholds: alert if any DNS server fails to answer for 2 checks in a row. Warn if lookups take longer than 500 ms.
Check 5: DHCP
What to check: check that your DHCP server is running and still has addresses left to give. That is the service that hands out IP addresses to every device that joins the network. The second part is the one everyone forgets: monitor how full each address pool (called a scope) is.
Why it matters: when DHCP fails or a scope runs out of addresses, the network looks fine on every graph. In that case, new devices cannot join, and existing ones drop off one by one as their leases expire. A lease is the fixed period a device is allowed to keep the address it was given. That failure is a slow-motion outage that generates baffling tickets ("my laptop works but Sarah's doesn't"). Scope exhaustion happens in real life more than you would expect. A visitor event, a batch of new phones, or a misbehaving device grabbing addresses can empty a pool in an afternoon.
Starting thresholds: alert if the DHCP service stops. Warn when any scope passes 80% used; alert at 95%.
Check 6: The servers everyone touches
What to check: identify each server that would generate an immediate flood of complaints if it vanished. Typically, that means your domain controller, file server, and main application or database server. For each one, monitor four things: is it up, is its CPU sane, is its memory sane, and how much disk space is left. On Windows servers these numbers come from the operating system via WMI or an agent; on Linux, via SNMP, SSH, or an agent.
Why it matters: full disks are the most preventable outage in IT. Databases stop, updates fail, and Windows misbehaves in creative ways when drive space runs out. And disks never fill up at a convenient time. Disk-space alerts are pure early warning: you almost always get days of notice if you are watching. If you set up only one thing from this whole guide, set up this one. Then set up the other nine.
Starting thresholds: alert if a server is unreachable for 2 minutes. Warn at 85% disk used, alert at 95%. Warn at 90% memory or 85% CPU sustained for 15 minutes.
Check 7: Backups
What to check: that last night's backup jobs actually succeeded, every single day. Most backup software can send a success/failure report to your monitoring system or at least an email. The important part is that a missing report counts as a failure. Silence is not success.
Why it matters: a backup that has been quietly failing for six weeks is discovered at the worst possible moment — the day you need to restore. Backup failures are almost never dramatic; a job hangs, a disk fills, a password expires, and nobody notices because nobody was told. This check exists to make the failure loud on day one instead of during a crisis. (And once a quarter, actually restore a test file. A backup you have never restored from is a hope, not a backup.)
Starting thresholds: alert on any job failure, and alert if no success report has arrived within the expected window (for example, by 7:00 AM).
Check 8: Power and the UPS
What to check: your UPS (uninterruptible power supply — the battery box your servers plug into) reports a surprising amount over SNMP or USB. It reports whether it is on utility or battery power, how charged the battery is, its estimated runtime, and often the temperature around it. Monitor "on battery" as an event, battery health, and temperature if available.
Why it matters: when the power fails, the UPS buys you minutes. But that is only if its battery is actually healthy, and only if you find out the power failed at all. Brief outages at 2 AM are invisible without monitoring, and each one is a rehearsal for the long one. UPS batteries also age quietly; the monitoring data tells you a battery needs replacing before the outage that proves it. Temperature monitoring, where available, has saved many server closets from failed air conditioning.
Starting thresholds: alert immediately when the UPS switches to battery. Warn when battery health degrades or runtime drops below 10 minutes, and when closet temperature passes 30°C / 86°F.
Check 9: Wi-Fi access points
What to check: that each access point (AP) is up, and roughly how many client devices are connected to each. If you have a Wi-Fi controller, it can usually report all APs from one place.
Why it matters: for many of your users, Wi-Fi is the network. A single dead AP creates a dead zone that produces vague complaints ("the internet is bad in the conference room") rather than clean tickets. The client count matters too. If one AP normally carries 20 clients and today carries 60, its neighbor has probably died and everyone has piled onto the survivor, which now feels slow.
Starting thresholds: alert when any AP goes down for 5 minutes. Warn when client counts on an AP jump far above their normal range.
Check 10: Certificates and expirations
What to check: check the expiry dates of your TLS certificates. TLS is the encryption behind the padlock icon. The certificates are the ones on your websites, mail server, VPN portal, and internal admin pages. Plus, while you are at it, check your domain name renewals. A certificate check connects to each service, reads the certificate, and counts the days remaining.
Why it matters: certificate expiry is the most embarrassing outage in IT, because it was 100% predictable. The expiry date was known the day the certificate was issued; the only failure is that nobody was watching. When one expires, browsers show scary warnings, apps refuse to connect, and it always seems to happen on a weekend. Nearly every admin gets burned by this exactly once — this check is how you make sure it is zero times. Mine was the VPN portal, on the first morning of a long weekend.
Starting thresholds: warn 30 days before expiry, alert at 14 days, and escalate at 7.
The quick-reference table
| # | Check | How | Frequency | Starting alert rule |
|---|---|---|---|---|
| 1 | Internet link | Ping external targets | 1 min | 3 missed pings; >2% loss / 10 min |
| 2 | Firewall / router | Ping + SNMP | 1–5 min | Down 2 min; CPU/RAM >80% for 10 min |
| 3 | Core switch | SNMP port status + errors | 1–5 min | Uplink down; rising port errors |
| 4 | DNS | Real name lookup | 1–5 min | 2 failed lookups; >500 ms answers |
| 5 | DHCP | Service + scope usage | 5–15 min | Service down; scope >80% full |
| 6 | Key servers | Ping + WMI/SNMP/agent | 1–5 min | Down 2 min; disk >85%; RAM >90% |
| 7 | Backups | Job result report | Daily | Any failure; any missing report |
| 8 | UPS / power | SNMP/USB status | 1–5 min | On battery; weak battery; hot closet |
| 9 | Wi-Fi APs | Ping/controller + client counts | 5 min | AP down 5 min; abnormal client jump |
| 10 | Certificates | TLS expiry check | Daily | Warn 30 days, alert 14, escalate 7 |
Tip: when you first turn these on, expect a noisy week. Some thresholds will be wrong for your network — that is normal. Tune each alert until it only fires when you would genuinely want to be interrupted. An alert you routinely ignore is worse than no alert, because it trains you to ignore the next one too.
What not to monitor yet
Discipline about what to leave out is what makes the first ten work. For now, skip per-user bandwidth tracking and every port on every switch. Skip printers (they will still be broken later; monitoring will not change that), test machines, and any metric you would not act on. The test is simple: if this alert fired at 9 AM tomorrow, would you do something? If the honest answer is no, it is not a check — it is future noise. You can add all of these later, once the essential ten have earned your trust and you know what "normal" looks like.
Three questions every new admin asks
How often should the checks run?
Every one to five minutes is the sweet spot for most of the list; the table above gives per-check suggestions. Faster than once a minute rarely helps a small network — you cannot respond faster than you notice anyway — and it loads your devices for nothing. Slower than five minutes starts to miss short outages entirely. Daily is right for slow-moving things like backups and certificate expiry, where checking every minute would just be superstition.
Where should the monitoring system itself live?
Put it on a machine that is boring, stable, and inside the network it watches. A small VM (virtual machine, a computer that runs as software on a bigger one) or a spare box is fine. Two cautions. First, do not put it on a server it is supposed to be monitoring, or one crash takes out both the patient and the doctor. Second, remember the monitoring system is now the thing that notices problems — so if it dies silently, you are blind and do not know it. Even a simple trick helps here: a daily "I am alive" email from the monitoring machine, whose absence tells you something is wrong. Fancier setups exist, but the habit matters more than the mechanism.
What about our cloud apps — email, file sharing, the CRM?
Monitor your side of the road. You cannot see inside a cloud provider's data center, but you can check "can we reach it, and how fast?" from your own network. That is exactly what your users experience. A simple reachability check against each critical cloud service tells you instantly whether a complaint is your internet link (your problem). It tells you if the complaint is the provider (their problem, your communication task), or one user's laptop. That single distinction saves more troubleshooting time than almost anything else on this page.
Where to go next
With these ten checks running, you have real monitoring: the outages that matter most will announce themselves to you before users do. That is the whole job, and ten checks do most of it. The other nine thousand nine hundred and ninety numbers are still in the tool. A few of them will earn a place later, one at a time, once you know what normal looks like. The natural next steps are spreading the rollout over a sensible schedule, learning what the data means, and tuning. The other guides in Network Monitoring Fundamentals pick up exactly there, starting with a week-by-week plan for your first 30 days.
Put this into practice with SysPeep Monitor
Everything in this guide can be set up by hand — or you can let the software do it. SysPeep Monitor discovers the devices on your network automatically. It sets up health checks over SNMP and WMI (including most of the ten above) and alerts you the moment something goes wrong. The free trial takes minutes to install on any Windows machine.
Download Free TrialLearn About SysPeep - All Rights Reserved.