
How the Open-Source Stacks Differ: Four Families in Plain Language
The first time I went looking for an open-source monitoring system I had a spare server, a free weekend, and a results page forty projects long. Each had its own vocabulary: one talked about checks, another about time series. And a third seemed to believe the world was made entirely of switches. By Sunday night I had installed three and understood none.
What I wish someone had told me on the Friday: there are not forty ideas. There are four. Nearly every open-source monitoring project belongs to one of four families, each built around a single idea of what monitoring is. Learn the four and you can open any project's docs and understand its structure in an afternoon. You can predict where it will delight you and where it will make you work.
This guide is the map. It introduces the four families — check-based, all-in-one, network-first, and metrics-first — and explains each in plain words. It gives you the mental model for reading each project's docs. It ends with the honest part: all four can monitor a small network well, and fit matters more than family.
In this guide
- Four families, not forty products
- The check-based family: a scheduler that asks yes-or-no questions
- The all-in-one platform: everything into one database
- The network-first tools: discover it, then graph it
- The metrics-first stack: numbers with labels, pulled on a schedule
- The four families side by side
- Reading each project's docs with the right mental model
- The honest note: fit matters more than family
- Where to go next
Four families, not forty products
Every monitoring system, open-source or otherwise, has the same four parts. A collector gathers facts from devices and servers. Storage keeps those facts so you can look back in time. Alerting decides when a fact is bad enough to interrupt a human. And a user interface (UI) lets people see what is going on. The families differ in which part sits at the center of the design — which idea the whole system is organized around.
The check-based family is organized around state: the central question is "is this thing OK right now?" The all-in-one platform is organized around items. Every collected value is a row in one big database, and everything else is built on top of those rows. The network-first tools are organized around devices: a switch appears, gets discovered, and every port on it gets a graph. The metrics-first stack is organized around queries: numbers with labels are stored as time series. Everything you see or get alerted on is the answer to a query.
These are not tiers of quality. They are different answers to the question "what is the atom of monitoring?" — a state, an item, a device, or a time series. (You are allowed to change your answer after the first outage.)
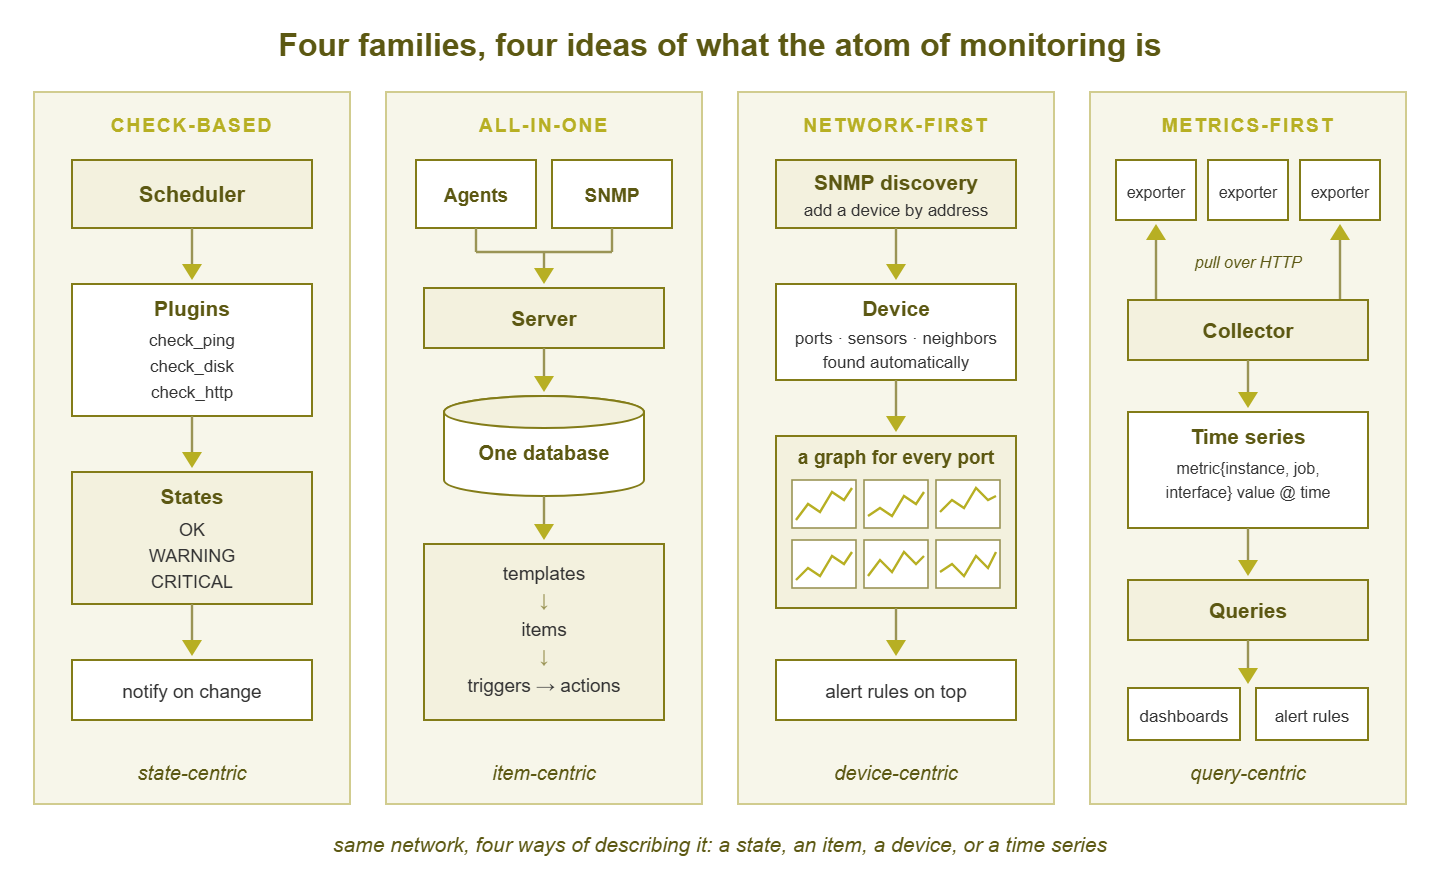
Figure 1: The same network, described four ways. Each family puts a different thing at the center: a state, an item, a device, or a time series.
The check-based family: a scheduler that asks yes-or-no questions
The oldest idea is the simplest to explain. Imagine a diligent colleague with a clipboard. Every few minutes they walk down a list of questions. "Is the mail server answering?" "Is the disk on the file server below ninety percent?" "Does the website return a page?" Next to each question they write one of a handful of words: OK, WARNING, CRITICAL, or UNKNOWN. When an answer changes from OK to something worse, they tell somebody.
That is the check-based family, whose ancestor is Nagios and whose descendants include Icinga and a number of other forks and reimplementations. The clipboard is the scheduler. Each question is a check, and each check is answered by a plugin. A plugin is a small, separate program that does one job. It prints one line of text and exits with a code that means OK, WARNING, CRITICAL, or UNKNOWN. The scheduler cannot ping anything or read a disk itself; it only runs plugins on time and records what they say.
In the four-part vocabulary: the collector is the scheduler plus the plugins. Storage is mostly about state — the current state of every check and a log of state changes. Performance numbers are traditionally handed to a separate graphing component rather than being the point of the system. Alerting is built in and mature: notifications fire on state changes, with concepts for escalation, acknowledgement, scheduled downtime, and dependencies between hosts. Those dependencies mean one dead router does not generate a hundred alerts for everything behind it. The UI is a status board: a list of hosts and services, color-coded by state.
What this family optimizes for is predictability and reach. Any question you can answer with a script becomes a check, which is why this family can monitor almost anything. Mine include one written at two in the morning that I have never dared reread. The mental model to read its docs with: everything is a host or a service, everything has a state. And the whole system exists to notice state changes and route them to people. The Nagios family tour goes deeper.
The all-in-one platform: everything into one database
The second idea says: stop treating status and numbers as different things. Collect everything — CPU percentages, port counters, service reachability, log lines. Store every value in one relational database. And build the rest of the system on top of that single store. This is the all-in-one platform, represented in the open-source world by Zabbix.
The building block is the item: one thing to collect from one host, on a schedule. Items come from agents installed on servers, from SNMP for network gear, or from agentless methods for things that cannot run an agent. Items are grouped into templates, reusable bundles. Link a "generic switch" template to a new device and it immediately gets the items, graphs, and alert conditions every switch should have. On top of items sit triggers, which are expressions over item values ("CPU above ninety percent for five minutes"). On top of triggers sit actions, which say what to do when a trigger fires.
In the four-part vocabulary: the collector is a central server plus agents, SNMP polling, and optional proxies. The proxies collect on behalf of the server at remote sites. Storage is one relational database holding configuration, collected history, and long-term summaries alike. Alerting is triggers plus actions, with escalation steps and recovery messages. The UI is one web application for configuration, graphs, dashboards, maps, and the problem list.
What this family optimizes for is breadth in one install: servers, network devices, applications, and virtual machines all under one roof. They share one vocabulary and one set of templates. The catch is that the vocabulary is large, and that the database becomes the thing you must care for as the system grows. The mental model to read its docs with: everything is an item, items live in templates, triggers watch items, actions respond to triggers. The Zabbix tour walks through it.
The network-first tools: discover it, then graph it
The third idea comes from network administrators, and it starts from a frustration. A switch has dozens of ports; a campus has dozens of switches. Defining a check for every port by hand is not a job, it is a punishment. So this family says: point the system at a device, let it discover what the device has, and graph all of it automatically. The lineage here runs through Cacti, an earlier tool built around SNMP polling and per-port graphs. And the idea is carried forward today by LibreNMS.
The atom is the device. You add a device by address and credentials. The system talks SNMP to it and learns what kind of device it is. It enumerates its interfaces, sensors, and other properties, and starts polling every one of them. Within a polling cycle or two, every port has a traffic graph and every temperature sensor has a line. Alert rules are layered on top ("any port that is administratively up but operationally down"). Syslog or flow collection can be added so that logs and traffic conversations land next to the graphs.
In the four-part vocabulary: the collector is a discovery process plus a poller, both speaking SNMP first and other protocols second. Storage is a relational database for inventory and configuration plus fixed-size time-series files for the graphs. This design is inherited from the round-robin database tradition, in which old data is averaged down rather than deleted. Alerting is rules evaluated against the inventory and the latest polled values. The UI is device-centric: a device list, a device page, a port page, with graphs everywhere.
What this family optimizes for is time-to-graphs for network gear. If your world is switches, routers, firewalls, and access points, few things get you to useful faster. The mental model to read its docs with: devices are discovered, and discovery produces ports and sensors. Ports and sensors get polled, polling produces graphs, and rules watch the results. The LibreNMS tour has the details.
The metrics-first stack: numbers with labels, pulled on a schedule
The fourth idea grew up with servers, containers, and cloud services rather than with switches, and it turns collection inside out. Instead of a central server deciding what to ask, every monitored thing exposes a page of numbers over HTTP. There are hundreds of them, each with a name and a set of labels such as instance, job, or interface. A collector visits each page on a schedule, pulls the numbers, and stores them as time series. This is the metrics-first stack: Prometheus for collection, storage, and alerting rules, and Grafana for visualization.
The pages of numbers are served by exporters: small programs that translate one kind of system into the metrics format. There are exporters for operating systems, databases, and web servers. There is also — important for us — the concept of an exporter that speaks SNMP on one side and metrics on the other. That lets network devices join the party. The atom is the time series: one named metric with one particular combination of labels, with a value recorded at every collection.
In the four-part vocabulary: the collector is the pull-based scraper. Storage is a purpose-built time-series database with labels as the indexing scheme. Alerting is a set of rules written in the query language, evaluated continuously. Their results are handed to a separate alert router that groups, silences, and dispatches notifications. The UI is mostly Grafana, a separate project that can draw dashboards from Prometheus and from many other sources. You assemble those dashboards yourself panel by panel.
What this family optimizes for is flexibility and scale. Because every question is a query over labeled numbers, unanticipated questions are easy to ask. The catch is that the system arrives as parts, not a finished product. Dashboards, alert rules, and the meaning of "healthy" are yours to define. The blank page is generous; it takes two hundred panels without complaint. The mental model to read its docs with: exporters expose, the server scrapes, series get labels, queries answer questions, and everything you see is a query. The Prometheus and Grafana tour covers the rest.
The four families side by side
| Family | Representative projects | The central idea | Where it is strongest | Where the learning effort goes |
|---|---|---|---|---|
| Check-based | Nagios, Icinga, and related forks | A scheduler runs small plugins that return a state; the system watches state changes | Monitoring anything you can script; predictable, well-understood alerting behavior | Configuration discipline; modeling hosts, services, and dependencies by hand |
| All-in-one | Zabbix | Agents and SNMP feed items into one database; templates bundle items, triggers, and graphs | Servers, network, and applications in one install with shared templates | A large vocabulary of concepts; database care as history grows |
| Network-first | LibreNMS, with heritage from Cacti | SNMP discovery finds devices and ports; every port and sensor gets a graph automatically | Fast, thorough visibility into network gear with little manual definition | Gentle for network administrators; SNMP knowledge pays off directly |
| Metrics-first | Prometheus and Grafana | Exporters expose labeled numbers; a scraper pulls them; everything is a query | Flexible questions at scale; servers, containers, and cloud services | A query language to learn; dashboards and alerts built from scratch |
Read the last column carefully. It does not say which family is "hardest"; it says where the effort goes. Every family asks for effort in a different currency, and you probably already hold more of one currency than the others.
Reading each project's docs with the right mental model
Translate a project's vocabulary into the four-part model before you follow its instructions. Projects use different words for similar things, and the differences hide that they are solving the same problems. The table below is a rough phrasebook. Treat the terms as approximate; projects rename things, so check each project's current documentation for its own glossary.
| You want to say... | Check-based | All-in-one | Network-first | Metrics-first |
|---|---|---|---|---|
| "The thing I monitor" | A host and its services | A host | A device | A target belonging to a job |
| "One collected fact" | A check result | An item value | A polled port or sensor value | A sample in a time series |
| "The condition that means trouble" | A check returning WARNING or CRITICAL | A trigger expression | An alert rule | An alerting rule written as a query |
| "A reusable bundle of settings" | Object templates in configuration files | A template | Device definitions, mostly built in and community-maintained | Rule files and dashboards you share or import |
| "Who gets told, and how" | Contacts, notification commands, escalations | Actions and media types | Alert transports | The alert router's routes and receivers |
With the phrasebook in hand, approach any project's documentation in this order:
- Find the atom first. Look for the concept page that defines the basic unit — service, item, device, or time series. Everything else hangs off it.
- Then find the reusable bundle. Templates, object inheritance, device definitions, or shared rule files. This is how the project avoids making you define the same thing a hundred times. And it is where most of your day-to-day work will live.
- Then find the alert path. Trace one bad value from collection to a notification in your inbox. If you can narrate that path in your own words, you understand the project well enough to run it.
- Only then read the install guide. A working system you cannot explain is the one that pages you at three in the morning for reasons you cannot fix.
Tip: the four families overlap more than their communities admit. Check-based tools have grown graphing, all-in-one platforms discovery, network-first tools alerting, and metrics-first stacks SNMP support. The family tells you what a project is best at and what its docs assume, not the only thing it can do.
The honest note: fit matters more than family
Picture a small network: a few switches, a firewall, a handful of servers, a couple of dozen important services. It can be monitored well by any of the four families. All of them can ping a host, read interface status and traffic counters over SNMP, and watch CPU and disk on a server. They can check that a website returns a page and email you when something goes wrong. For the basics in the network monitoring fundamentals guides, there is no wrong family.
What differs is how natural each job feels, how much you build yourself, and how well the project's assumptions match your team. That is fit, and it is decided by questions about you, not the software:
- What does your team already know? Comfortable writing shell scripts? The check-based family will feel like home. Comfortable with databases? The all-in-one platform will make sense quickly. A network team that lives in switch consoles? Network-first. A team that runs containers and reads dashboards all day? Metrics-first.
- What is the shape of your estate? Mostly network gear: network-first shines. Mostly servers and applications: check-based or all-in-one. Mostly containers, cloud services, and things that come and go: metrics-first. An even mix: all-in-one, or two families working together.
- How much do you want to build? Some families hand you a finished product with opinions; others hand you excellent parts and a blank page. Be honest about how much blank page your week can absorb.
- Who will run it after you? Pick the family whose mental model your colleagues can pick up, not the one that impressed you most in a demo.
- What will you do when you outgrow it? Every family has a growth path and a point where growth means real work. Read the scaling section of the docs before you commit; the scaling monitoring guides cover the general shape of that problem.
At Meridian Parts a metrics-first stack went in one Saturday as an evaluation, on a spare machine called test-mon.example.com. It was the only screen showing the warehouse link, so by Wednesday the warehouse manager was refreshing it. By month end it was paging the on-call phone. Nobody had asked the fit questions; nobody had decided anything. The handover document was the evaluation notes, which opened with "do not rely on this".
Running two families side by side is normal and often sensible. A network-first tool for the switches and a metrics-first stack for the servers is a reasonable pairing. The risk is not two tools. It is two tools nobody has agreed how to divide, so that both alert on the same outage or neither does. The monitoring tool sprawl guides discuss keeping that tidy.
The same four ideas appear inside commercial products too, sometimes several at once. If you are deciding between building on an open-source stack and buying something finished, the open-source versus commercial guides lay out the tradeoffs. The monitoring on a budget guides are for when budget decides.
Where to go next
That is the map. Four families, four atoms: the check-based family watches states, and the all-in-one platform collects items. The network-first tools discover devices, and the metrics-first stack answers queries over labeled time series. Read a project's documentation with the right atom in mind and a confusing manual becomes a predictable one. It fits on an index card; read it on the Friday, not the Sunday.
The rest of the Guided Tour of the Open-Source Monitoring Stacks visits each family in turn. Those are the Nagios family, Zabbix (all-in-one), LibreNMS (network-first), and Prometheus with Grafana (metrics-first). Each tour ends with where the project fits and what to check in its current documentation. That lets you choose as an engineer rather than as a fan.
Put this into practice with SysPeep Monitor
If you are weighing these four families, it is fair to put a commercial option on the same shortlist and judge it by the same questions. SysPeep Monitor is one such option: a Windows service that auto-discovers devices and collects over SNMP, WMI, and SSH. It keeps alerting, maps, and dashboards in one web console. Evaluate it exactly as you would evaluate any of the stacks above. The free trial installs in minutes, and fit is the only thing that matters.
Download Free TrialLearn About SysPeep - All Rights Reserved.