
Reading Traceroute Like a Professional
Traceroute is the tool everyone runs and almost everyone misreads. It looks self-explanatory — a numbered list of routers with times next to them — and that friendly appearance is exactly the trap. The internet is full of tickets, forum posts, and escalations built on a traceroute that was read wrong. The supposed findings include a "down" router that was fine, a "slow" hop that was lazy, or a "broken" destination that was merely private.
The cure is understanding two things: the slightly absurd trick the tool is built on, and the short catalog of misreads that trick produces. This guide covers both, with realistic output for each misread and the correct professional reading. By the end, you will interpret a trace the way a network engineer does. You will know the one rule that separates signal from noise in almost every case.
In this guide
- How traceroute actually works: orchestrated failure
- ICMP or UDP: why the flavor sometimes matters
- The misread catalog: six traps, six correct readings
- Where the jumps should be: reading against a baseline
- When traceroute becomes evidence
- A healthy trace and a suspicious one, annotated
- The misread table: a pocket reference
How traceroute actually works: orchestrated failure
Every IP packet carries a TTL (Time To Live) — a hop counter. Each router that forwards the packet subtracts one. The router that decrements it to zero throws the packet away and sends back an ICMP "time exceeded" complaint. The complaint's source address is the identity of the router that gave up. This exists to stop lost packets circling the internet forever.
Traceroute weaponizes it. Send a probe with TTL set to 1: the first router kills it and complains, revealing itself. Send another with TTL 2: the second router does the same. TTL 3, TTL 4… each deliberate failure names one more waypoint, until a probe finally survives all the way and the destination itself answers. A traceroute is not a map the network handed you — it is a pile of complaints you provoked, arranged by distance. By default, most versions send three probes per TTL, which is why each line shows three times:
C:\> tracert -d 203.0.113.80

Tracing route to 203.0.113.80 over a maximum of 30 hops

  1    <1 ms    <1 ms    <1 ms  192.168.1.1
  2    12 ms    11 ms    14 ms  100.64.0.1
  3    13 ms    12 ms    13 ms  198.51.100.17
  4    31 ms    30 ms    32 ms  198.51.100.62
  5    31 ms    31 ms    30 ms  203.0.113.80

Trace complete.
Each row shows the TTL used, three round-trip times for the three probes, and the router that complained. The -d flag skips name lookups, which makes traces faster and less cluttered. Unix uses -n for the same thing. The three times routinely differ a little — each probe is its own small adventure through queues. The trace stops when the destination answers or when it hits the default ceiling of 30 hops.
Understanding the trick explains the tool's quirks before you ever meet them. The routers in your list are not reporting anything; they are being tricked into confessing their existence, one at a time. Whether a given router confesses promptly, slowly, or not at all is entirely its own business. That single fact, as you are about to see, is behind most of the ways people misread the output.
ICMP or UDP: why the flavor sometimes matters
Here is a difference that occasionally decides whether a trace works at all. Windows tracert sends ICMP echo probes — pings with shrinking lifespans. Unix traceroute defaults to UDP probes aimed at deliberately unlikely high ports; the destination announces arrival by complaining "port unreachable." Same TTL trick, different wrapping.
Middle routers rarely care about the wrapping — they never inspect it, they just kill expired packets and complain. The ends care. Firewalls commonly allow one flavor and drop the other. So the same path can complete under tracert and end in stars under Unix traceroute, or vice versa. When a trace dies at the end, trying the other flavor is the first move. On Linux, traceroute -I host switches to ICMP. The command traceroute -T -p 443 host sends TCP probes to the web port. These probes are shaped like real application traffic, which firewalls treat most kindly of all.
The flavor also matters for a subtler reason. Some networks filter UDP aimed at odd high ports anywhere along the way. That can turn the middle of a Unix trace into stars while a Windows trace of the same path looks fine. If two flavors disagree, neither is lying — they are being treated differently, which is itself a finding worth writing down.
The misread catalog
Now the payoff. Six patterns account for nearly every wrong conclusion ever drawn from a traceroute. For each: the output, the reflex misread, and the professional reading.
Misread #1: stars in the middle
  5    24 ms    23 ms    24 ms  198.51.100.9
  6     *        *        *     Request timed out.
  7    26 ms    25 ms    26 ms  203.0.113.1
The reflex: "hop 6 is down!" This is the most common traceroute misread on the internet. The logic disproving it is right there on the screen: hop 7 answered. Hop 7's probes traveled through hop 6 — there is no other way to reach hop 7. So hop 6 is forwarding perfectly. It simply refuses to send "time exceeded" complaints, or rate-limits them, because answering trivia is optional and routers prioritize their actual job. Some routers just do not chat. The rule: stars at a middle hop mean nothing when any later hop answers. Stars only become interesting when everything after them goes dark too — and even then, see misread #4.
Misread #2: a latency spike at one hop
  4    18 ms    17 ms    18 ms  198.51.100.33
  5   214 ms   190 ms   225 ms  198.51.100.62
  6    19 ms    19 ms    20 ms  203.0.113.9
The reflex: "hop 5 is overloaded — found the problem!" But look at hop 6: back to 19 ms. If hop 5 were genuinely adding 200 ms to traffic passing through it, every later hop would inherit that delay. Their probes cross hop 5 too. They did not inherit that delay, so the path through hop 5 is fine.
What you are seeing is the split inside a router. Its forwarding plane is the specialized hardware that moves packets at wire speed. Its control plane is the small management computer that handles housekeeping, including generating your complaints. A busy control plane answers complaints slowly or whenever it feels like it, while the hardware forwards flawlessly. A spike that appears at one hop and vanishes at the next is a router being lazy about paperwork, not slow at its job.
Misread #3: the jump that persists
  7    30 ms    31 ms    30 ms  198.51.100.101
  8   118 ms   119 ms   118 ms  192.0.2.14
  9   119 ms   121 ms   120 ms  192.0.2.77
 10   121 ms   120 ms   122 ms  203.0.113.80
This is the opposite case, and the core reading skill of the entire tool. Latency that jumps at hop 8 and stays elevated through every later hop is real. Everything downstream inherits it because every later probe crosses the same link. Call it the persist rule: a number that appears at one hop only is noise; a number that persists to the end is signal. Here, something between hop 7 and hop 8 added roughly 90 ms to the journey.
Two honest explanations, and telling them apart is the follow-up skill. Distance: the probes crossed an ocean or a continent — long-haul links legitimately add tens of milliseconds, constantly, at every hour, with tight spreads. Congestion: the link is full. The jump breathes with time of day, and the three per-hop times spread wide as probes wait in a swelling queue. Run the same trace at a quiet hour and at the busy hour. A step that never moves is geography. A step that grows at 3 p.m. is a queue, and a queue is actionable.
Misread #4: the dark final hops
 11    88 ms    87 ms    88 ms  192.0.2.190
 12     *        *        *     Request timed out.
 13     *        *        *     Request timed out.
      (repeats until the 30-hop limit)
The reflex: "the site is down." Often the truth is: the destination's firewall silently drops probe traffic, while the services behind it hum along happily. Plenty of well-run networks do exactly this on purpose. The trace still told you something useful: the path was healthy as far as the last network that answers. But the verdict on the destination belongs to a check of the actual service. Open the site, or test the specific port. That family of checks has its own guide: beyond ICMP.
Misread #5: believing you can see the return path
This one is the mind-bender, so it gets a picture. Traceroute maps the outbound road only — the sequence of routers your probes cross on the way out. But every time printed on the screen is a round trip: probe out to hop N, complaint back from hop N. The complaint's route home is chosen by the distant network, is frequently different from your outbound road, and is completely invisible in your output. On the internet, this asymmetry is routine — each network hands traffic off however suits it.
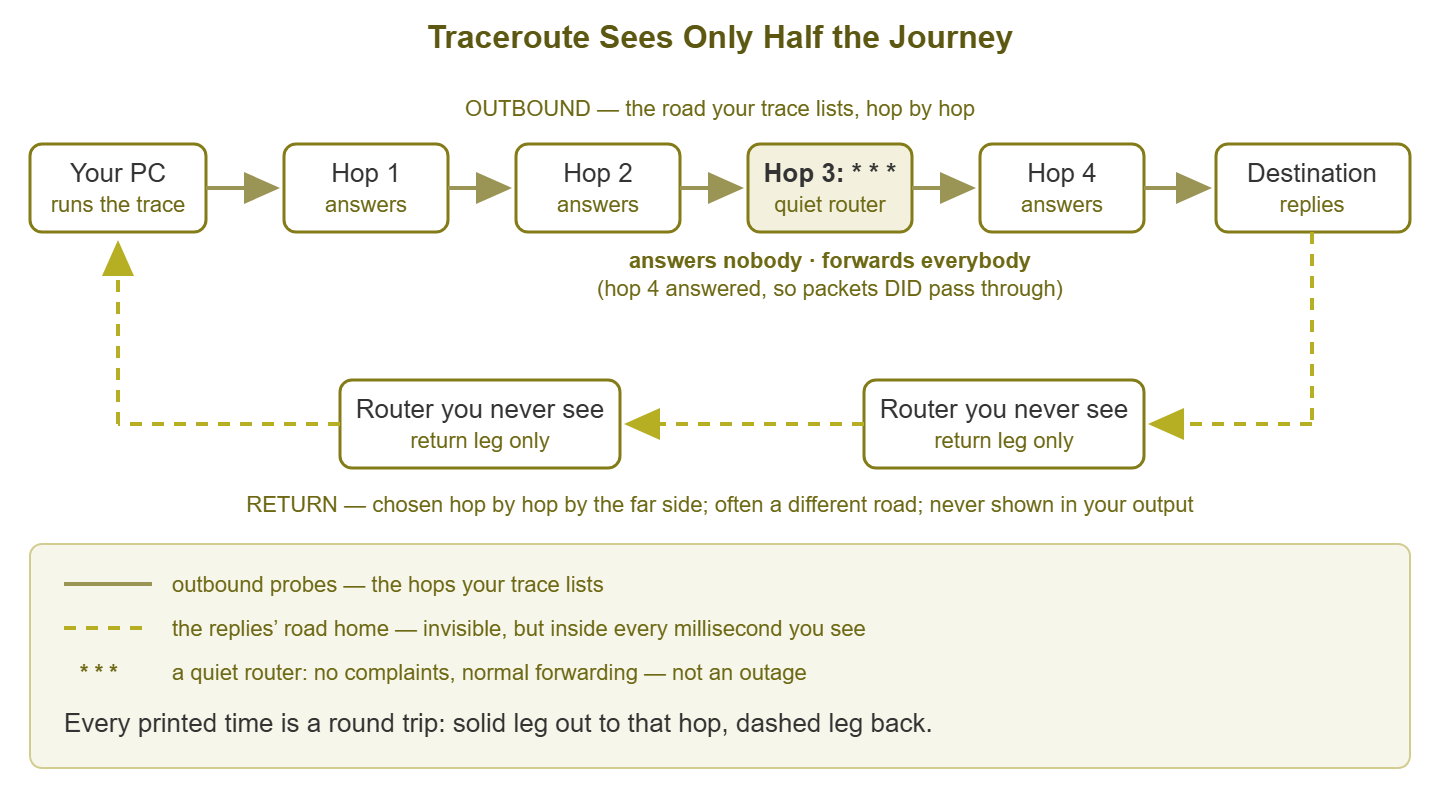
Figure 1: Traceroute maps the outbound road only. Every printed time secretly includes a return trip along roads you cannot see. The quiet hop that answers * * * is still forwarding everything.
Two practical consequences. First, hop 5 can honestly show a higher time than hop 6, because hop 5's complaints take a scenic route home that hop 6's do not. Mildly non-monotonic times are normal noise, not sorcery. Second, when a path problem lives in the return direction, your outbound trace looks clean while every RTT quietly suffers. The fix is a trace from the far side: when you escalate to a provider, ask them to trace back toward you. Good NOCs do it as a matter of course.
Misread #6: hops that flap between routers
 6  r1.metro.example.net (198.51.100.9)   24.1 ms
    r2.metro.example.net (198.51.100.13)  24.9 ms   24.3 ms
The reflex: "the route is unstable!" Almost always it is the opposite of a problem. It is ECMP (equal-cost multipath), networks deliberately spreading traffic across parallel links of equal cost. Traceroute's successive probes differ slightly, land on different members of the group, and your trace interleaves two parallel roads into one confusing list. Some tools hold their probe fields constant to stick to a single road — MTR behaves better here, and Paris-traceroute exists precisely for this. Alternating routers with steady times and no loss is a network doing its job. It is only worth attention when the alternatives show very different latency or loss. In that case, it is a load-balanced group with one sick member.
Where the jumps should be: reading against a baseline
A professional reads a trace against an expectation of where latency should appear. A rough map for a typical business connection:
- Hop 1, your own router: under a millisecond or two on a wired LAN. On Wi-Fi, that is a few variable milliseconds. And if hop 1 is already ugly, stop blaming the internet; your problem is in the building.
- The first ISP hop: the jump from your router to the provider's equipment is the signature of your access technology — often somewhere in the handful-to-tens of milliseconds. Learn what yours normally shows.
- Metro and regional hops: small increments, a few milliseconds each, as traffic crosses the provider's city and regional network.
- Long-haul hops: the big honest jumps. Light in fiber covers roughly 100 km per millisecond of round trip. So crossing a continent or an ocean legitimately adds tens of milliseconds in one step. That step persists, matching misread #3's rule, but is entirely healthy.
Put together, a healthy trace has a recognizable shape. It is a staircase that climbs in small, explainable steps, with at most one or two big honest risers where the geography lives. A jump is suspicious when no geography justifies it (a 90 ms step between two routers in the same city) or when a normally small step balloons at busy hours. Knowing your normal numbers is the whole game. The companion guide on expected latency baselines gives you the reference figures and the habit of capturing your own.
When traceroute becomes evidence
Traceroute earns a place in an ISP escalation when it documents a change. A single trace proves little; a pair proves a lot: the path during good times and the path during the problem, captured the same way. The habits that make a trace credible:
- Capture a baseline trace to your important destinations now, while things work, and keep it. Future you will be grateful.
- Save plain text, not screenshots, with a timestamp and time zone noted. Capture both a numeric run (
-d/-n) and a named one — names help humans, addresses are the ground truth. - Run it a handful of times, politely spaced. Traceroute leans on rate-limited ICMP; hammering it manufactures stars and poisons your own evidence.
- If you can, capture from two vantage points — the office and a home or mobile connection. One sick path and one healthy one isolates the problem beautifully.
- Say in the ticket that you know the trace shows the outbound path only, and ask for a reverse trace. That sentence alone moves you out of the form-letter queue.
The narrative that gets action reads like this: "Baseline attached — hop 2 normally answers around 14 ms. Since this morning, hop 2 shows 200+ ms and the increase persists to the destination; trace from a mobile connection is clean. Reverse trace requested." Four sentences, two captures, one obvious conclusion. Notice it applies the persist rule, names the suspect link, and rules out your own LAN before anyone asks.
Tip: for anything involving loss percentages, graduate from three probes per hop to hundreds. That is MTR, the statistical version of this tool, covered next in this pillar. Traces show the path; MTR proves the pattern.
A healthy trace and a suspicious one, annotated
Two traces to the same destination. First, healthy:
  1    <1 ms   <1 ms   192.168.1.1    <- your router: instant
  2    14 ms   13 ms   100.64.0.1     <- first ISP hop: normal access jump
  3    15 ms   15 ms   198.51.100.17  <- metro: small steps
  4     *      16 ms   198.51.100.62  <- one lost probe: rate limiting, fine
  5    84 ms   83 ms   192.0.2.14     <- long-haul jump, persists: distance
  6    85 ms   84 ms   203.0.113.80   <- destination: the sum adds up
Every feature here — the odd star, the big step at hop 5 — is ordinary once you know where jumps belong. Now the suspicious one:
  1    <1 ms   <1 ms   192.168.1.1    <- LAN still fine
  2   205 ms  190 ms   100.64.0.1     <- huge jump at the ACCESS hop...
  3   214 ms  208 ms   198.51.100.17  <- ...and every later hop inherits it
  4   216 ms    *      198.51.100.62
  5   290 ms  310 ms   203.0.113.80   <- destination slow AND lossy
The persist rule fingers the link between hop 1 and hop 2 — your access line. Geography offers no excuse for 200 ms to the first provider hop. This is what a saturated uplink or a sick modem looks like: the problem is at your front door. And no amount of tracing beyond hop 2 will find it anywhere else.
The misread table: a pocket reference
| What you see | The reflex misread | The professional reading |
|---|---|---|
* * * mid-path, later hops answer | "That router is down" | Quiet router; forwarding fine, ignore |
| One hop spikes, later hops normal | "That router is overloaded" | Lazy control plane; path fine |
| Jump that persists to the end | "Probably noise" | Real path event — distance or congestion; investigate |
Final hops all * * * | "The site is down" | Probes filtered; test the service itself |
| Hop 5 slower than hop 6 | "The tool is broken" | Different return roads; normal noise |
| Hops alternate between routers | "The route is flapping" | Load-balanced parallel paths; fine unless times diverge |
| Hop 1 already slow or jittery | "The ISP is slow" | Your LAN or Wi-Fi; fix the building first |
Where to go next
The persist rule, the quiet-router rule, and the invisible return path cover most of what separates a professional reading from a panicked one. What traceroute still cannot give you is statistics: three probes per hop is an anecdote. When the question is "how often, how much, and since when," move up to MTR for continuous per-hop numbers. See what ping actually tells you for the round-trip fundamentals underneath all of it. The rest of the family lives in Ping, Traceroute & Friends.
Put this into practice with SysPeep Monitor
Traceroute is for the moment something breaks; monitoring is for knowing when it broke and what it took down. SysPeep Monitor auto-discovers your devices and watches health and performance over SNMP, WMI, and SSH. It uses dependency-aware alert rules so a dead path shows up as one meaningful alert instead of fifty. It offers live maps and dashboards on a single web console. The free trial runs on one Windows machine.
Download Free TrialLearn About SysPeep - All Rights Reserved.