
Multi-WAN Visibility: Monitoring Two Circuits as One Service
At some point somebody decided one internet circuit was not enough. Maybe that was after an outage that cost a very quiet afternoon of explaining things to management. Now your site has two. Two providers, two bills, one comforting promise: if a line dies, work continues. Here is the uncomfortable question this guide is built around: is your second circuit working right now? If you cannot answer from your desk, with evidence, in ten seconds, then you do not have redundancy. You have two circuits and a hope.
The trouble is that redundancy, by design, hides failure. A single-circuit site that loses its line knows immediately — everything stops. A dual-circuit site that loses a line feels nothing at all, which is exactly the point and exactly the problem. Nothing feels different, so nobody looks. The site coasts for weeks one failure away from a real outage. Monitoring two circuits well is not "monitoring one circuit, twice." It is a different discipline with its own traps, and the biggest trap is invisible until the day it costs you.
By the end of this guide you will know the two ways multi-WAN setups run and why it changes what you watch. You will know how to probe each circuit independently so the idle one cannot rot unnoticed. You will know what a dual-WAN dashboard should actually show. And you will know how to design a "redundancy degraded" alert that gets acted on without waking anyone at 3 AM.
In this guide
- Two ways to run two circuits
- The silent-risk problem
- Probing each circuit through its own path
- Dashboards: per-circuit tiles, one service view
- Alert design: redundancy degraded is its own class
- When the backup is smaller
- Trust, but verify the switch
- Where to go next
Two ways to run two circuits
Multi-WAN setups come in two basic flavors, and it is worth knowing which one you have before designing the monitoring, because they fail differently.
Active/standby is the spare-tire model. One circuit — usually the bigger or cheaper-per-bit one — carries all traffic. The second sits idle, costing money and doing nothing, until the router's failover logic decides the primary is dead and swings everything over. The appeal is simplicity: traffic behaves predictably, and there is exactly one switchover event to reason about. The catch is that the standby spends its whole life unused — and unused equipment fails silently, because nothing exercises it. Like a spare tire, it is confidently assumed to be fine right up until the moment on the highway shoulder when it is not.
Load-sharing (often called active/active) puts both circuits to work at once. The router splits traffic between them by policy — perhaps by connection, perhaps by application or destination, perhaps just "voice out A, bulk out B." You get to use the capacity you pay for, and both lines are continuously exercised, which is genuinely healthy. The costs are subtler behavior and messier failure. When one circuit dies, its share of the traffic crowds onto the survivor, which may suddenly be congested. So "we failed over successfully" can still mean a bad afternoon, just a less catastrophic one.
Either way, notice what the business bought: not two circuits, but one service called "the internet works." Your monitoring has to speak both languages — the per-circuit truth for you, and the service-level truth for everyone else. Keep that dual view in mind; the dashboard section comes back to it.
The silent-risk problem
Now the heart of the matter. Draw the three states a dual-WAN site can be in, and look hard at the middle one.
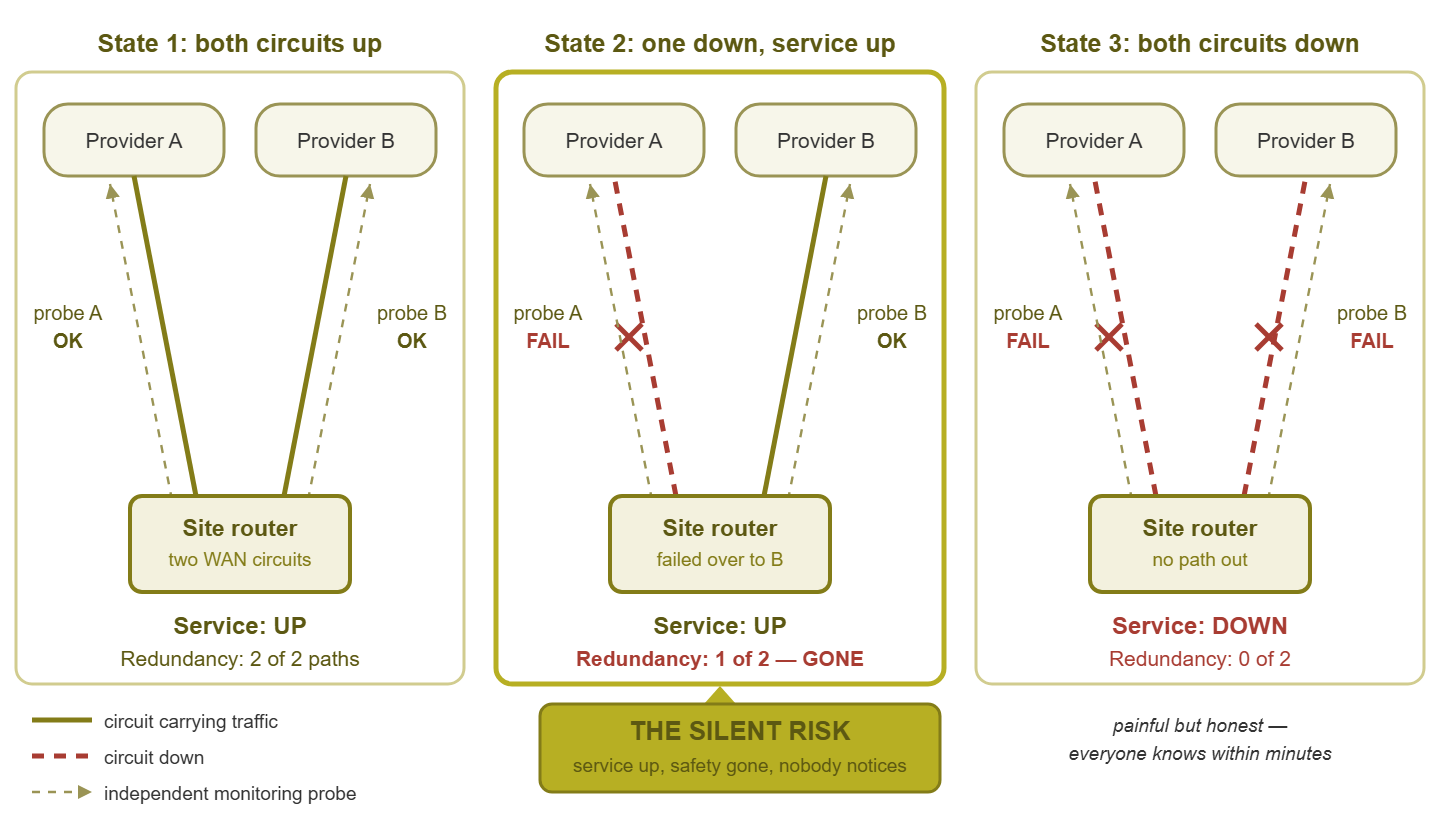
Figure 1: The three states of a dual-WAN site. The middle state feels identical to the healthy one from the inside — which is why it needs its own alert.
State one: both circuits healthy, service up, everyone happy. State three: both circuits dead, service down — painful, but at least honest, because everybody knows within a minute. State two is the sneaky one: a circuit has failed, failover did its job, service hums along… and the site is now standing on one leg. No user notices. No ticket is opened. Unless your monitoring says so explicitly, no admin knows either. The redundancy you budgeted for is gone. And the only remaining question is whether it gets fixed before the second circuit has its own bad day.
Sit with how backwards this is: the better your failover works, the less anyone notices your circuits failing. A perfect failover setup with no monitoring produces sites that quietly decay to single-circuit operation and stay there. The standby is dead for a month, the bill is still being paid, and the risk register still says "redundant." The middle state is not a minor variant of "up." It is its own condition, deserving its own detection, its own alert, and its own repair clock. Everything else in this guide exists to make state two loud.
Probing each circuit through its own path
Here is the trap that catches almost everyone's first dual-WAN monitoring attempt. You add a ping check to some reliable external address. It goes green. And it stays green through every circuit failure you will ever have — because the probe, like all traffic, follows the router's routing table. And the routing table's whole job is to route around dead circuits. Your probe is testing the service, not the circuits. Useful, but it can never see state two: pull the plug on either line and the probe just fails over with everything else, smiling.
To see individual circuits, each probe must be forced out its own door. The generic recipe is the same, whatever your equipment calls it. Give each circuit a probe whose traffic is bound to that circuit's interface, source address, or policy route. The mechanism varies; the idea does not. Aim it at a target only reachable the honest way, such as that provider's own gateway. The result is two independent measurements that keep telling the truth no matter where the user traffic currently flows.
# Pseudo-config: one probe per circuit, each pinned to its own exit
probe icmp name wan-a-gw  target 203.0.113.1   source-interface WAN1  interval 30s
probe icmp name wan-b-gw  target 198.51.100.1  source-interface WAN2  interval 30s

# Optional: a far target per circuit for realism beyond the first hop
probe icmp name wan-a-far target 192.0.2.10    source-interface WAN1  interval 60s
probe icmp name wan-b-far target 192.0.2.10    source-interface WAN2  interval 60s
The near probes (each provider's gateway) answer "is this circuit alive," cleanly and per-line. The far probes send traffic to the same distant target out each circuit separately. That answers a subtler question: "is this circuit a usable path to the world, not just a live wire to my provider?" A circuit can pass the near probe while its provider has trouble further upstream; the far probe catches that. Run both if your gear allows; run at least the near pair regardless.
If your router cannot run probes itself
Plenty of edge devices have no built-in probe feature. The monitoring server sits on the LAN where its pings follow the routing table like everyone else's. There is a tidy workaround. Pick two harmless, distinct external targets — one to represent each circuit. Add two narrow policy rules on the router: "traffic to target X always exits circuit A; traffic to target Y always exits circuit B," with no fallback to the other line. Now your monitoring server pings both targets like any ordinary check, but each ping is secretly pinned to one circuit. If the ping to target X dies while target Y answers, circuit A is down, however cheerfully the service is failing over. The crucial detail is forbidding the fallback for those two targets only. The probe must be allowed to fail when its circuit fails, which is the opposite of what the router wants to do for real traffic. Two static routes are often all it takes.
Baseline each line against itself
One habit to carry over from single-circuit monitoring, doubled: the two circuits will have different personalities, and that is fine. A fiber line and a cable or wireless line can differ several-fold in normal latency and jitter while both being perfectly healthy specimens of their kind. Never alert on "B is slower than A" — of course it is; that is why B costs less. Alert on "B is slower than B usually is." Two circuits means two baseline registers, two sets of thresholds, and the discipline to resist comparing apples to the budget apple.
Round out the picture with the standard single-circuit toolkit on each line. That includes interface status, utilization in and out, errors and discards over SNMP, and latency and loss history per probe. Everything from WAN circuit health applies twice here, once per circuit, each with its own baseline. A standby circuit's baseline will look eerily empty, which is precisely why its probe matters. The probe is often the only traffic proving the idle line still works.
Tip: probe targets belong to someone. A provider's gateway is fair game at gentle rates — a ping every thirty seconds is polite background noise. But resist the urge to hammer a public service with fast probes from two circuits at once. Slow and steady is also better data: circuit health is about trends, not millisecond heroics.
Dashboards: per-circuit tiles, one service view
With honest per-circuit data flowing, the dashboard almost designs itself — as long as you respect the two audiences from earlier. Build it in two layers.
Layer one: a tile per circuit. Each circuit gets its own dashboard tile, named the way you would say it out loud ("Fiber — provider A," "Cable — provider B"). It shows the circuit's probe state, current latency versus its baseline, loss, and utilization both directions. The two tiles sit side by side, deliberately parallel. So a glance answers the question this whole guide opened with: is circuit B working right now? During an incident, this layer is where you live. It tells you which provider to call and what to say, and its history is the evidence.
Layer two: one service row. Above the tiles, a single element speaks for the site as a whole, and it needs exactly two indicators. First, service state: can this site reach the world at all — the thing users mean by "up." Second, and this is the part most dashboards omit, redundancy state: how many of the site's circuits are currently healthy. Render it bluntly — "2 of 2 paths healthy" versus "1 of 2 paths healthy". Give the degraded state a color that is not green. Not red, either: red means users are hurting. Amber is the honest color of state two: service fine, safety margin gone.
The service row is what makes the dashboard honest for the second audience. A manager glancing at it should be unable to confuse "we are fine" with "we are fine but uninsured". That distinction is the entire return on the second circuit's monthly bill, surfaced in one word. If your monitoring platform supports grouped or dependent checks, model the service row as "healthy while at least one circuit path is healthy". In that setup, model the redundancy indicator as a simple count of healthy members.
Alert design: redundancy degraded is its own class
Alerting is where dual-WAN monitoring most often goes wrong in one of two opposite directions. Direction one: every circuit failure pages like a site outage. So the third 2 AM page for a flapping backup line teaches everyone to ignore WAN alerts. And the lesson sticks just in time for a real outage. Direction two: circuit failures are logged but never surfaced, and the site rides one leg for a quarter. The cure for both is the same: redundancy degraded becomes its own alert class, distinct from site down, with its own severity, audience, and clock.
| State | What users feel | Alert class | Sensible handling |
|---|---|---|---|
| Both circuits healthy | Nothing — normal day | None | — |
| One circuit down or unhealthy | Nothing (or mild slowdown) | Redundancy degraded | Urgent ticket in business hours; page only if it persists or the survivor saturates |
| Second circuit degrading while first is down | Not yet — but soon | Redundancy degraded, escalated | Page — you are one wobble from an outage |
| Both circuits down | Site offline, phones lighting up | Site down | Page immediately, all hands |
Two design notes make this table work in practice. First, the degraded alert must be impossible to mistake for an outage in its very wording. Something like "Circuit B down; service OK on circuit A; redundancy LOST" tells the whole story in one line. That includes why it can wait until morning and why it cannot wait until next month. Second, the degraded alert needs a follow-through rule. A ticket that can be snoozed forever recreates the silent risk with extra steps. Re-alert daily while the state persists, and escalate if a repair clock (say, a couple of business days) expires. The alert's job is to be the opposite of the failure — politely, persistently loud.
And do not forget the quiet cousin: standby unhealthy. In active/standby setups, the spare tire deserves its own checks — its probe failing, its latency drifting, its interface flapping. Alert on these at the same degraded severity even though no failover happened. A dead standby is state two; it just got there without any drama.
When the backup is smaller
Most dual-WAN sites are not symmetric. The primary is the good circuit; the backup is whatever was affordable — a smaller line, a different technology, sometimes a cellular link. That asymmetry adds a wrinkle to state two worth planning for before it happens. When the primary dies, a full site's traffic tries to squeeze through a pipe sized for a rainy day. Failover succeeds, and the site immediately meets every congestion symptom in the book. The backup's utilization is pinned flat at capacity, latency and jitter are climbing, and queue drops are mounting. Users describe it, with feeling, as "down," even though every box on your dashboard is technically green.
Monitoring has two jobs here. First, watch the survivor, not just the corpse. During any failover, the backup circuit's utilization and drop counters become the most important graphs at the site. They tell you whether "degraded" actually means "fine" or "on fire." Alert when the surviving circuit saturates — that is the escalation row in the table above earning its keep. Second, give the business the numbers for a decision it should make in a calm meeting rather than a crisis. Either the backup gets sized to carry the real load, or someone decides in advance what gets sacrificed on backup days. That sacrifice means deprioritizing bulk transfers and cloud sync so voice and the business apps breathe. Your utilization history for the primary is exactly the evidence that meeting needs: it shows what the backup would have to carry.
If the backup is cellular or otherwise metered, one more check pays for itself: watch how much data flows over it in ordinary months. A metered backup that quietly starts carrying routine traffic — thanks to a load-sharing policy someone fat-fingered — announces itself on the bill otherwise. The same visibility matters doubly at unstaffed branch sites, where cellular backup is common; monitoring WAN links to remote sites covers that terrain.
Trust, but verify the switch
One gap remains. Everything above proves each circuit works and tells you when one dies. None of it proves the switchover works. When circuit A fails at the worst moment, the router must actually move traffic to B. Sessions must re-establish, and the things that depend on A's addresses (VPN peers, allowlisted services) must survive the trip. That proof only comes from deliberately pulling the plug on a schedule you chose. Watch your per-circuit probes and utilization graphs trade places in real time, and write down what broke. Failover drills are their own discipline with their own guide — WAN failover readiness covers planning them, running them safely, and monitoring readiness between drills.
The monitoring you built in this guide is what makes those drills observable. It also catches the switchover working in the wild. When a real failure hits, your graphs should show B's utilization leaping as A's probe dies. If instead B stays idle while users complain, failover itself failed — and you learned it from two tiles on a dashboard instead of a support call.
Where to go next
Two circuits monitored as one service comes down to four habits. Probe each line out its own door. Baseline each line separately. Show redundancy state where management can see it. And treat "degraded" as a first-class alert with a repair clock. From here, the natural next steps are testing the backup before you need it and, if your circuits serve branch offices, monitoring WAN links to remote sites. The full pillar — circuit metrics, router health, and the rest — lives at Router & WAN Link Monitoring.
Put this into practice with SysPeep Monitor
Watching two circuits honestly means twice the probes, twice the baselines, and a dashboard that tells the truth about redundancy. SysPeep Monitor collects per-interface metrics over SNMP and runs independent ping checks per circuit. Its dashboards and alert dependencies let you build the exact degraded-vs-down distinction this guide describes. The free trial installs on a Windows machine in minutes.
Download Free TrialLearn About SysPeep - All Rights Reserved.