
From One Site to Many: Monitoring Growth Without a Rebuild
Your monitoring works. It watches one building — the switches, the servers, the UPS in the closet. When something breaks, you know before the users do. Then the company does something inconvenient: it opens a branch office, acquires a smaller firm across town, or leases a warehouse. Suddenly there are devices you are responsible for on the far side of a rented link, and everyone assumes you are watching those too.
The second site is where monitoring designs either stretch or snap. A design that stretches treats the new site as one more instance of a pattern. A design that snaps was built on an assumption nobody wrote down. It assumed that everything worth watching sits on the same fast, free, reliable LAN as the monitoring server. Site two breaks that assumption.
This guide is about stretching. You will learn what changes when a WAN sits between you and the devices. You will learn the one question every multi-site design must answer, and the standard pattern that answers it well. Then you will learn how to package it all into a repeatable onboarding kit. Adding a site becomes a checklist, not a project.
In this guide
- What actually changes at site two
- The central question: what happens when the WAN drops?
- The reference pattern for multi-site monitoring
- A branch outage, walked through minute by minute
- Site onboarding as a repeatable kit
- What belongs on the WAN — and what does not
- The people side of multi-site monitoring
- The readiness checklist and your first branch
What actually changes at site two
The new ingredient is the WAN — the wide area network link that connects the sites. It might be a leased circuit, a site-to-site VPN over two internet connections, or an SD-WAN overlay. For monitoring purposes the differences barely matter. What matters is that a WAN differs from your LAN in three ways, and each undermines a habit single-site monitoring taught you.
It is slower. On a LAN, a poll — one "how are you?" question to one device — completes in a millisecond or two. Across a WAN it takes tens of milliseconds on a good day, and much longer when the link is busy. Timeouts you tuned for the LAN ("no answer in two seconds means trouble") start firing on devices that are perfectly healthy, just far away. Every retry doubles the traffic, so a struggling link gets poked harder precisely when it can least afford it.
It is costlier. Your LAN is, in practice, free and huge. A branch link is neither. It is usually a fraction of the LAN's capacity, and it carries the branch's actual business traffic. Every packet of monitoring chatter competes with someone's video call. Polling hundreds of metrics across that link every minute is a real load you are choosing to add.
It fails separately. This is the big one. The WAN link can die while the branch behind it hums along happily — and vice versa. From headquarters, both situations look identical: everything at the branch stops answering. A monitoring design that cannot tell "the link is down" from "the site is down" turns every branch incident into the same shrug. It turns your ISP disputes into your word against theirs.
The central question: what happens when the WAN drops?
Every multi-site monitoring design, whatever the vendor calls it, answers one question. That question is: when the WAN link to a site drops, do I still know what is happening at that site? There are exactly three possible answers, and they form a ladder.
Answer one: nothing (central polling)
The simplest design changes nothing: the central monitoring server polls the branch devices directly across the WAN, the same way it polls the local ones. It is quick to set up and it works — until the link hiccups. During any WAN outage you are blind — no data, no history, no idea whether the branch is fine or on fire. Worse, every branch-side problem and every link-side problem produce the same wall of red. So every branch problem looks like a WAN problem and vice versa. Central polling is a legitimate answer for a very small site — a kiosk, a closet with three devices — where blindness during link outages is a tolerable trade. It does not stretch past that.
Answer two: summaries (a local probe that reports home)
The standard answer stations a small piece of monitoring software — a remote probe — at the branch. The probe polls locally, on the branch LAN, at full speed and resolution, and sends compact summarized results home to the central server. When the WAN drops, the probe keeps polling and buffers results locally. It is like a correspondent who keeps writing while the phone line is down and files the backlog when it returns. You lose live visibility during the outage but not the history, and the outage announces itself cleanly, as you will see below. This is the pattern the rest of this guide walks through.
Answer three: full autonomy (a monitoring system per site)
The top rung gives each site its own complete, independent monitoring system: its own server, its own configuration, its own alerting. Each site is fully self-sufficient. You now run five monitoring systems instead of one: five things to patch, five configurations drifting apart, no single screen showing everything. Full autonomy earns its cost at genuinely large sites with their own IT staff, or where a regulation or contract demands complete separation. For a normal branch it is the overkill rung of the ladder: you pay the management cost every week and collect the benefit almost never.
| Answer | How it works | During a WAN outage | Ongoing cost | Right for |
|---|---|---|---|---|
| Nothing | Central server polls across the WAN | Blind; link and site problems look identical | Lowest — plus WAN load | Tiny sites, tolerable blindness |
| Summaries | Local probe polls, reports home, buffers | History preserved; one clean "site unreachable" alert | One small probe per site | Almost every branch |
| Full autonomy | Independent monitoring per site | Site keeps alerting itself locally | N full systems to run | Large staffed sites, hard isolation rules |
The reference pattern for multi-site monitoring
Here is the middle rung built out concretely. Picture headquarters plus two branches, and divide the work like this.
The central brain lives at HQ. One monitoring server holds the configuration, the long-term history, the dashboards, and — critically — the alerting. Alerts are evaluated and sent from the center. There is one set of rules, one escalation path, and one place to answer "why did my phone buzz?" The center also directly watches the things only it can see: itself, the HQ network, and the WAN links.
A probe lives at each branch and watches everything local. The probe watches the branch router, the switches, the little server, the printers, the UPS, and the access points. Every check that targets a branch device runs from the branch probe, across the branch LAN. Polling stays fast and cheap because it never leaves the building; only the summarized results travel.
The center watches the WAN links themselves — from both ends where possible. This is the detail most first attempts miss. From HQ, monitor reachability of each branch router's WAN address. Also monitor the HQ-side circuit interface: its status and error counters, usually via SNMP — the standard query protocol network gear speaks. From the branch, have the probe monitor the branch-side interface and reachability back toward HQ. Two ends, two vantage points: when both directions fail together, the circuit is down. The branch may reach HQ but not the reverse, or errors may climb on one end only. In either case, you are looking at a routing or line-quality problem — invisible from one end, obvious from two. Think of it as checking a phone line by calling from both ends instead of one.
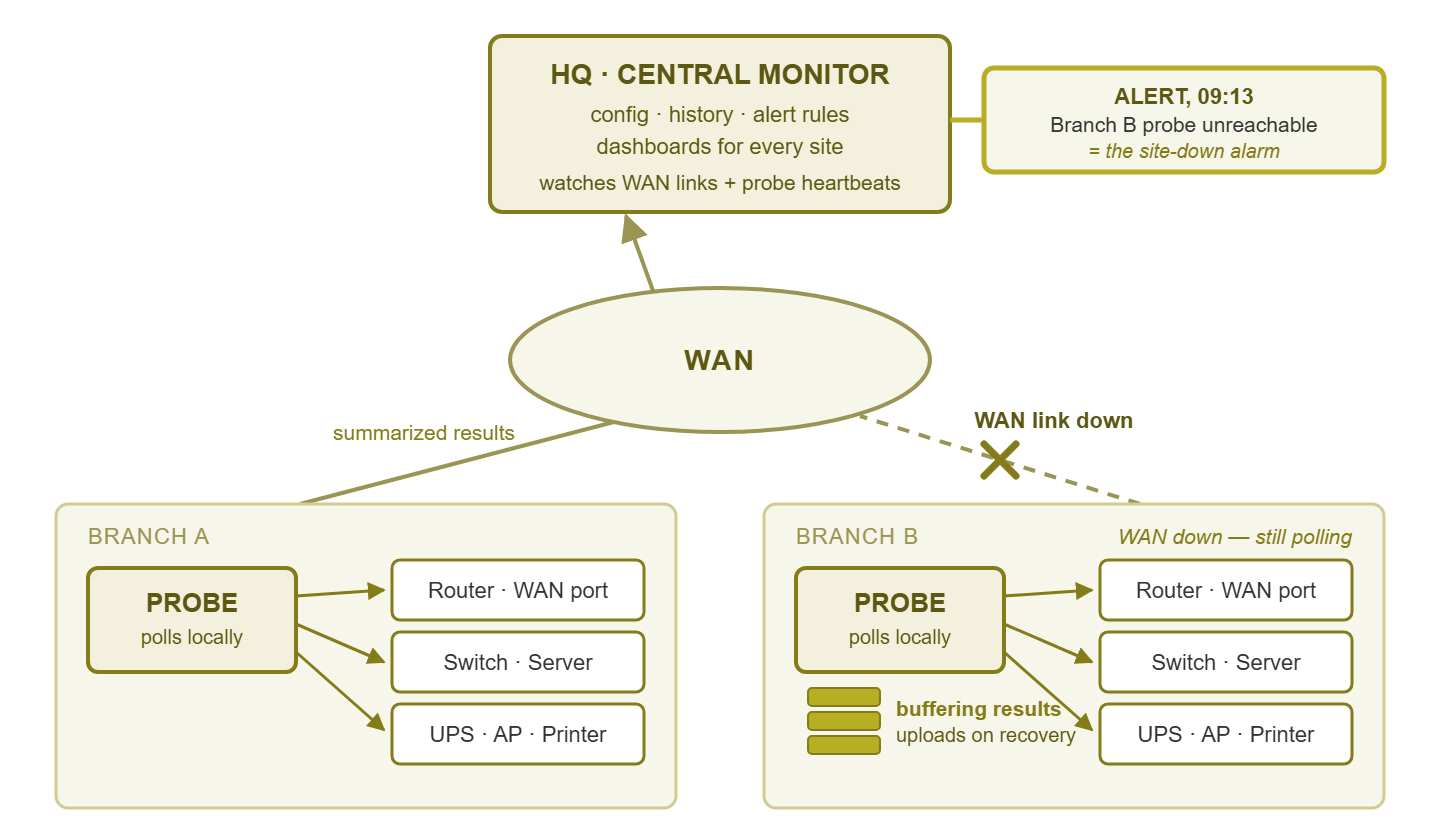
Figure 1: The reference pattern. Probes poll locally and send summaries home. When Branch B's WAN link fails, its probe keeps polling and buffers. The center's "probe unreachable" alert then becomes the site-down alarm.
A branch outage, walked through minute by minute
The pattern proves itself during a WAN outage, so walk through one. At 09:12 the circuit to Branch B dies — a backhoe, a provider maintenance gone wrong, it does not matter.
09:12 — at the branch. Nothing changes for the probe. It keeps polling every local device on schedule, and because its reports home stop getting through, it starts buffering results to local storage. The branch's monitoring history is still being written; it just cannot be read from HQ yet.
09:13–09:14 — at the center. The probe's regular check-ins stop arriving. After the grace period you configured, the center raises a probe unreachable alert. That grace period allows a couple of missed intervals, so a single dropped packet does not cry wolf. Notice what that alert actually is: your WAN-down / site-down alarm. One alert, not forty — the branch devices are not marked down individually; the center simply cannot hear from that site. If your tool supports dependencies, make the probe (or the WAN link check) the parent of everything at the branch. With that dependency, the flood is suppressed by design and the single meaningful alert survives.
09:14 onward — the human part. The on-call person sees "Branch B unreachable" and checks the two-ended WAN view. The HQ-side interface is down too. The on-call person opens a ticket with the carrier — without paging the branch or guessing. During the outage no fresh per-device alerts arrive from Branch B (the probe cannot deliver them). That is an honest limitation: the probe-unreachable alert is your coverage for the duration.
10:41 — recovery. The circuit returns, the probe reconnects, and it uploads its buffered backlog. This is backfill, quietly the best feature of the pattern: the graphs for Branch B fill in seamlessly. And you can now answer the question that decides arguments — was the branch actually down, or just unreachable? Suppose the buffered data shows the branch LAN humming along at normal load for the whole 89 minutes. You then have evidence for the carrier dispute and reassurance for management. If it shows the site lost power at 09:11, the story — and the fix — is entirely different. Without a probe, both stories look like the same blank gap.
Site onboarding as a repeatable kit
The architecture above answers the WAN question. Treat "add a site" as a kit — a bundle of templates, conventions, and a checklist. That avoids a fresh design exercise each time and makes site four an afternoon instead of a project.
Site templates: the site-sized mirror of device templates
You probably already use device templates — "every Windows server gets these checks." A site template is the same idea one level up: a standard bundle of checks per class of site. A small branch class might be: router (reachability, WAN interface, CPU), one switch (uplinks, error counters), access points, UPS, printer, plus the probe's own health. A standard branch adds a local server and DHCP scope checks. Define two or three site classes that match your reality. Onboarding then stops being two hundred decisions and becomes one: "which class is this site?"
Naming that carries the site code
Adopt a short code per site — HQ, AUS, WHS1. Put it at the front of every device name in monitoring: AUS-RTR01, AUS-SW01, AUS-UPS01. It reads as bureaucracy until the first 2 AM alert. Then "AUS-SW01 uplink down" tells the on-call person where before their coffee kicks in. Every device list, report, and search groups itself by site for free.
Per-site dashboards plus one rollup
Build two kinds of view. Each site gets its own dashboard — the branch at a glance, used when working on that site. Above them sits the site-health rollup: one row or tile per site showing worst-state-wins status — green, amber, red. The WAN link and probe health are always visible. The rollup is the screen you check at 8 AM and the one management will ask to see. Ten sites should cost you one glance, not ten dashboards of scrolling.
The onboarding checklist
Everything above compresses into a checklist you run per site:
- Survey: list the site's devices, addressing, and circuit details; confirm no IP range overlaps with existing sites; record the site contact.
- Assign the site code and add it to your documentation and IP plan.
- Stand up the probe on a suitable local host and enroll it with the center. The hands-on details (placement, secure enrollment, updates) get their own guide: Deploying Remote Probes That Behave.
- Run discovery from the probe, not across the WAN, and let it find the local devices.
- Apply the site template for the site's class; rename everything to convention.
- Add the two-ended WAN checks and set the dependency: probe/WAN as parent of all branch devices.
- Create the site dashboard and add the site's tile to the rollup.
- Wire alert routing: central on-call plus the site contact for the alerts they can act on.
- Verify and document: confirm every expected device is green, then file the site sheet — devices, contacts, circuit ID, local-hands notes.
Tip: before you declare a new site done, test the failure mode on purpose. During a maintenance window, disconnect the WAN (or the probe's uplink) for ten minutes. You should see exactly one meaningful alert at the center, continued local polling, and clean backfill afterward. Ten planned minutes now buys calm during the first real outage — and proves the buffering works before you depend on it.
What belongs on the WAN — and what does not
A little honest accounting keeps the design healthy as sites multiply. Three kinds of monitoring traffic legitimately cross the WAN. Summarized results flow steadily from probe to center, and they are small. The probe compresses hundreds of local question-and-answer exchanges into compact reports — a trickle compared to the polling it replaces. Configuration flows the other way occasionally — a changed threshold, a new check — and is tiny. Probe software updates are the one chunky item, and they are schedulable: push them off-hours. Add it up and a probe-based site costs the WAN a rounding error, which is exactly the point.
What should not cross the WAN: full-resolution polling of a building full of branch devices. Forty devices, five checks each, every minute, with retries — that is a constant stream of chatty packets on a link someone is paying for. The rule of thumb: questions stay local, conclusions travel. If you find a check targeting a branch device from the central server, ask why the probe is not asking instead. The honest answer is usually "leftover from before the probe existed."
One tuning note applies to the checks that do legitimately cross the WAN (the two-ended link checks). Give them WAN-appropriate timeouts and confirmation counts. A link that jitters between 20 and 80 ms is normal, not broken. Resist hair-trigger intervals. The reasoning behind interval choices is covered in Polling & Granularity.
The people side of multi-site monitoring
Multi-site monitoring is also an organizational design, because a branch alert has an extra question a local alert never had: who goes? Decide it per alert type, in advance. Central IT owns anything fixable over the wire — config, restarts, carrier tickets. The site contact — the office manager, the warehouse supervisor, whoever is reliably present — owns the physical world. That means questions like: "is the power on?", "is the equipment closet hot?", "can you tell me what lights are on the box labeled AUS-RTR01?" Put the site contact into the alert routing for exactly those physical alerts (power, UPS on battery, temperature, site unreachable) and nothing else. They should never see a disk-space warning.
Then write the local-hands step into your runbooks. The difference between a smooth branch incident and a painful one is usually thirty seconds of preparation done months earlier. Label racks with the same names monitoring uses. Keep a laminated photo of the closet with each device tagged, and a phone number that answers. "Please read me the lights on the second box from the top" is a diagnostic tool of surprising power. But it only works if the boxes are labeled and the phone number is current. Keep both in the site sheet, and re-verify the contact when site staff turns over.
Mind time zones as you spread. A branch two zones away has business hours and maintenance windows that are not yours. Site-aware alert schedules prevent the classic self-inflicted wound of running a noisy discovery scan during its busiest shift.
The readiness checklist and your first branch
Before you call your design multi-site-ready, check it against this list:
- Every branch device is polled locally by a probe; nothing chatty crosses the WAN.
- Each WAN link is watched from both ends, with WAN-tuned thresholds.
- Probe-unreachable alerting exists, with a dependency that suppresses the per-device flood.
- Buffering and backfill have been tested on purpose, not assumed.
- Site codes, site templates, and the onboarding checklist are written down.
- Per-site dashboards exist and the rollup shows every site on one screen.
- Alert routing knows about site contacts, and runbooks include the local-hands step.
For your actual first branch, sequence it gently. Stage the probe at headquarters first. Enroll it, apply the site template to a test group, and learn its behavior while it is still ten steps from your desk. Then deploy it to the branch, run the onboarding checklist, and finish with the deliberate WAN-pull test during a maintenance window. When that test produces one clean alert and a tidy backfill, you have not just monitored a second site — you have proven a pattern. Write down every deviation you had to make, fold it back into the kit, and site three will take half the time. By site four, it really is an afternoon.
Where to go next
The multi-site pattern leans on a few load-bearing pieces, each with its own guide. The probe itself gets the hands-on treatment in Deploying Remote Probes That Behave. As sites multiply, the central server's own load becomes a topic: see When Monitoring Gets Slow. Once many sites depend on one center, that center looks like a single point of failure. The honest cost-benefit of fixing that is in High Availability for Monitoring. If your "sites" are really clients or departments who each need their own view, Separating Clients and Departments picks up there. For where monitoring machinery should live in a network, see Monitoring Architecture. The rest of this pillar lives at Scaling & Distributing Monitoring.
Put this into practice with SysPeep Monitor
The pattern in this guide is exactly how SysPeep Monitor is built. A central service runs on one Windows machine. You drop lightweight remote probes at each site to poll locally and report home. Auto-discovery runs from the probe, and dependencies keep a WAN outage to one alert. The free trial from /download/ lets you test the whole thing — probe and all — before the second site goes live.
Download Free TrialLearn About SysPeep - All Rights Reserved.