
Finding Unsanctioned SaaS in Flow and DNS Logs
Ask five department heads which cloud services their teams use and you will get five confident, incomplete answers. Ask the DNS server and you get the truth. I have done both, in that order, and the second list was three times as long as the first. Every cloud service, sanctioned or not, has to be looked up by name before a single byte goes to it. Every connection that follows leaves a record of where it went, how much it carried, and when. Between those two sources you have a complete application census of your network. It does not depend on anyone remembering, admitting, or even knowing that a tool counts.
This guide turns that census into a short, ranked list of services you did not know about. You will learn to read DNS logs as an inventory of names and to group flow destinations into service categories. You will learn to use TLS server names where you have them, and to diff the result against your sanctioned list. Only the genuine unknowns then reach a review queue. You will also learn where the privacy line sits. The same data that reveals a team's project tool could, handled carelessly, become a browsing history, and that is not what any of this is for.
The steps assume you already have resolver logging or flow export turned on. If you do not, the sibling topics on DNS and flow monitoring cover the setup. This guide starts where the logs exist and asks what to do with them.
In this guide
- DNS logs: the application census
- Grouping flow destinations by service
- TLS server names, where you have them
- Diffing against the sanctioned list
- Ranking findings by data risk
- The discovery workflow, end to end
- Privacy boundaries that keep the program honest
- Where to go next
DNS logs: the application census
A DNS resolver log is a list of questions: at this time, this client asked for this name. It is the most underrated inventory in your building. Cloud services change their IP addresses constantly and hide behind shared content-delivery networks. But their names are stable, because names are what the client software has hard-coded. A service is a name before it is anything else. Using the resolver as a sensor is a whole subject of its own, covered under DNS as a threat sensor; here you only need one report from it.
That report is a daily census by registrable domain — the part of a name you would actually buy from a registrar. For files.quickshare-example.net and api.quickshare-example.net, the registrable domain is quickshare-example.net. Collapsing to that level is what turns thousands of lookups into one row per service. For each domain, count two things: how many distinct clients asked, and how many times. In sketch form:
-- daily service census from resolver logs (sketch, adapt to your log store)
SELECT registrable_domain(query_name) AS service,
       COUNT(DISTINCT client_ip)      AS hosts,
       COUNT(*)                       AS queries,
       MIN(time)                      AS first_seen_today
FROM   dns_log
WHERE  day = today
GROUP  BY service
ORDER  BY hosts DESC;
Notice the sort order. Distinct hosts matters more than query volume for this job. A single sync client can generate thousands of lookups a day on its own, which tells you one machine has a chatty program. Ten different machines each asking once tells you a tool has spread across a team, and spread is what makes something shadow IT rather than one person's experiment.
One prerequisite is easy to overlook: the census only covers clients that use your resolver. A workstation configured to ask a public resolver directly never appears in your log. Neither does a browser using encrypted DNS to an outside provider. Their services are invisible to this method. The fix is a firewall rule that allows DNS out only from your own resolvers. Add a flow report of any internal host sending DNS-shaped traffic anywhere else. Such a host is itself a small finding: something on it was set up to route around the building's plumbing. It belongs on the same review queue as the services you are hunting for.
Your first census will be enormous and mostly noise. It includes operating-system update servers, certificate checks, advertising networks, and telemetry endpoints. There are also the content-delivery names that sit under every website. Do not try to classify all of it. Build an ignore list of infrastructure domains as you go, and accept that the first week is mostly spent growing that list. (The second week is also mostly spent growing that list.) One caution about content-delivery names: they can hide the real service, because dozens of unrelated products share the same delivery network. When a busy domain turns out to be a delivery network, you need the flow and TLS data below to see what is actually behind it.
Grouping flow destinations by service
A flow record is a summary of one conversation. It includes source and destination addresses, ports, byte and packet counts, and start and end times — the envelope, never the letter. If you have not worked with them before, reading flow reports walks through the basics. For shadow IT, flows add the two things DNS cannot give you: how much data moved, and in which direction.
The obstacle is that flows show addresses, not names. The fix is a join. Suppose a client asked for files.quickshare-example.net at 09:02 and received a particular address. It then opened a connection to that address at 09:02. You can tag that flow with the name. Most flow tools do some version of this automatically if they can see your resolver logs. If yours does not, a nightly script gets you most of the way. It needs to keep a short-lived name-to-address table from the DNS log and label flows against it. Where no name is available, a reverse lookup or the registered owner of the address block gives you a hint, though a coarse one.
Once flows have names, you group them into service categories. You will not get this perfect, and you do not need to. Four categories cover most of what matters, and each has a recognizable traffic shape:
| Category | Typical hosts | Direction | Session shape | When |
|---|---|---|---|---|
| File storage / sync | A few to many | Upload-heavy | Constant small sessions plus occasional large ones | All day, including idle hours |
| File transfer | Few | Strongly upload | Rare, large bursts | Around deadlines |
| Collaboration / project | Many | Balanced, small | Many short sessions | Business hours |
| Messaging | Many | Small, balanced | Long-lived connections, occasional file bursts | Business hours, some evenings |
Ports help less than you might hope, because nearly everything runs over the standard encrypted web port now. What the port does tell you is when something is not web traffic. A file-sharing protocol, a database port, or a remote-desktop port headed to an outside address deserves a closer look regardless of the name attached to it. The volume pattern is the better classifier. A rollup that gives you the shape at a glance looks something like this:
-- outbound rollup per named service, one day (sketch)
SELECT service,
       COUNT(DISTINCT src_ip)               AS hosts,
       SUM(bytes_out)                       AS bytes_out,
       SUM(bytes_in)                        AS bytes_in,
       COUNT(*)                             AS sessions,
       SUM(bytes_out) / NULLIF(SUM(bytes_in),0) AS out_in_ratio
FROM   flows_named
WHERE  day = today AND dst_is_external
GROUP  BY service
ORDER  BY bytes_out DESC;
The out_in_ratio column is the quiet hero of that report. Most ordinary web use pulls far more than it pushes. A service where outbound consistently exceeds inbound is one where data is leaving, and that is the property you care about most. Sustained outbound patterns that look less like a sync client and more like something else are the concern of the sibling topic on data exfiltration patterns. For shadow IT, the ratio is simply how you tell storage from browsing.
TLS server names, where you have them
A client opens an encrypted web connection using TLS, Transport Layer Security, the encryption behind every padlocked web address. It usually announces the name of the site it wants at the very start, before encryption begins. That tells the server which certificate to present. This field is called the server name indication, and many firewalls and proxies log it. It is worth collecting for two reasons. It gives you a name even when the DNS lookup happened before your logging started or was answered from a cache you do not see. And it sees through shared delivery networks, because the client names the real service, not the delivery network in front of it.
Two limits. Some newer clients encrypt this name too, in which case you fall back to DNS and address-based hints. And you never need to go further than the name. Decrypting traffic to see content is a different, heavier decision with legal and cultural consequences. It buys you nothing for this job. The name tells you a service is in use. What passed through it is not the question you are asking.
Diffing against the sanctioned list
"Unknown" only means something relative to "known," so the diff is only as good as your list. The guide on building a SaaS dependency inventory covers how to assemble that list and who owns each entry. This section is about making it machine-matchable. For each sanctioned service you need its domain aliases. Include the main name, the API name (the address that programs talk to rather than people), the delivery names, and the login name. A large service may use half a dozen registrable domains. If you only list the obvious one, its API traffic will show up as an unknown every single week until you fix it. List every alias. Yes, the API one. Especially the API one.
With the aliases in place, every row in the daily census lands in one of three buckets. Sanctioned: it matched an alias; record that it was seen, note the host count, and move on. Ignore: it matched the infrastructure noise list; drop it. Unknown: everything else, which flows to the review queue. Keep the ignore list separate from the sanctioned list. They answer different questions ("is this noise?" versus "is this approved?") and merging them makes both worse.
Tip: expect the first diff to be humbling. Hundreds of unknowns is normal; most are noise, aliases you have not recorded yet, or sanctioned services you forgot were sanctioned. Work from the top of the list by host count, dispose of each row into a bucket, and the queue will shrink fast. The steady state is a weekly handful, not a daily flood.
Ranking findings by data risk
Not all unknowns deserve the same attention. A queue that treats a one-person unit converter the same as a department-wide file store will waste your reviewer's time until they stop reviewing. Rank by a simple question: how much company data can this service hold, and how easily does it leave? That gives you a risk tier per category, which you then sort by host count and outbound volume. A starting scale:
| Category | Tier | Why |
|---|---|---|
| File storage / sync | High | Holds whole folders; copies continuously; survives the employee leaving |
| File transfer | High | Exists to move large files outside; links often outlive their purpose |
| Alternative email / messaging | High | Conversations and attachments outside retention |
| Collaboration / project | Medium | Plans, customer names, documents; usually account-bound and recoverable |
| Note-taking | Medium | Meeting minutes; people paste passwords into notes more than anyone admits |
| Survey / forms | Medium | Collects information from outsiders, which may be personal data |
| Browser extension back-ends | Medium | May receive page content; spreads across many hosts |
| Utilities (converters, viewers) | Low | Usually no data at rest — unless files are uploaded to be converted |
The ordering matters less than the principle: file storage outranks note-taking. And a service used by twenty machines outranks the same service used by one. Adjust the tiers for your own organization. A survey tool is low-risk for a hardware shop and high-risk for a clinic. Write the scale down so two reviewers rank the same way. The top of the queue is never "the worst person." It is the biggest unmanaged data path, and that is a very different conversation.
Meridian Parts ran no census for years, and nobody missed it, because nothing was visibly wrong. Then the purchasing team's project board went read-only one Monday morning. They had started the free trial to track one late supplier. Over a year and a half, it had become the department's system of record for every open order. The trial had finally noticed. IT learned the service existed from the ticket. The resolver log, when somebody eventually looked, had been quietly recording thirty-one hosts asking for the name every working day. The review described the tool as "undocumented but load-bearing."
The discovery workflow, end to end
Put the pieces together and you get a loop that runs nightly and is reviewed weekly. The diagram shows the shape; the steps follow.
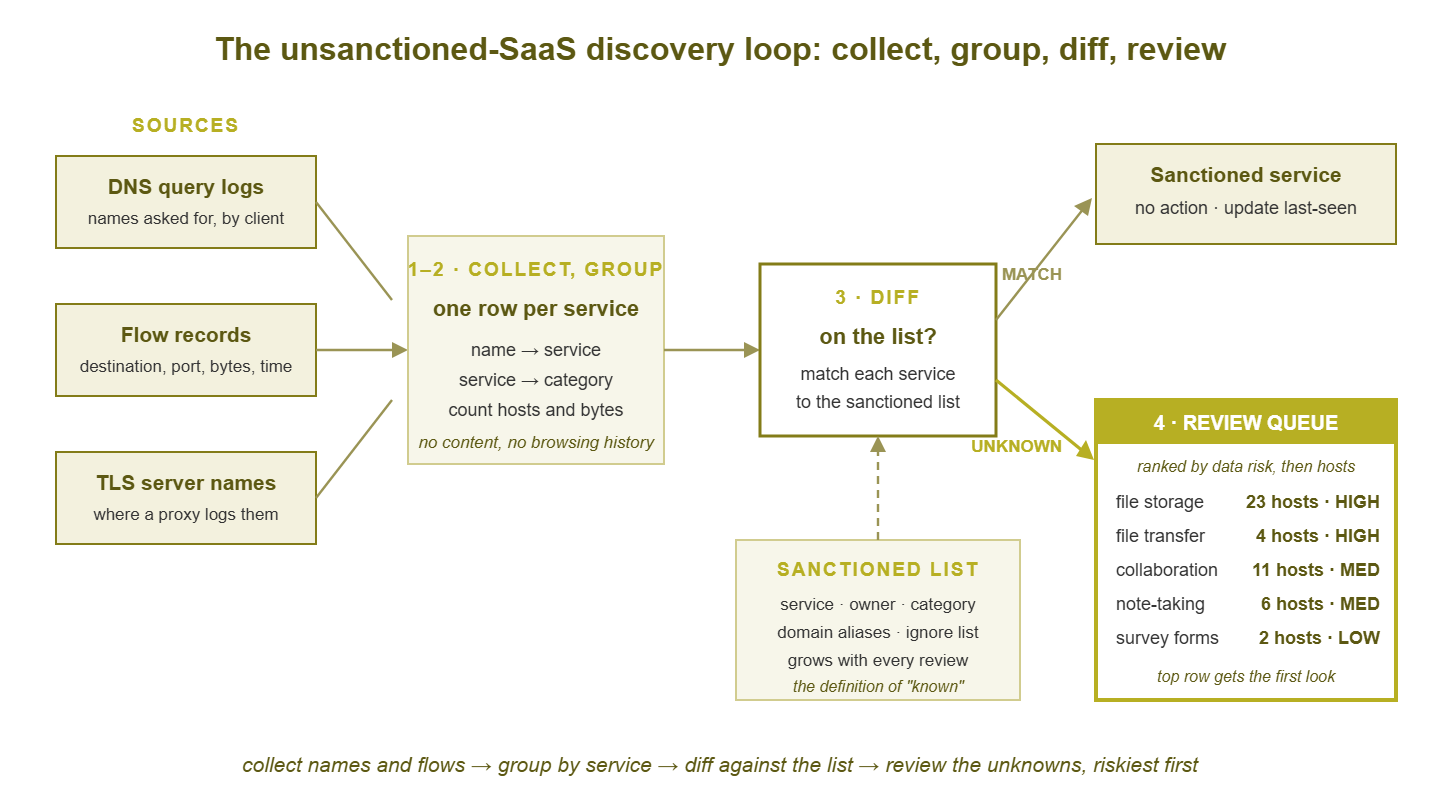
Figure 1: Names and flows are grouped into services, diffed against the sanctioned list, and only the unknowns reach a reviewer — riskiest first.
- Collect. Each night, pull the previous day's DNS census, the named outbound flow rollup, and the server-name log if you have one.
- Group. Normalize every name to its registrable domain. Join flows to names. Assign a category using name hints, ports, and the volume pattern. Produce one row per service: hosts, bytes out, bytes in, sessions, first seen, last seen.
- Diff. Match each row against the sanctioned aliases and the ignore list. Tag it sanctioned, ignore, or unknown.
- Queue. Sort the unknowns by risk tier, then hosts, then bytes out. Flag anything first seen in the last seven days as new.
- Review. Once a week, a named person walks the top of the queue and gives each row a disposition. The choices are: sanction it, ignore it, investigate further, or start a conversation.
- Feed back. Every disposition updates a list. Sanctioned rows add aliases; noise adds to the ignore list. Next week's queue is smaller because of this week's work.
What the reviewer sees should fit on one screen. Something like this:
UNKNOWN SERVICES - weekly review          sorted by tier, then hosts
service                  category        hosts  out/day  first seen   disposition
quickshare-example.net   file storage      23   3.1 GB   41 days ago  NEW -> conversation
sendbig-example.com      file transfer      4   900 MB    3 days ago  NEW
planboard-example.io     collaboration     11    40 MB  120 days ago  open
notesnap-example.app     note-taking        6    12 MB   60 days ago  open
formsy-example.com       survey / forms     2     2 MB    9 days ago  NEW
(lower tiers: 14 rows, see full report)
Read the first row the way a reviewer would. Twenty-three hosts, three gigabytes a day outbound, in use for over a month, in the highest tier. That is a team that has adopted a file store. And the right next step is the conversation described in the diplomatic conversation, not a firewall rule. A firewall rule would end the traffic and start a rumour. The second row is newer and smaller but in the same tier and growing: worth a look this week rather than next. The survey tool at the bottom can wait unless your organization handles personal data. In that case, its tier moves up and so does its place in the queue.
One walkthrough of a false alarm, because you will have plenty. A domain appears with forty hosts and almost no bytes. The category guesser calls it collaboration. A quick look at the name shows it is the licensing server for a sanctioned desktop application, which every installation checks once a day. Disposition: add it as an alias of the sanctioned application. It never appears again. Ten minutes, and the list is better for it.
Privacy boundaries that keep the program honest
Everything above works at the level of services and host counts, and it should stay there. The queue lists services, not people. When a row needs action, you identify the hosts involved to find the team. Then you talk to the team about the service. Do not discuss what any individual looked up, and never bring a list of their queries. A few concrete rules keep this from drifting:
- Report by service and count, not by person. The weekly report contains no usernames and no per-host query lists. Department-level grouping is fine when it helps route a conversation.
- Exclude non-work categories entirely. News, shopping, personal email, health, and similar categories are not shadow IT and are none of the program's business. Do not rank them low; drop them from the report before anyone sees it.
- Keep raw logs short-lived and summaries long-lived. The nightly rollups are all the history you need. Detailed query logs should follow whatever retention your security policy already sets, not be hoarded for this.
- Never decrypt for this purpose. Names are enough. Content is a different program with different approvals.
- Write the boundaries down and get them agreed. One page, signed off by your manager and whoever handles legal or HR questions. The program guide covers what belongs on that page.
These rules are not just etiquette. A discovery program that feels like surveillance loses the cooperation it depends on. People stop telling you about tools and move their workarounds to phones and home networks you cannot see. And the census stops being honest. Staying at the service level is what keeps the data trustworthy.
Where to go next
You now have a repeatable way to turn DNS and flow logs into a short, ranked list of unknown services. You also have a set of rules that keeps the list about services rather than people. The five department heads were not hiding anything. They did not know, and now you do. The physical side of the same problem — the storage box, the desk switch, the personal router — is covered in finding unofficial hardware. What to say when the top row of the queue has a team's name on it is the subject of the diplomatic conversation. Turning this weekly review into a routine that management supports is covered by the program guide. All of them live under Discovering Shadow IT Through Network Data.
Put this into practice with SysPeep Monitor
The census in this guide runs on data your resolvers, firewalls, and switches already produce. What most small teams lack is a place where the network's normal shape is visible at all. SysPeep Monitor auto-discovers your devices, graphs interface traffic over SNMP, and puts dashboards and reports in one web console. An uplink whose outbound volume quietly doubled has somewhere to show up. The free trial installs on any Windows machine in minutes.
Download Free TrialLearn About SysPeep - All Rights Reserved.