
snmpwalk From Scratch: Discovering What a Device Will Tell You
Almost every network monitoring system on earth gets its device data the same way. From a free script to the big commercial platforms, they ask questions over SNMP, the Simple Network Management Protocol. And the fastest way to understand SNMP, really understand it, is to spend twenty minutes with a command-line tool called snmpwalk. It simply asks a device to reveal everything it knows about itself.
This tutorial assumes zero SNMP experience. By the end you will have installed the tools and pointed them at a real device. You will have read the wall of text that comes back and pulled out genuinely useful facts. Those include the status and traffic counters of every network port on a switch. Once you can do that, monitoring tools stop being magic boxes: you will know exactly what they are doing under the hood.
In this guide
- How SNMP thinks: the giant numbered filing cabinet
- Step 1: Install the tools
- Step 2: Find (or enable) a device to ask
- Step 3: Your first walk
- Step 4: Turn numbers into names with MIBs
- Step 5: Walk the interesting subtrees
- The classic problems (and their fixes)
- Being polite: walking without hurting anything
- From walking to monitoring
How SNMP thinks: the giant numbered filing cabinet
Every SNMP-capable device — switch, firewall, printer, UPS — keeps its facts in one enormous, strictly organized filing cabinet. Every single fact has its own numeric label called an OID (object identifier). An OID looks like this:
1.3.6.1.2.1.1.5.0
Read it left to right and it is a path through folders in the cabinet, from the broadest drawer down to one specific fact. This particular OID means "the device's configured name." The dots are folder boundaries, exactly like slashes in a file path.
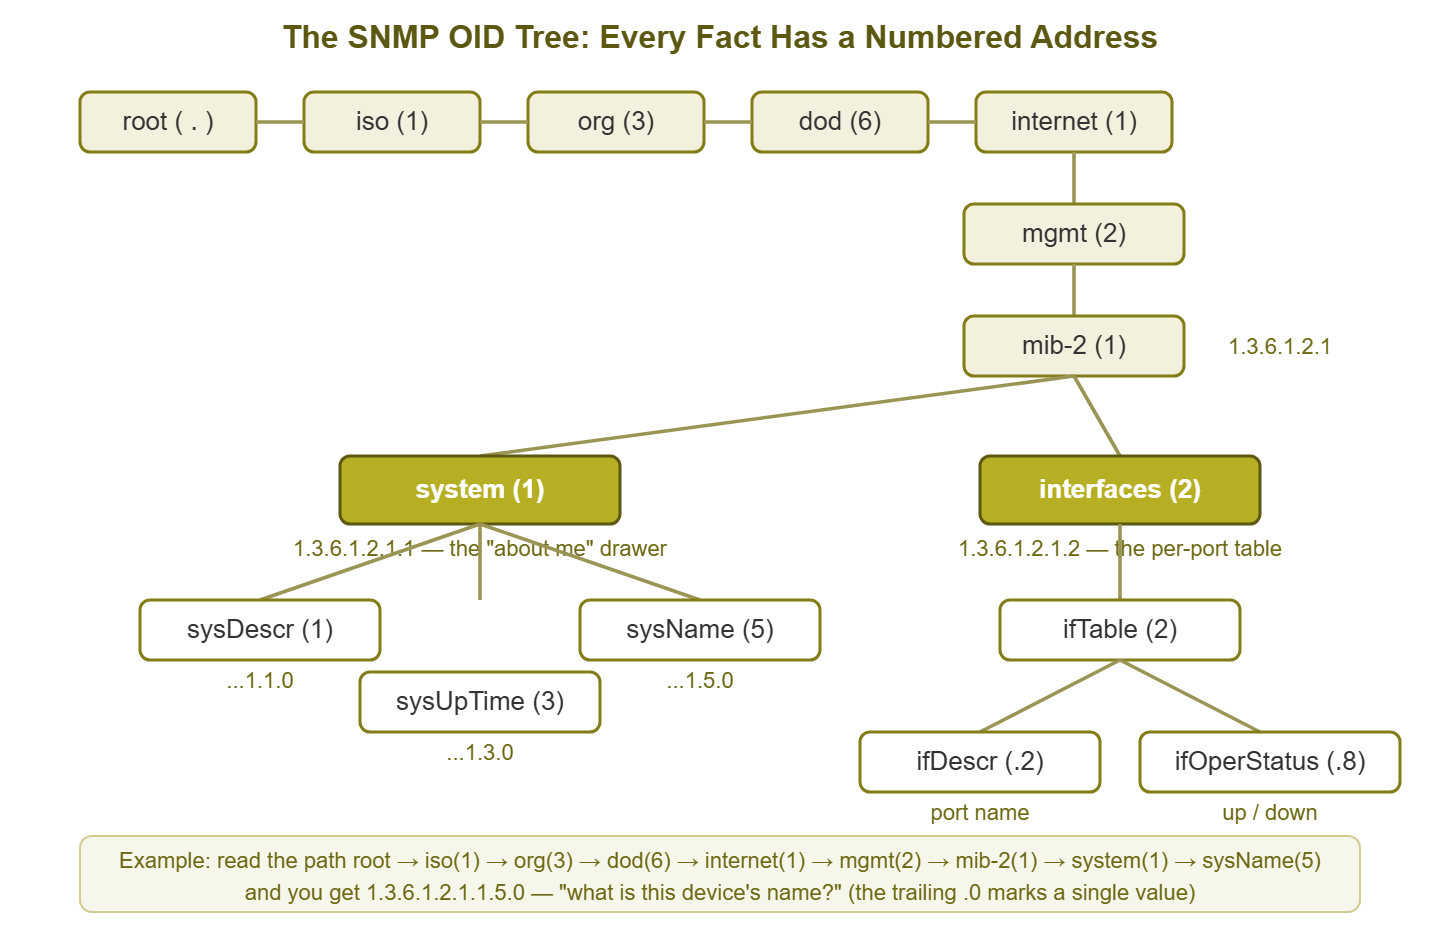
Figure 1: The OID tree. Every SNMP fact lives at the end of a numbered path. The two subtrees you will use constantly are system (1.3.6.1.2.1.1) and interfaces (1.3.6.1.2.1.2).
Three commands let you read the cabinet. snmpget fetches one labeled fact. snmpwalk starts at a folder and fetches everything inside it, in order. snmpbulkwalk does the same but grabs big handfuls at a time, which is much faster on modern devices. To read anything you also need a password of sorts. In SNMP versions 1 and 2c this is the community string. It is a shared word, very often set to public for read-only access on default configurations. (That default is a real security problem, and a topic of its own. For today's lab, just know that the community string is what the device expects you to present.)
Step 1: Install the tools
The standard toolkit is called Net-SNMP and it is free.
On Linux (including a test VM or WSL on Windows):
# Debian / Ubuntu
sudo apt install snmp snmp-mibs-downloader

# RHEL / Rocky / Alma
sudo dnf install net-snmp-utils
On Windows, the easiest routes are either WSL (Windows Subsystem for Linux) or a prebuilt Net-SNMP binary package. With WSL, use the apt command above. If you install the native Windows build, the same commands work in PowerShell or CMD.
Verify the install:
snmpwalk --version
If a version number prints, you are ready.
Step 2: Find (or enable) a device to ask
You need one device on your network with SNMP enabled, and its read-only community string. Good first targets, roughly in order of convenience:
- A network printer. Many ship with SNMP already on and the community set to
public. Nobody minds if you experiment on the printer. - A managed switch or access point. Usually this is a checkbox in the web interface. Look under Management or System for "SNMP," enable version 2c read-only, and set a community string.
- A firewall or UPS. Same idea — enable SNMP read-only in its admin interface. On firewalls, also allow SNMP (UDP port 161) from your workstation's address.
Set up a lab habit early: use a community string other than public and make it read-only. If the device supports it, restrict which IP addresses may query. You are learning on your real network; small hygiene now saves cleanup later.
Step 3: Your first walk
Suppose your switch is 192.168.1.2 and its read-only community is labread. Ask it for the system group — the "about me" drawer every SNMP device has:
snmpwalk -v2c -c labread 192.168.1.2 1.3.6.1.2.1.1
Breaking that down: -v2c says use SNMP version 2c. The option -c labread supplies the community string. Then comes the device address, and finally the OID of the folder to walk. Typical output looks like this:
SNMPv2-MIB::sysDescr.0 = STRING: 24-Port Gigabit Managed Switch, fw 2.0.0.48
SNMPv2-MIB::sysObjectID.0 = OID: SNMPv2-SMI::enterprises.4413
SNMPv2-MIB::sysUpTime.0 = Timeticks: (812449600) 94 days, 0:48:16.00
SNMPv2-MIB::sysContact.0 = STRING: it@company.example
SNMPv2-MIB::sysName.0 = STRING: sw-core-01
SNMPv2-MIB::sysLocation.0 = STRING: main closet, rack 1
Each line is one fact. The name is on the left (or a raw number, more on that in a moment). The data type is in the middle, and the value is on the right. Already you have learned the device's model, firmware, name, and location. You have also learned a genuinely useful fact — its uptime. This switch has been up 94 days. If a "the network is weird" ticket arrives and a walk shows uptime of 11 minutes, the switch rebooted and now you know where to dig.
Now try the full walk — everything the device will share — and save it to a file, because it can run to thousands of lines:
snmpbulkwalk -v2c -c labread 192.168.1.2 . > switch-full-walk.txt
That lone dot means "start from the very top." Skim the file. Most of it will look like noise on day one; that is normal. The skill you are building is knowing which drawers matter — which is exactly where MIBs help.
Step 4: Turn numbers into names with MIBs
A MIB (Management Information Base) is a dictionary file that maps numeric OIDs to human names and descriptions. With the right MIBs loaded, 1.3.6.1.2.1.1.5.0 displays as sysName.0. The standard dictionaries cover the facts nearly all devices share. Vendors publish extra MIB files for their device-specific drawers (fan speeds, PoE budgets, and so on). You can download these from their support sites.
On Debian/Ubuntu the standard MIBs come from the snmp-mibs-downloader package you already installed. Enable their use by editing /etc/snmp/snmp.conf and commenting out the mibs : line (or run with -m ALL). Two handy tricks once MIBs are loaded:
# What is this numeric OID called?
snmptranslate 1.3.6.1.2.1.2.2.1.10
IF-MIB::ifInOctets

# What number does this name live at?
snmptranslate -On IF-MIB::ifInOctets
.1.3.6.1.2.1.2.2.1.10
Names are for humans; numbers are the ground truth the protocol actually speaks. Monitoring tools generally store the numbers, which is why learning to move between the two forms pays off.
Step 5: Walk the interesting subtrees
The drawer you will visit for the rest of your career is interfaces — the per-port status and traffic table. Walk the port names first:
snmpwalk -v2c -c labread 192.168.1.2 IF-MIB::ifDescr

IF-MIB::ifDescr.1 = STRING: GigabitEthernet1
IF-MIB::ifDescr.2 = STRING: GigabitEthernet2
IF-MIB::ifDescr.25 = STRING: TenGigUplink1
Notice the number after the name: that is the index. Port GigabitEthernet2 is index 2 everywhere in the interfaces drawer, which is how you connect facts about the same port. Is it up? Ask for its operational status; how much traffic has it received? Ask for its byte counter — using the index:
snmpget -v2c -c labread 192.168.1.2 IF-MIB::ifOperStatus.2 IF-MIB::ifHCInOctets.2

IF-MIB::ifOperStatus.2 = INTEGER: up(1)
IF-MIB::ifHCInOctets.2 = Counter64: 918273645123
Two things worth absorbing here. First, ifOperStatus is the real up/down state of the port — the single most monitored value in networking. Second, that traffic number is a counter: a running total of bytes since the device booted, not a speed. Utilization graphs are made by reading the counter, waiting, reading again, and dividing the difference by the time between reads. Also note the HC in the name — it stands for high-capacity, the 64-bit version of the counter. The older 32-bit counter (ifInOctets) wraps back to zero after about 4 GB. On a busy gigabit link that happens in under a minute — a classic source of nonsense graphs. Prefer the HC counters whenever the device offers them.
To see a whole table at once in readable columns, try:
snmptable -v2c -c labread 192.168.1.2 IF-MIB::ifTable
Understanding what you are reading: the data types
Every value in a walk arrives labeled with its type, and the five you will meet constantly are worth knowing by name. STRING is text — names, descriptions, locations. INTEGER is a whole number, often used as a code with meanings defined in the MIB. You saw up(1) earlier, where 1 is the wire value and "up" is the translation. Without MIBs you would see only the 1. Counter32 and Counter64 are the ever-climbing totals we discussed. They only go up (until they wrap or the device reboots). They are meaningless as a single reading. They only make sense as a difference between two readings.
Gauge32 is the opposite: a right-now value that moves both directions, like current CPU percentage or the number of connected wireless clients. A gauge is meaningful the moment you read it. Finally TimeTicks counts hundredths of a second, almost always seen as uptime — the tools helpfully convert it to days and hours for you. Knowing these five types turns a wall of walk output into something you can skim intelligently. Text identifies, integers encode states, counters accumulate, gauges measure the moment, and timeticks date the last reboot. It also explains monitoring-tool vocabulary. When a tool asks whether a metric is a "counter" or a "gauge," it is asking whether it should do the subtract-and-divide math for you.
A five-minute lab: turn a counter into a graph, by hand
Since counters confuse every newcomer, prove the idea to yourself once and it sticks forever. Read a busy port's byte counter, wait sixty seconds, read it again:
snmpget -v2c -c labread 192.168.1.2 IF-MIB::ifHCInOctets.25
IF-MIB::ifHCInOctets.25 = Counter64: 918273645123

# ... wait 60 seconds ...

snmpget -v2c -c labread 192.168.1.2 IF-MIB::ifHCInOctets.25
IF-MIB::ifHCInOctets.25 = Counter64: 918348645123
The difference is 75,000,000 bytes in 60 seconds. Multiply by 8 to get bits (600,000,000), then divide by 60 seconds. The port averaged 10 megabits per second of incoming traffic during that minute. That arithmetic — two reads, subtract, divide by time — is every bandwidth graph you have ever seen. When a graph looks wrong, you now know what to question. Check the two readings, the clock between them, or a counter that wrapped or reset. A rebooted device starts its counters at zero, which briefly makes naive math go negative.
Beyond switches: what other devices will tell you
The interfaces table is the star on switches. But every device family keeps its own interesting drawers, and walking them is how you discover what is worth monitoring. A UPS will typically answer with its battery charge, estimated runtime, and whether it is currently running on utility or battery power. Walk the standard UPS subtree at 1.3.6.1.2.1.33 and look at what comes back. A printer will cheerfully report its page counts and toner levels (the standard printer MIB lives at 1.3.6.1.2.1.43). Firewalls and servers expose CPU, memory, and storage through the host-resources subtree at 1.3.6.1.2.1.25. And nearly everything has vendor-private drawers under 1.3.6.1.4.1 (the "enterprises" branch). Those drawers hold facts such as fan speeds, PoE power budgets, and temperature sensors, documented in the vendor's own MIB files. When you wonder "can I monitor X?", the honest answer is almost always: walk the device and find out.
The classic problems (and their fixes)
| Symptom | Most likely causes | What to try |
|---|---|---|
Timeout: No Response | SNMP disabled; wrong community string; a firewall or device ACL blocking UDP port 161 from your machine | Re-check the device's SNMP settings and allowed-source list; confirm you can reach the device at all; try from a permitted subnet |
| Walk starts, then stops partway | Some devices answer slowly or object to long walks | Add retries and patience: -t 5 -r 3; walk one subtree at a time instead of the whole tree |
| Everything is numbers, no names | MIBs not installed or not loaded | Install the MIB packages, use -m ALL, add vendor MIB files to ~/.snmp/mibs |
No Such Object on a get | Device does not implement that OID, or you mistyped the index | Walk the parent folder to see what actually exists on this device |
Values look like Hex-STRING: 00 1A 2B... | Binary data, such as a MAC address, shown raw | Normal — that is the value; MIBs improve the formatting |
| Graphs from 32-bit counters look insane | Counter wrapped past 4 GB between reads | Use the 64-bit ifHC* counters |
Being polite: walking without hurting anything
A read-only walk is very safe, but SNMP processing does use device CPU — and some older or budget devices have surprisingly little of it. Good manners: use snmpbulkwalk rather than hammering with single requests. Walk specific subtrees rather than the whole tree when you only need one drawer. Do not run tight loops of full walks against a production core switch at 10 AM. Stick to read-only community strings for exploration. (SNMP also has a write side — snmpset — which can change device settings. Leave writes disabled or restricted until you have a real reason.)
A note on versions: this tutorial used v2c because it is the easiest to learn and the most widely enabled. Its weakness is that community strings travel the network unencrypted. SNMP v3 adds real usernames, authentication, and encryption — for example: snmpwalk -v3 -u monitor -l authPriv -a SHA -A 'AuthPass' -x AES -X 'PrivPass' 192.168.1.2 system. Once you are comfortable walking, the versions guide in this topic covers when and how to move to v3.
The pocket cheat sheet
| Task | Command |
|---|---|
| Device identity & uptime | snmpwalk -v2c -c COMM HOST system |
| Everything, fast, to a file | snmpbulkwalk -v2c -c COMM HOST . > walk.txt |
| List all port names | snmpwalk -v2c -c COMM HOST IF-MIB::ifDescr |
| One port's status + traffic | snmpget -v2c -c COMM HOST IF-MIB::ifOperStatus.N IF-MIB::ifHCInOctets.N |
| Whole interface table, in columns | snmptable -v2c -c COMM HOST IF-MIB::ifTable |
| Name a numeric OID | snmptranslate OID (add -On for name → number) |
| Slow device: more patience | add -t 5 -r 3 |
| Secure v3 walk | snmpwalk -v3 -u USER -l authPriv -a SHA -A 'AuthPass' -x AES -X 'PrivPass' HOST system |
From walking to monitoring
Here is the satisfying part: you now know, at the protocol level, what a network monitoring system actually does all day. It keeps a list of devices and credentials. It asks each device for a handful of OIDs on a schedule — port status, traffic counters, CPU, uptime. It stores the answers and turns counters into rates. It compares values against thresholds so it can alert you when something looks wrong. Every dashboard graph you will ever look at is built from exactly the question-and-answer exchanges you just ran by hand.
The difference is scale and stamina: you walked one device once. Monitoring software walks every device, every minute, forever, and never forgets to check. Manual walks remain the perfect tool for exploring a new device, verifying credentials, and troubleshooting — and now they are in your toolbox for good. To go deeper in this topic, the SNMP Monitoring guides continue with OIDs and MIBs in depth, trap-versus-polling strategy, and locking SNMP down properly.
Put this into practice with SysPeep Monitor
You just did by hand what SysPeep Monitor does automatically, around the clock. SysPeep discovers your SNMP devices and walks them for you. It tracks port status, traffic, CPU, and uptime. It alerts you when the answers change for the worse. If you enjoyed the walk, you'll enjoy having it done for you. The free trial installs on any Windows machine in minutes.
Download Free TrialLearn About SysPeep - All Rights Reserved.