
Building a Central Syslog Server on a Budget
Right now, your network's story is scattered across a dozen tiny diaries. The switch keeps a few hundred lines in a memory buffer that vanishes on reboot. The firewall keeps its own log in its own web interface, with its own idea of how far back "history" goes. The UPS remembers three events. When something breaks, you get to visit each device separately, squint at each vendor's log viewer, and try to stitch a timeline together by hand.
There is a standard fix, and it is one of the best returns on effort in all of IT: a central syslog server. It is one machine that every device sends its log messages to, the moment they happen. You can build one in an afternoon, with free software, on a very modest virtual machine. This guide walks the whole path. It explains why central collection comes first and gives three free ways to build the collector (with honest trade-offs). It covers how big a server you actually need, how to point each kind of device at it, and how to prove the pipeline works. It shows the file layout and search habits that make it pay off from day one. If the terms facility, severity, or "BSD format" are new, skim syslog fundamentals first — this guide builds on it.
In this guide
- Why central collection comes first
- Three free paths to a collector
- Path A: rsyslog, the default choice
- Path B: syslog-ng, the friendlier config
- Path C: a log platform with a web UI
- How big a server do you need?
- Pointing your devices at it
- Validating the pipeline (and the silent failures)
- Organizing and searching from day one
- The afternoon build checklist
Why central collection comes first
Before any fancier log ambitions — parsing, dashboards, alerting — centralize. Three reasons, in rising order of importance.
Logs stored on a device die with the device. A switch's log buffer is wiped by the very reboot you want to investigate. A failed firewall takes its own history down with it. And in a security incident it is worse than fragile: an attacker who compromises a box can simply delete its diary. The log most likely to explain an event is the one stored on the machine where the event happened. Sending a copy off-box, the moment each message is written, means the evidence survives the disaster — whatever flavor of disaster it is.
Correlation needs one timeline. Real problems span devices: the UPS blinked, then the switch port flapped, then the server complained about its storage. Read three separate logs and you see three unrelated grumbles; read one merged timeline and you see a story with a cause. Central collection is what makes the phrase "what happened at 14:07?" answerable with one search instead of four browser tabs.
Convenience compounds. The first time you grep one folder instead of logging into five admin UIs, you save ten minutes. The real change is behavioral: once looking is cheap, you actually look — and admins who look at logs catch problems while they are still small.
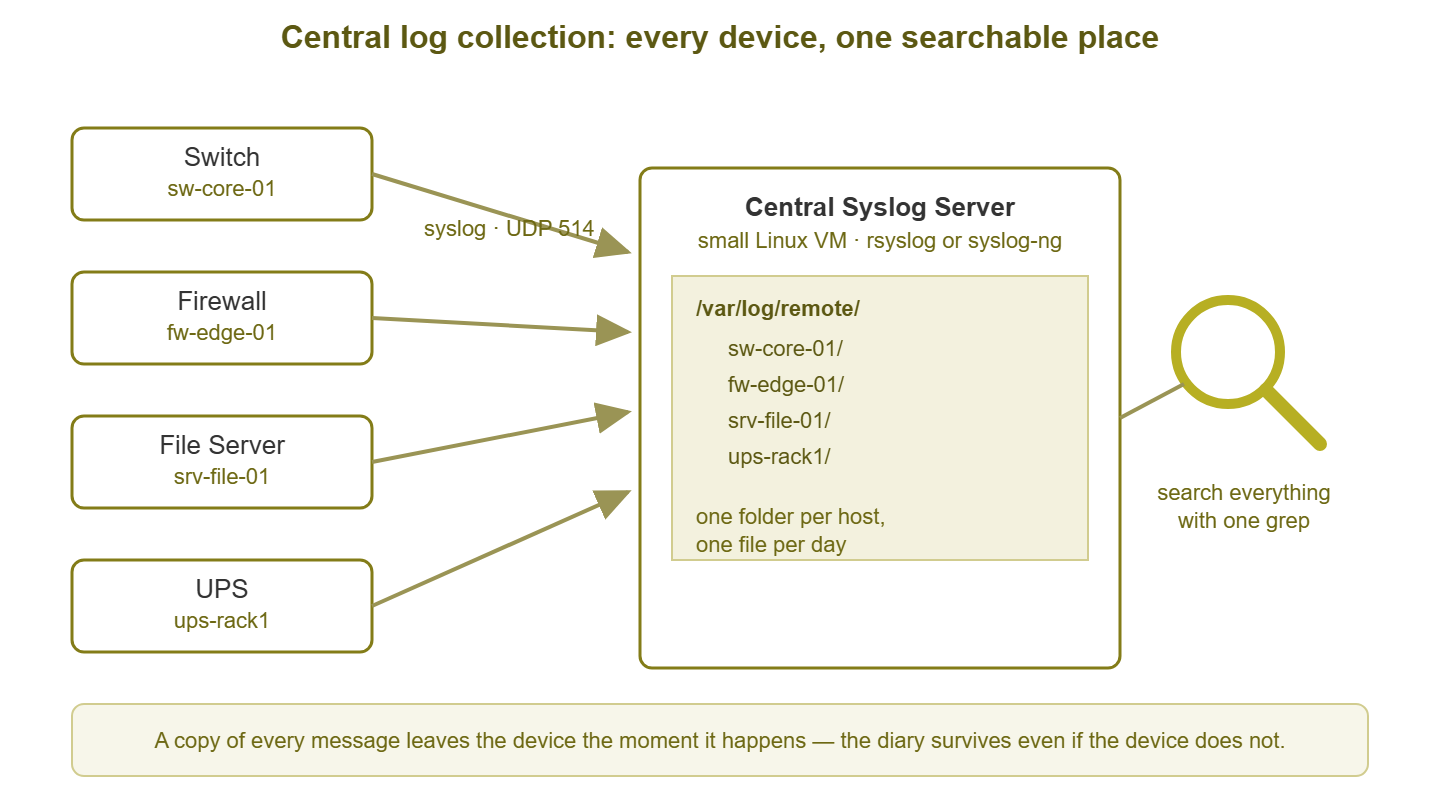
Figure 1: The whole idea. Every device streams its messages to one collector, which files them per host, per day — one searchable timeline that survives any single device's death.
Three free paths to a collector
All three paths below are free and legitimate; they differ in effort and in what they give you. Path A is the sensible default for a first build. Path B does the same job with a config style some people strongly prefer. Path C is the step up for when plain files stop being enough — and it is honest work to know when that is.
Path A: rsyslog, the default choice
rsyslog is the logging service already installed on most Linux distributions. Your collector software is very likely sitting on any small Linux VM you create, waiting to be told to listen. That is the whole job: enable network listening, and tell it to write each device's messages into its own file tree. Create one file, for example /etc/rsyslog.d/10-central.conf:
# Listen for syslog from the network
module(load="imudp")
input(type="imudp" port="514")

module(load="imtcp")
input(type="imtcp" port="514")

# One folder per sending host, one file per day
template(name="PerHostFile" type="string"
         string="/var/log/remote/%HOSTNAME%/%$YEAR%-%$MONTH%-%$DAY%.log")

# Anything that arrived over the network goes to that tree
if $fromhost-ip != "127.0.0.1" then {
    action(type="omfile" dynaFile="PerHostFile"
           dirCreateMode="0755" fileCreateMode="0640")
    stop
}
Reading it top to bottom: the two module/input pairs open UDP and TCP listeners on port 514. The template defines the filing scheme — %HOSTNAME% and the date variables are filled in per message, which is what produces the per-host, per-day layout. The if block says: any message that did not originate on this machine goes into the remote tree. The stop keeps it from also being mixed into the collector's own local logs. Then restart and open the firewall:
sudo mkdir -p /var/log/remote
sudo systemctl restart rsyslog

# Ubuntu/Debian with ufw
sudo ufw allow 514/udp
sudo ufw allow 514/tcp

# RHEL-family with firewalld
sudo firewall-cmd --permanent --add-port=514/udp
sudo firewall-cmd --permanent --add-port=514/tcp
sudo firewall-cmd --reload
That is a working central syslog server. Twenty lines of config, most of them copied.
Path B: syslog-ng, the friendlier config
syslog-ng does exactly the same job. People choose it for its configuration language, which reads like wiring a circuit: you declare sources, destinations, and filters, then connect them with log statements. The equivalent of the setup above:
source s_network {
    network(transport("udp") port(514));
    network(transport("tcp") port(514));
};

destination d_perhost {
    file("/var/log/remote/${HOST}/${YEAR}-${MONTH}-${DAY}.log"
         create-dirs(yes));
};

log { source(s_network); destination(d_perhost); };
For a simple build the two are equivalent — pick either. syslog-ng tends to earn its keep when routing gets complex. Send firewalls to one tree and switches to another. Forward a filtered subset to a second collector. Split by facility. Each of those stays a readable one-liner of sources, filters, and destinations. If you expect to grow into elaborate routing, start here; otherwise Path A's "already installed" advantage usually wins.
Path C: a log platform with a web UI
The third path is a class of free software rather than one tool: the log management platform. These ingest syslog like the daemons above. But instead of writing plain files, they index every message into a search engine and put a web interface on top. Type a query and get results across all devices and dates in seconds. Save searches, build dashboards, give teammates access without shell logins.
The honest trade-off is resources and care. Indexing costs real RAM and meaningful extra disk beyond the raw log data. A platform is another moving system to upgrade and tend — a heavier pet than a daemon writing files. The pragmatic advice: start with files and grep; graduate when search pain justifies it. You will know the moment. It is the day you find yourself grepping across many hosts and weeks, again, for the third time this month. Or it is the day a teammate needs log access and you hesitate to hand out shell accounts. Nothing about starting with Path A is wasted; the same devices point at the same address, and a platform can be added behind or beside the daemon later.
How big a server do you need?
Smaller than you think. Log lines are tiny — a typical message is on the order of 150 bytes. Run the estimate for a small office, with the assumptions stated so you can swap in your own numbers. Say 30 devices, where a switch writes a few hundred lines a day. Servers write a couple of thousand each, and the firewall a few thousand (the big variable — more on that below). Call the fleet total 50,000 lines a day. That is:
50,000 lines/day × 150 bytes ≈ 7.5 MB/day
7.5 MB/day × 365 days ≈ 2.7 GB/year — uncompressed
A VM with two cores, a couple of GB of RAM, and a few tens of GB of disk will run a file-based collector for years without noticing. Aged log files compress extremely well, which helps. The honest caveats: one device left at debug level can multiply your volume by ten or a hundred. So can a firewall logging every denied packet on a busy internet edge. So provision comfortable headroom, monitor the collector's disk like any other server, and expect to tune noisy senders. That tuning is the subject of what to log. How long you keep files is a policy question with its own storage math, covered in log retention. Path C platforms want more of everything — RAM for indexing, disk for indexes — which is part of why files-first is the budget answer.
Pointing your devices at it
Now the satisfying part: telling every device to send its diary to the collector's address. The setting hides in a different menu on every product, but the shape is always the same — a destination address, a port and protocol, and usually a level knob. The quick reference:
| Device class | Where the setting usually lives | What to set |
|---|---|---|
| Managed switch | Web UI or CLI: "logging host" / "syslog server" under System or Management | Collector IP, UDP 514; remote level: informational |
| Firewall / router | Log settings → remote logging / syslog server | Collector IP; choose event categories; level: informational |
| UPS / NAS / printer | Management web UI → notifications or syslog | Collector IP; enable and test |
| Linux hosts | A forward rule in /etc/rsyslog.d/ | See snippet below |
| Windows hosts | No native syslog — install a small free forwarder agent that reads the Event Log and sends syslog | Point agent at collector; forward System and Security channels to start |
Linux machines forward with one line, because the same rsyslog that runs your collector runs on every Linux host. Drop this into /etc/rsyslog.d/90-forward.conf and restart rsyslog:
# one @ means UDP, two @@ means TCP
*.info  @10.20.0.9:514
That reads: every message of severity informational or more urgent, from any facility (*), send to 10.20.0.9. Two knobs deserve attention as you work through the fleet. First, the level per destination: most network gear lets the console, the local buffer, and the remote server each have their own severity floor. Set the remote one to informational so the collector gets the full story, whatever the console shows. Second, on multi-interface devices (firewalls, routers), look for a source interface setting that controls which address the device sends from. Choose the management interface, and you will save yourself a confusing hour later.
Tip: configure devices with the collector's IP address, not a DNS name. Many devices only accept an IP anyway — and if DNS ever breaks, name-based logging goes quiet at exactly the moment you need logs most. Give the collector a static address and treat it as infrastructure.
Validating the pipeline (and the silent failures)
Because syslog over UDP is fire-and-forget, a broken pipeline produces no errors anywhere — just silence you might mistake for a quiet network. So validate deliberately. The test tool is logger, present on any Linux machine, which sends a hand-crafted syslog message wherever you aim it. From some machine that is not the collector:
logger -n 10.20.0.9 -P 514 -d "central syslog test one"
(-d means UDP; use -T to test the TCP listener.) Meanwhile, on the collector, watch arrivals live. The moment a new device's first message lands, its folder appears, which makes onboarding weirdly fun to watch:
ls /var/log/remote/
tail -f /var/log/remote/testhost/$(date +%F).log
Then trigger a real event from each newly added device — log out and back in to the switch, for instance. Watch the line arrive. When a device stays silent, it is nearly always one of these classic silent failures:
- Wrong port or protocol. The device is sending TCP while you only listen on UDP, or a vendor default port that is not 514. Check both ends agree.
- The collector's own firewall. You opened 514 in your head but not in ufw/firewalld. Test with
loggerfrom another machine, not from the collector itself — local tests bypass the network path and prove nothing about it. - A network firewall or ACL in the path. Common when devices sit in a management VLAN and the collector does not.
- Source-interface mismatch. A multi-homed device sends from an unexpected address. If any filtering or reverse-DNS naming depends on the source, messages get dropped or filed under a name you did not expect. Set the source interface explicitly.
- Device logging level set to emergencies-only. The sneakiest one: the pipeline is perfect. But the remote destination's severity floor was left at its factory "only tell them about disasters" setting. So nothing interesting ever sends, and both ends look healthy. Set the remote level to informational and re-test.
One more habit while you are here: make sure the collector and your devices agree on time via NTP. Nothing about the pipeline breaks when clocks drift — only the truth does. Timestamp sanity covers the details.
Organizing and searching from day one
A quick naming note first: the collector files each message under the hostname the sender puts in it (or the sender's address when there is none). So a device with no hostname configured shows up as a folder named 10.20.0.31. Take the two minutes to give every device a real hostname — folders named sw-core-01 make every later search more readable.
The per-host, per-day layout you configured is not just tidiness — it is free query power. "Which device" and "which day" are the two commonest filters in any log hunt, and your filesystem now answers both before a single search tool runs. Two small chores complete the housekeeping: compress old files and eventually delete them, both of which the daily-file scheme makes trivial. Two cron-able one-liners:
# compress files older than 7 days; delete compressed files older than ~13 months
find /var/log/remote -name "*.log"    -mtime +7   -exec gzip {} \;
find /var/log/remote -name "*.log.gz" -mtime +400 -delete
(Pick the deletion age from your retention policy, not from folklore.) Then build the searching habit early, because the habit is the payoff. The three hunts you will run most, as recipes:
Hunt 1 — one host's day. Something odd happened on the core switch this morning? Its whole day is one file:
grep -i "gigabitethernet1/0/24" /var/log/remote/sw-core-01/$(date +%F).log
Hunt 2 — one user, everywhere. Every device a user touched (or failed to get into), across the whole fleet:
grep -ri "jsmith" /var/log/remote/ | grep -i "fail"
Hunt 3 — one error type, ranked across the fleet. Who is flapping? Count matches per file and sort:
grep -rc "UPDOWN" /var/log/remote/ | grep -v ":0" | sort -t: -k2 -rn | head
The flags doing the work: -r recurses the tree. The -i flag ignores case (vendors disagree about capitalization the way they disagree about everything). The -c flag counts matches per file, and zgrep is the same tool for the compressed archives. When these one-liners start feeling limiting rather than empowering, you are ready for parsing logs into fields. Eventually, you are ready for alerting, so the collector taps you on the shoulder instead of waiting to be searched (alerting on logs).
The afternoon build checklist
- 1. Create a small Linux VM: two cores, a couple of GB of RAM, a few tens of GB of disk, static IP.
- 2. Confirm rsyslog is present (or install syslog-ng if you chose Path B).
- 3. Add the listener config with the per-host, per-day template; create
/var/log/remote; restart the service. - 4. Open UDP and TCP 514 in the collector's firewall.
- 5. Send a test with
loggerfrom another machine; watch it arrive withtail -f. - 6. Point the firewall at the collector first (it has the most interesting logs), verify, then work through switches, servers, UPS, and the Windows forwarder.
- 7. On each device: remote level to informational, source interface set, then trigger a real event and confirm arrival.
- 8. Schedule the compress and delete jobs; confirm NTP everywhere.
- 9. Put a calendar note one week out: review which host is noisiest and tune it.
Where to go next
An afternoon, zero dollars, and every device on your network now files its story in one searchable place that survives reboots, failures, and tampering. The natural next steps: decide deliberately what to collect and what to drop so the archive stays signal-rich. Set how long to keep it in log retention. The full series lives at Syslog & Log Collection.
syslog-ng (syslog ng) vs rsyslog, and can syslog ng run on Windows?
Both are open-source syslog daemons for Linux. rsyslog is the default on most distributions and is fast and simple to configure for forwarding and plain storage; syslog-ng has the richer configuration language, better parsing of odd formats and more output options, at the cost of learning it. On Windows there is no free syslog-ng; the Windows agent is a separate commercial product. The usual Windows route is to collect the event log directly, which a receiver such as SysPeep does alongside syslog from the network devices.
Put this into practice with SysPeep Monitor
Your new collector is one more box to keep healthy — and its disk will fill on the least convenient day. SysPeep Monitor watches the watcher. It auto-discovers your devices and tracks disk, CPU, and service health over SNMP, WMI, and SSH. Its alert rules are designed to stay quiet until something needs you. Run it beside your syslog server and neither of you gets surprised — free trial on any Windows machine.
Download Free TrialLearn About SysPeep - All Rights Reserved.