
Hysteresis, Confirmation, and Flap Damping: The Anti-Noise Toolkit
Most alert noise does not come from wrong thresholds. It comes from a value dancing across a perfectly reasonable one. CPU at a threshold of 80% reads 80.1, and the alert fires. Two minutes later it reads 79.9, and the alert clears. Then 80.3. Then 79.8. By lunchtime the check has fired forty times, every single firing technically correct, and the on-call inbox holds eighty messages about one server having an ordinary morning. Admins call this flapping, and no amount of moving the line fixes it. Wherever you draw a single line, some metric will eventually camp on it and tap-dance.
The fix is a small toolkit of mechanisms that sit between the threshold and the notification: hysteresis, confirmation counts, dwell times, and flap damping. Every serious monitoring tool implements most of them, under names that vary just enough to be confusing. This guide covers each one in plain words, with a worked numeric example, where it belongs, and what it costs. I learned them one noisy night at a time, and the order below is the order I wish someone had handed me.
Cost is the right word, and the central trade-off goes on the table before anything else: every anti-noise mechanism buys quiet by adding detection delay. Nothing in this toolkit is free. Each guard works by waiting: for another sample, for a confirmation, for a condition to persist. Waiting means real problems are reported later than your polling could have reported them. Good tuning is not "maximum quiet". It is choosing, per check, how many minutes of delay you are willing to pay for how much silence.
In this guide
- Hysteresis: separate trigger and clear levels
- Confirmation counts: N-of-M voting
- Dwell time: "sustained for" qualifiers
- Flap damping for up/down checks
- Recovery notifications: the noise nobody audits
- Composing the toolkit, plus the reference card
Hysteresis: separate trigger and clear levels
Plain words: instead of one line, use two — a trigger level that raises the alert and a lower clear level that resolves it. The alert fires when the metric crosses the trigger, and it does not resolve until the metric drops all the way below the clear level. The gap between the two is a dead zone where nothing changes state. (The name comes from engineering — your home thermostat does exactly this. It heats past the set point and does not restart until the room cools well below it, precisely so the furnace does not flap.)
Worked example: trigger at 85% memory, clear at 75%. The metric climbs to 86% — one alert. It then wobbles: 84, 87, 83, 88. Under a single-line rule that is three more alert/clear pairs. Under hysteresis it is nothing, because the value never fell below 75. The original alert simply stays open, which is the truthful description of what is happening. Only when memory finally drops to 74% does the alert resolve. One problem, one alert, one recovery.
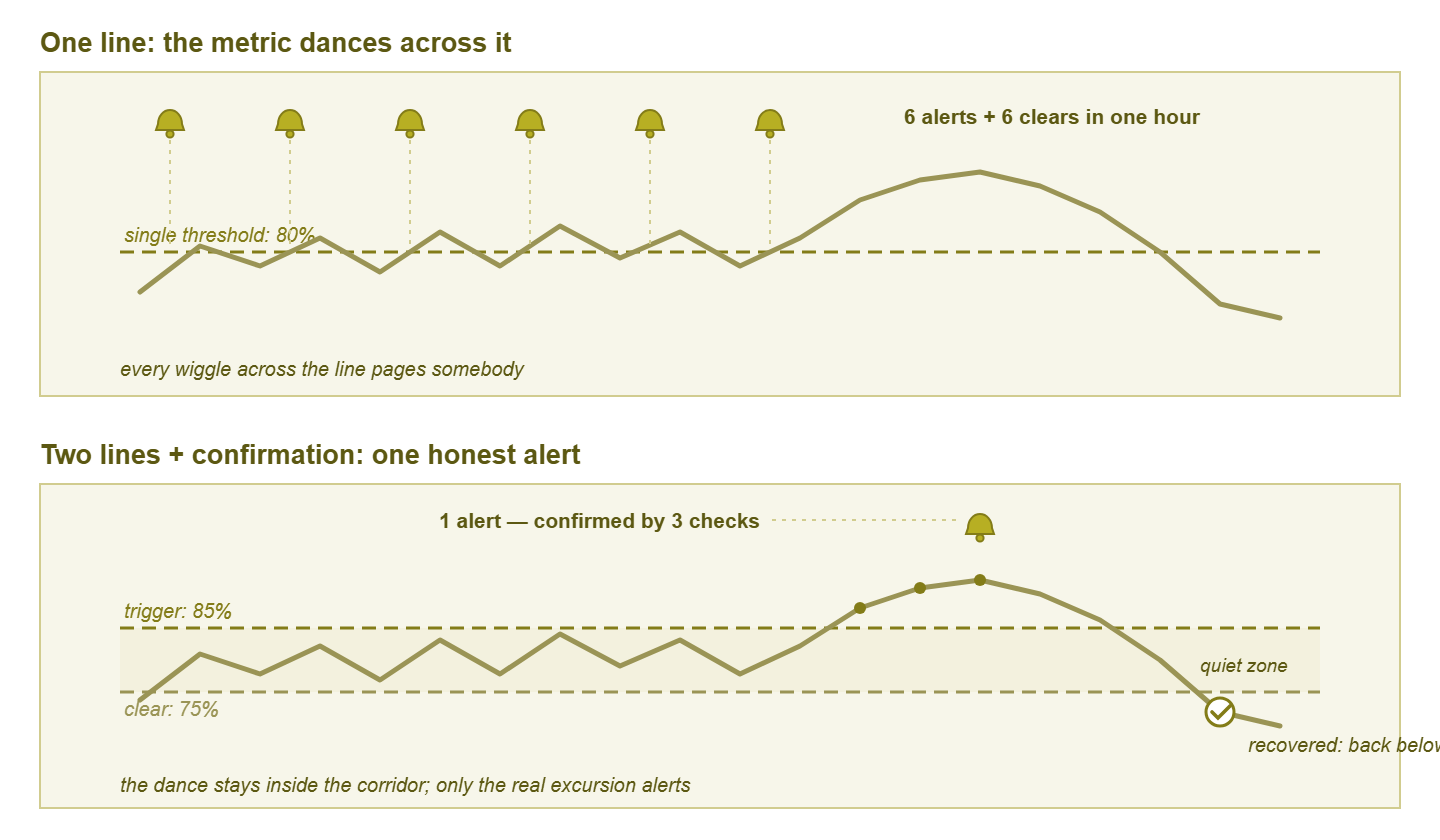
Figure 1: the same wiggling metric against one line (six alert/clear pairs) and against trigger/clear levels with confirmation (one alert, one recovery).
Sizing the gap: wider is calmer — and slower to confirm recovery. A 2-point gap (85/83) still flaps on any metric that wanders more than 2 points, which is most of them. A 20-point gap (85/65) is nearly flap-proof but can hold an alert open for hours after the problem has substantially passed. That erodes trust from the other direction. A useful starting rule: make the gap comfortably larger than the metric's normal short-term wiggle. Glance at a day's graph and eyeball how far the value bounces in a quiet hour. Start around 10 points for percentage metrics if you have nothing better.
The honesty clause: with hysteresis, a "resolved" notification means below the clear level, not "everything is fine." If trigger is 85 and clear is 75, resolution tells you the metric reached 74 — which may still be well above its healthy normal of 40. Anyone reading recovery notices should know they mark the crossing of a line you chose, not a certificate of health. A "resolved" message is a status, not a diagnosis. Write the clear level into the recovery message text if your tool allows it, so nobody has to remember that.
Cost: recovery is reported late, by design — and a too-wide gap can mask a genuine second incident that begins before the first one clears.
Confirmation counts: N-of-M voting
Plain words: do not alert on one bad reading; alert when several agree. The two common shapes are consecutive counts ("3 fails in a row") and N-of-M voting ("3 of the last 5 checks failed"). Both exist because single readings lie constantly. Think of a ping lost to a momentary buffer, a poll that timed out because the device was busy answering someone else. Or think of one slow response on an otherwise healthy service. Transients are the background static of any network.
The math intuition does not need probability theory — just the shapes the two rules see:
check results, oldest first (o = OK, X = fail)

momentary blip     o o X o o o o o    3-consecutive: no alert  (correct)
real outage        o o X X X X X X    3-consecutive: alert at 3rd X  (correct)
flaky-but-real     o X X o X X o X    3-consecutive: never fires  (missed!)
                                      3-of-5: fires within minutes  (correct)
The consecutive rule is a filter that passes exactly the shape real problems make (persistent failure) and blocks the shape transients make (isolated failure). But notice the third row: a link dropping half its packets keeps sneaking one OK through, defeating "3 consecutive" indefinitely while users suffer. N-of-M voting is the forgiving variant built for precisely that flaky-but-real shape — "3 of the last 5" does not need the failures to hold hands.
The interval interaction — do this arithmetic every time: confirmation multiplies your polling interval into a detection delay. Three consecutive fails at 5-minute polling means up to 15 minutes between things breaking and you hearing about it. That is a quarter hour of users discovering the outage for you. The same 3 fails at 1-minute polling costs 3 minutes. Whenever you raise a confirmation count, say the resulting worst-case delay out loud: interval × count = how long a real outage stays secret. That number is your delay budget, and it should be a decision, not an accident.
Choosing N by tier: the delay budget you can afford depends on what is on the other end of the check. A revenue-critical service ("Tier 1") deserves fast confirmation — short intervals with 2–3 confirmations, keeping worst-case detection inside a few minutes. A dev server can happily run 5 confirmations at 5-minute polling, because nobody suffers during the extra delay. Same mechanism, different dial settings, chosen by consequence.
Cost: detection delay, precisely quantified by that multiplication — plus a blind spot for outages shorter than the confirmation window. That is usually a price worth paying. A 90-second blip you could not have responded to anyway is better logged than paged.
Dwell time: "sustained for" qualifiers
Plain words: a dwell time (or duration qualifier) makes the condition true only when it stays true: not "CPU above 90%" but "CPU above 90% for 10 minutes." It is confirmation's sibling — confirmation counts discrete check results, dwell measures continuous time over a threshold — and tools often implement one in terms of the other.
Worked example: a backup job pins the file server's CPU at 100% for six minutes every night. A bare "above 90%" rule pages nightly — a false alarm with a calendar. With "above 90% for 10 minutes," the backup finishes at minute six, the timer resets, silence. When a runaway process pins the CPU for half an hour, the dwell expires at minute ten and the alert fires. It fires on a plateau, which is what trouble actually looks like.
Where dwell is the whole point: utilization metrics. CPU, memory, interface load — for all of these, spikes are normal and plateaus are problems. A CPU spike is a computer earning its salary; a CPU plateau is something wrong. For these families the duration is not an add-on to the threshold; it is half of the threshold's meaning, which is why defensible static values for utilization are always written as level-plus-duration pairs.
Cost: the dwell is a guaranteed minimum delay — a 10-minute qualifier means even the most catastrophic sustained condition is reported no sooner than minute ten. Size it to the shortest legitimate busy period it must ignore, plus a little margin, and no longer.
Flap damping for up/down checks
Plain words: the mechanisms so far tame numeric metrics. Binary up/down checks — interface status, device reachability, service running — need their own guard, because they have no gap to put hysteresis in. Flap damping watches the rate of state changes. When a check changes state too many times inside a window, the tool stops relaying each individual transition. Instead, it raises a single alert that says the honest thing — "this object is flapping."
Worked example: a switch port has a failing transceiver (the pluggable optical or copper module that the cable plugs into). The port goes down and up 20 times in an hour. Undamped, that is 40 notifications — 20 downs, 20 recoveries — and the third pair onward teaches everyone to delete them unread. With damping configured as, say, "more than 5 state changes in 10 minutes = flapping," the flood collapses to one notification: port 14 is flapping. The check is then held in the flapping state — suppressing further transition alerts — until its state has been stable for a quiet period (often 10–30 minutes). At that point, a single message reports the final state.
The un-damp discipline: damping is anesthetic, not treatment. A flapping interface is not noise to hide. It is a genuine finding: failing optics, a damaged cable, a duplex mismatch, a power problem on the far end. The "is flapping" alert deserves a ticket and an investigation exactly as a hard-down alert would. The mechanics of chasing it belong to the troubleshooting guides in Network Monitoring Fundamentals. If you find yourself damping the same port every week and never fixing it, you have not reduced noise — you have automated ignoring a hardware fault.
Cost: during the damped period you do not see individual transitions, so you lose the fine-grained timeline (your tool's state history still records it — know where to look). And a too-aggressive damping window can swallow a legitimate brief outage-and-recovery entirely.
Recovery notifications: the noise nobody audits
Half of flap noise is not alerts at all — it is the recovery messages riding along with them. Every "it's fine now" doubles the message count. Its value depends entirely on context. A recovery notice for the WAN link (the wide area network circuit out to the internet or to other sites) during business hours is useful closure. The 3 a.m. page saying a disk check has gone quiet again is an interruption with no action attached, which is the definition of noise.
Tollgate Foods had a distribution-centre switch port that went down and up four hundred times in one night. The monitoring reported this faithfully as two hundred down alerts and two hundred recoveries, every one of them sent to the pager. The transceiver had been failing for a week; the port had flapped a dozen times a night before that. And each burst had been read, muted, and forgotten by morning. On the big night the on-call engineer silenced the whole switch at 1 a.m., which also silenced the uplink that failed at 4 a.m. The review counted the messages and found that no human had read one after the thirtieth. The port now has flap damping, and recoveries go to email. And the transceiver was replaced the following afternoon, which is what the first dozen flaps had been trying to ask for.
Treat clear notifications as their own routing decision, separate from the alert's. A sane default for a small team: recoveries go to email or the dashboard, never to the pager. Make exceptions only where someone is actively holding their breath (a Tier 1 outage in progress — and that recovery usually announces itself). Combine this with the hysteresis honesty clause above — "resolved" means below the clear level, nothing more. This one routing choice then deletes a surprising fraction of total message volume without hiding a single problem. Audit it once: count last month's messages and see how many were recoveries nobody read.
Composing the toolkit: three worked checks
The mechanisms are not rivals; real checks stack them, each covering a different noise shape. Here is an end-to-end design for three checks with very different personalities:
The WAN link (up/down, Tier 1). Outage cost is high, so the delay budget is tiny: poll every minute, confirm down after 2 consecutive fails — worst case 2 minutes of secrecy. Because carrier links can bounce during far-end maintenance, add flap damping (more than 4 transitions in 10 minutes collapses to one flapping alert). Recovery notice is worth sending — people are waiting for it.
The file server disk (numeric, slow). Disks fill over days, so dwell and fast confirmation are irrelevant — a 15-minute poll with a single confirming re-check is plenty. The flap risk is boundary-dancing when usage hovers at the warning line while logs rotate, so modest hysteresis does the work: warn at 85%, clear at 80%. Recoveries to email only. Detection delay here is measured in minutes against a problem measured in days — the cheapest quiet in the whole estate.
The app response-time check (numeric, jittery, user-facing). Response times are the jitteriest metrics you own — single slow samples are routine — but sustained slowness is exactly what users feel. Stack three guards. Use N-of-M confirmation (3 of 5 checks over the trigger) to ignore lone stragglers. Add a short dwell so the condition must hold a few minutes. Use hysteresis (trigger 2 s, clear 1.2 s) so recovery is not declared on one lucky fast response. Total worst-case detection lands near 5 minutes at 1-minute polling — a defensible price for a check that would otherwise page hourly about nothing.
| Check | Confirmation | Dwell | Hysteresis | Damping | Worst-case delay |
|---|---|---|---|---|---|
| WAN link up/down | 2 consecutive, 1-min poll | — | — | >4 changes / 10 min | ~2 min |
| Disk usage | 2 consecutive, 15-min poll | — | warn 85% / clear 80% | — | ~30 min (vs days to fill) |
| App response time | 3 of 5, 1-min poll | 3 min | trigger 2 s / clear 1.2 s | — | ~5 min |
Tip: when you stack mechanisms, the delays stack too. Confirmation, dwell, and polling interval each add waiting. It is embarrassingly easy to compose a "quiet" Tier 1 check that cannot report an outage in under twenty minutes. After composing any check, add up the worst case once, on paper, and ask whether you would defend that number during a postmortem.
Every mechanism is a dial, and reviews move the dials
Nothing above is set-and-forget. Each mechanism is a dial — gap width, N and M, dwell minutes, damping window — and the first settings are educated guesses that reality will grade. The grading happens in your alert history. Boundary-dancers reveal themselves as trigger/clear pairs stacked minutes apart. A too-slow confirmation reveals itself as users reporting the outage first. A too-narrow gap shows up as the same check resolving and re-firing all afternoon.
Here is a concrete dial move, to make it real. The review finds the app response check fired nine times last quarter, six of which resolved themselves within four minutes. Diagnosis: the dwell is shorter than the app's routine garbage-collection stumbles (the brief pauses while the runtime tidies its own memory). Move one dial — dwell from 3 minutes to 5 — write the reason down, and re-grade next quarter. That is the entire craft: one dial, one reason, one follow-up.
Collecting those grades and moving the dials is a scheduled habit, not a mood — the mechanics are the subject of the quarterly threshold review. And the stakes are bigger than tidiness. Unguarded flapping is one of the fastest known routes to a team that ignores its own monitoring, the failure mode dissected in Alert Fatigue. The toolkit is how you spend a little detection delay to keep the humans listening. A human who still trusts the pager is the most valuable component in the entire monitoring stack.
The reference card
| Mechanism | Kills which noise | Costs what | Start with |
|---|---|---|---|
| Hysteresis (trigger/clear) | Boundary-dancing on numeric metrics | Late recovery reporting | Gap ~10 points, wider than normal wiggle |
| Confirmation (N / N-of-M) | One-sample transients and blips | Delay = interval × count | 2–3 consecutive; 3-of-5 for flaky-but-real |
| Dwell time | Legitimate short spikes (backups, scans) | Guaranteed minimum delay | Longest legitimate busy period + margin |
| Flap damping | Up/down transition floods | Lost per-transition detail | >4–5 changes / 10 min ⇒ one flapping alert |
| Clear-notification routing | "It's fine now" pages | Someone checks the dashboard for closure | Recoveries to email/dashboard, not pager |
Where to go next
The toolkit assumes the lines themselves are worth defending. Picking them is covered in Static Thresholds Done Right, and making the lines move with daily rhythm is its own guide. From there, the habit that keeps every dial honest lives in the quarterly threshold review, alongside the rest of Setting & Tuning Thresholds. Some metric will always find your line and dance on it. The toolkit does not stop the dancing. It stops the pager from counting the steps.
Put this into practice with SysPeep Monitor
Everything in this toolkit only works if your monitoring software exposes the dials. SysPeep Monitor supports the mechanics described here across SNMP, WMI and SSH checks. These mechanics include per-check thresholds with confirmation and duration conditions, dependencies, and alert rules built to keep noise down. The free trial installs on a Windows machine in minutes.
Download Free TrialLearn About SysPeep - All Rights Reserved.