
Beaconing: The Heartbeat of Something That Shouldn't Be There
Most of the traffic on your network is lumpy. People arrive, open things, download things, go to lunch, come back, and leave. Servers wake up for backups and settle down again. Graphs look like weather. So when one host produces a signal that looks like a metronome, it stands out like a ticking clock in a quiet room. It makes a tiny connection to the same outside address every few minutes. This happens day and night, weekend and weekday. Each connection is about the same size. That pattern is called beaconing, and it is one of the most useful things a generalist can learn to spot.
Beaconing is not automatically bad. Plenty of legitimate software checks in on a schedule. But it is the signature of a host that has been told to phone home and await instructions. And the software doing the telling is rarely something you installed on purpose. It is also nearly invisible to the tools you probably already have. A beacon is small, so it never trips a volume threshold, and it is patient, so it never looks like a burst.
This guide explains what beaconing is and how it shows up in flow data. It covers which beacons you should expect and allowlist. It also explains how to build a detection that measures regularity rather than size. By the end you will be able to describe a beacon in four numbers and sketch a query that finds candidates. You will know exactly what to do — and not do — when you find one.
In this guide
- What beaconing is
- How a beacon looks in flow data
- The legitimate beacons (and how to allowlist them)
- A detection approach: measure regularity, not size
- The jitter caveat: look at days, not minutes
- Triage: signals that raise or lower suspicion
- What to do when you find one
- Where to go next
What beaconing is
A beacon is a host checking in with an outside controller on a regular schedule. The check-in is small, often just "I am still here, any orders?" It is periodic: every few seconds, minutes, or hours. And it is persistent: it keeps going for days or months. The word comes from the navigation beacon that flashes at a fixed interval so ships know where the rocks are. On a network, the flash is a short outbound connection and the rock is a host you would rather not have compromised.
Think of a child in the back seat asking "are we there yet?" every five minutes for the whole trip. Each question is tiny and harmless on its own. What makes it notable is the relentless regularity and the fact that it never stops. A beacon behaves exactly like that: the interesting property is not any single connection but the rhythm of all of them together.
Why does unwanted software beacon at all? Because whoever planted it needs a way to send it instructions later, and they cannot connect inbound through your firewall. So the software connects outbound to a controller, asks whether there is anything to do, and, if not, disconnects and tries again after a set interval. Outbound connections are allowed almost everywhere, so the beacon blends into ordinary web traffic. From the defender's chair you do not need to know anything more about the mechanics; the rhythm is what you detect.
How a beacon looks in flow data
Flow records are the per-connection summaries your routers and firewalls can export, described in what flow data reveals. They are the natural place to see beaconing. They record who talked to whom, when, and how much, without needing to see inside encrypted payloads. In flows, a beacon shows up along four axes at once.
- Fixed intervals. The gap between consecutive connections from one host to one destination is nearly constant. Human traffic has gaps of every length; a beacon has one gap length, repeated.
- Similar byte counts. Each connection carries about the same number of bytes, because each one asks the same question and gets the same "nothing yet" answer. Human traffic sizes are all over the place.
- A long-lived relationship with one destination. The same source and the same destination, hour after hour, day after day. Most host-to-external-host relationships are brief or intermittent; a beacon's is permanent.
- Activity outside working hours. Beacons do not go home at six. Suppose a workstation talks to the same outside address at 3 AM on Sunday with the same rhythm it had at 3 PM on Wednesday. That traffic is not being driven by a person.
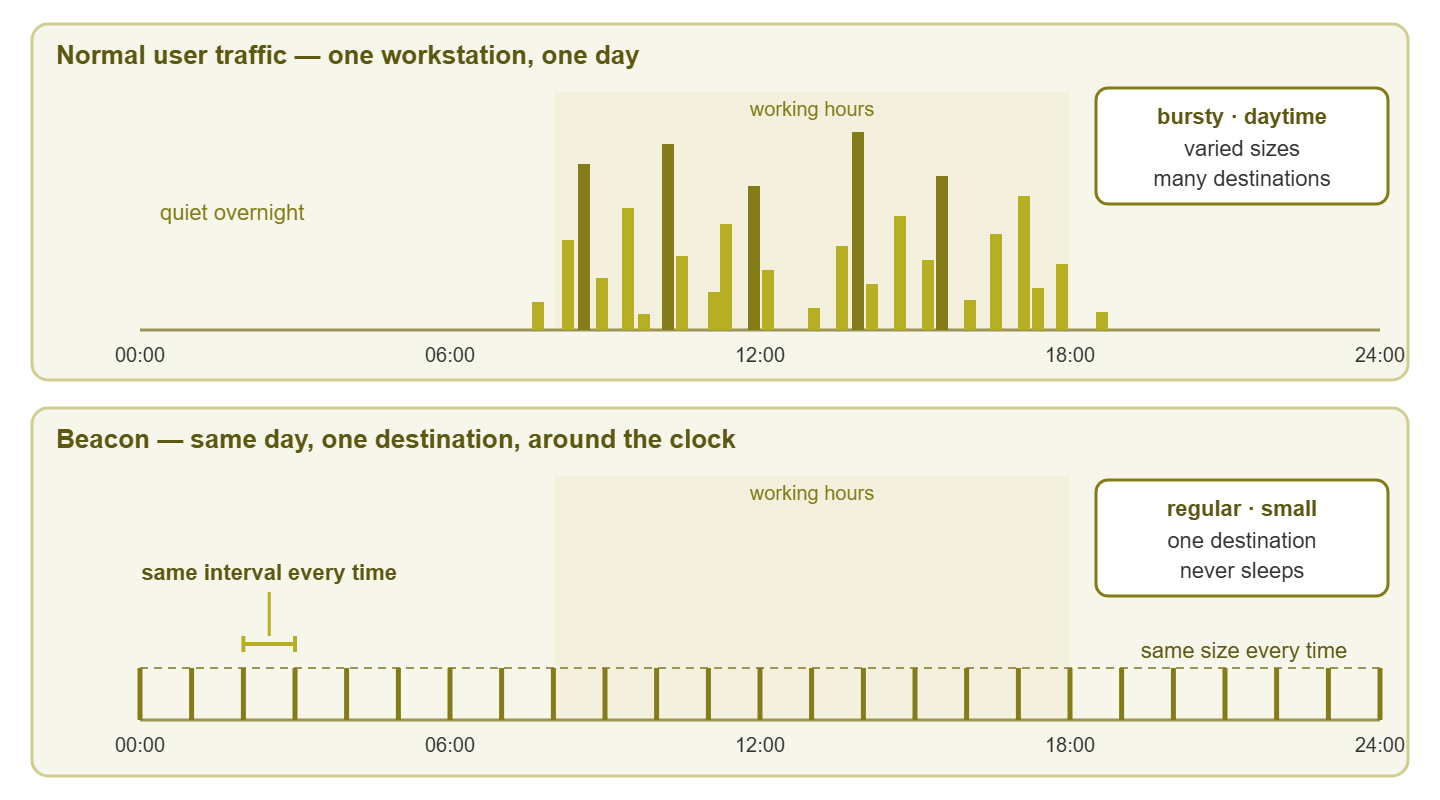
Figure 1: The same workstation, the same day. Normal traffic is lumpy and sleeps at night. A beacon is a metronome that ignores the clock and always says the same thing to the same address.
Two things about the picture deserve emphasis. First, the beacon's spikes are tiny next to the daytime bars. A rule that watches for big transfers will never see them. Second, the beacon is easiest to spot in the empty hours, when it is the only thing moving. Off-hours flow data is where beacons hide in plain sight, and it is also the quietest, cheapest data you have to analyze.
The legitimate beacons (and how to allowlist them)
Before building any detection, make peace with the fact that your network is already full of beacons you approve of. Any detection that does not account for them will drown you on day one. The usual suspects:
| Legitimate beacon | Typical rhythm | How to recognize it | How to allowlist it |
|---|---|---|---|
| Operating system and application update checks | Hourly to daily; small request, small reply unless an update is available | Destination is a vendor update service; every host of that type does the same | By destination name or published address range, per software family |
| Monitoring and management agents | Every minute to every few minutes, very regular | Destination is your own monitoring server or the management console you pay for | By destination and by the agent's known port |
| Cloud storage and sync clients | Every few minutes, plus bursts when files change | Destination is the sync provider; sizes vary when work happens | By provider address range, per approved provider |
| Chat, collaboration, and presence clients | Frequent keepalives, often every few seconds to a minute | Destination is the collaboration platform; stops when the user logs off | By platform range; note that these do usually sleep at night |
| Time synchronization | Every few minutes to hours, tiny packets | Standard time protocol port, destination is a time server | By port and by your configured time sources |
| License and telemetry check-ins | Daily or on launch | Destination is the application vendor | By destination, after confirming with the application owner |
| Printers, phones, and building devices | Varies wildly; often noisy by design | Device type from the inventory; see the chatty-device guide | By device role, not by individual address |
The allowlisting principle that matters most: allowlist by identity and purpose, not by bare IP address. "The monitoring server may beacon to its agents" is a durable rule. "Address 10.20.30.40 is fine" is a rule that goes wrong the day that address is reassigned. It also hides anything else the host at that address decides to do. Where you can, scope each allowlist entry to a destination and a port and a source role. The tuning guide in this topic goes deeper on identity-based allowlisting. Building devices that beacon loudly get their own treatment in chatty device detection.
Tip: the best time to build your allowlist is before you turn a beacon detection on. Run the detection in log-only mode for a week, sort the candidates by destination, and work down the list resolving each known-good source. What remains after that week is your real starting queue — usually short, and usually interesting.
A detection approach: measure regularity, not size
The core idea is simple. For each pair of source host and external destination, look at all the connections over a window. A day is a good start. Ask how regular they are. Regularity has two parts — the timing between connections, and the size of each one — and each can be summarized with a single number.
Conceptually, the steps are:
- 1. Group flow records by source host and destination address (and destination port, if you have it).
- 2. Count the connections in each group. Ignore groups with only a handful; a beacon by definition repeats many times.
- 3. Compute the gaps between consecutive connection start times within each group, then the average gap and how much the gaps vary around that average.
- 4. Compute the size variation: the average bytes per connection and how much individual connections deviate from it.
- 5. Score each group: many connections, low timing variation, low size variation, and presence in off-hours all push the score up.
- 6. Subtract the allowlist, then sort what remains by score and review the top of the list.
A useful measure for "how much does it vary" is the coefficient of variation: the standard deviation divided by the mean. It is dimensionless. So a beacon with a ten-second interval and one with a ten-minute interval both score near zero if their timing is steady. Human traffic scores high. You do not need to be a statistician to use it. You need a database that can compute a standard deviation, which nearly all of them can.
Here is an illustrative sketch of that logic as pseudo-SQL. It assumes a table of flow records with a start time, source, destination, and byte count. Treat it as a diagram of the idea, not a finished script — your schema and your flow collector will differ.
-- Illustrative beacon-candidate sketch, one day of flows
WITH gaps AS (
  SELECT src_host, dst_addr, dst_port, bytes,
         start_time - LAG(start_time) OVER (
           PARTITION BY src_host, dst_addr, dst_port
           ORDER BY start_time) AS gap_seconds
  FROM   flows
  WHERE  start_time >= now() - interval '1 day'
    AND  dst_is_external = true
)
SELECT src_host, dst_addr, dst_port,
       COUNT(*)                            AS connections,
       AVG(gap_seconds)                    AS avg_gap,
       STDDEV(gap_seconds) / AVG(gap_seconds) AS gap_cv,
       AVG(bytes)                          AS avg_bytes,
       STDDEV(bytes) / AVG(bytes)          AS size_cv
FROM   gaps
WHERE  gap_seconds IS NOT NULL
GROUP  BY src_host, dst_addr, dst_port
HAVING COUNT(*) >= 24
   AND STDDEV(gap_seconds) / AVG(gap_seconds) < 0.2
   AND STDDEV(bytes) / AVG(bytes) < 0.3
ORDER  BY gap_cv, size_cv;
Reading it: gap_cv near zero means the host connects like clockwork; size_cv near zero means it says the same thing every time. The thresholds in the HAVING clause are starting points, not truths. Loosen them if you see nothing, tighten them if the list is long, and expect to adjust them per network. A candidate that survives this filter and is not on the allowlist is worth ten minutes of your attention.
If you have no flow collector and no database, you can still approximate this with firewall connection logs and a spreadsheet. Filter to one source host, one destination, and sort by time. Subtract consecutive timestamps in a column, and look at the result. If the column is full of the same number, you have found a rhythm. It is slower, but the reasoning is identical, and doing it by hand once makes the automated version make sense.
The jitter caveat: look at days, not minutes
Some beacons do not tick perfectly. The software may add a random delay to each interval, or vary the size of each check-in. This is precisely so that a simple "same gap every time" filter misses it. This is called jitter, and it is the reason the detection above should never be your only view.
The defense is patience and aggregation. A jittered beacon is irregular minute to minute but still regular over a day. It still produces roughly the same number of connections every hour, still talks to the same destination, and still never sleeps. It still carries a narrow range of sizes rather than a wide one. So widen the lens:
- Count connections per hour for each source-destination pair and look for a flat line across all twenty-four hours. Human traffic has a daytime hump; a beacon is level, jitter or not.
- Compare weekday to weekend. A relationship that carries the same connection count on Sunday as on Tuesday is not driven by a person.
- Look at the relationship's age. Has this pair been talking every single day for three weeks? Most external relationships are not that loyal.
- Loosen the variation thresholds and tighten the count. A pair with a thousand connections in a week and moderately variable timing is still a candidate; the volume of repetition compensates for the noise.
The trade-off is honest: a wider lens means more legitimate software looks beacon-like too, so the allowlist has to be in good shape first. But the longer the window, the harder it is for randomness to disguise persistence. Jitter hides the tick; it cannot hide the fact that the clock never stops.
Triage: signals that raise or lower suspicion
A candidate on the list is a question, not an answer. Run it through the same who-what-when-where questions from what counts as an anomaly, with a few beacon-specific weights:
| Signal | Pushes suspicion up | Pushes suspicion down |
|---|---|---|
| Source role | A workstation, printer, or camera with no business talking outside on a schedule | A monitoring server, a sync-enabled laptop, an update distribution host |
| Destination | A bare address with no name, a newly seen destination, a hosting range nobody else on the network uses | A recognized vendor, cloud, or collaboration service that other hosts also use |
| Peers | Only one host on the network has this relationship | Every host of the same type has the same relationship |
| Hours | Identical rhythm at 3 AM and 3 PM, weekends included | Stops when the user logs off or the laptop closes |
| History | Started on a specific recent day, with no change record | Present since the host was built, matches an installed application |
| Sizes | Occasional larger connections mixed into the tiny ones (something was fetched) | Sizes track a known behavior, such as an update that was actually installed |
One practical check resolves many candidates fast: look at the host itself. Which installed program or service owns the connection? On most operating systems, a built-in command lists active connections along with the process that opened them. The answer — a recognizable agent, or nothing you recognize at all — is often decisive. Do this on the host you own, with your normal administrative access; it is inspection, not investigation, and it stays firmly within your remit.
What to do when you find one
Suppose a candidate survives triage: a desktop with no legitimate reason, talking every ninety seconds to an address nobody else uses, since last Thursday, all night. What now? Your job from the defender's chair is containment and preservation, not investigation of the far end. In order:
- 1. Do not touch the destination. Do not browse to it, ping it, or "just check" from your workstation. Anything you send tells the far end that someone is looking, and it adds your machine to the list of hosts that have talked to it.
- 2. Capture the metadata now. Export the flow records for that source-destination pair for as far back as you have them. Note the first-seen time, the interval, the sizes, the port, and any larger connections mixed in. Save it somewhere the host cannot reach.
- 3. Isolate the host according to your incident process. Use a quarantine VLAN, a switch port shutdown, or a firewall rule that blocks it from everything except the tools responders need. Prefer isolation over powering off, because powering off destroys what is in memory and responders may want it.
- 4. Preserve, do not clean. Resist the urge to reinstall or run a cleanup tool before someone has looked. Once it is wiped, nobody can learn how it got there or what else it touched.
- 5. Escalate to whoever owns security response. That may be an internal team, a contracted provider, or, in a small shop, the most senior technical person. Attach the metadata and a one-paragraph timeline.
- 6. Look for siblings. Query the same destination across every host. Beacons rarely travel alone, and the second host is often the more important one.
- 7. Feed the lesson back. Whether it turns out to be an intrusion or an obscure update agent, record the outcome and adjust the allowlist or the score accordingly.
Notice that nothing on that list requires you to understand what the far end is or how the software works. Detection is about rhythm; response is about containment and evidence. Both are well within a generalist's reach, and doing them calmly and in order is worth more than any amount of heroics.
Where to go next
You now know beaconing by its four properties: fixed interval, similar size, one loyal destination, and no respect for office hours. You know that the way to catch it is to measure regularity rather than volume. You have a query sketch that finds candidates and a table of legitimate beacons to clear first. You also have a wider lens for the jittered ones and a calm, defensive playbook for the one that turns out to be real.
Beaconing is one of several patterns in the Detecting Traffic Anomalies topic. Its close cousin is internal scanning. That is where a host starts reaching out to many neighbors at once instead of one controller on a schedule. The two often appear on the same host in sequence. And if the list of candidates ever grows beyond what one person can review, turn to the guide to detection and response concepts. It explains what dedicated tooling adds on top of the query you just built.
Put this into practice with SysPeep Monitor
Spotting a beacon depends on having clean, continuous traffic history to look back through. SysPeep Monitor collects interface traffic and device health around the clock from a single Windows service. It keeps that history in a database you choose and shows you the off-hours patterns on live dashboards and reports. So the metronome in the quiet room is something you can actually see. The free trial takes minutes to install.
Download Free TrialLearn About SysPeep - All Rights Reserved.