
Deduplication and Grouping: Turning Forty Emails Into One Alert
A switch dies at 2 a.m. By 2:10 there are forty-three emails in the on-call inbox, and not one of them says "the switch died." They say the file server is unreachable, and the print server, and twenty-two workstations, and the camera system. Every device that lived behind the dead switch is reported separately, then reported again five minutes later. The monitoring system is not wrong about any of it. It is saying one piece of news forty-three times, at a volume that guarantees the news gets skimmed instead of read.
Volume is the fuel of alert fatigue, and most of the volume in a noisy setup is not forty different problems. It is the same news repeated. I have audited inboxes where most messages were a copy of a message already in the inbox. The owner had never noticed, because nobody reads the copies. Repetition is the cheapest noise to remove, because nothing of value is lost when you stop repeating yourself. One tool is deduplication, which collapses several notifications about the same fact into one. The other is grouping, which bundles related facts into one readable message instead of a message apiece.
This guide gives you the working method: the five patterns by which monitoring repeats itself and the collapse mechanism for each. It explains how to design the grouped messages so they stay readable and what to look for in whatever monitoring platform you run. It also covers the before-and-after arithmetic that shows how far this one discipline goes. No heroics required — mostly it is configuration you already have, pointed in the right direction.
In this guide
- One piece of news, one interruption
- The five repetition patterns
- The opening storm, annotated
- Designing the grouped view
- What to ask of your platform
- The payoff, measured
- The dedup design worksheet
- Where to go next
One piece of news, one interruption
Every notification spends a little of a finite resource: human attention. When the same fact is delivered five times, it makes five withdrawals and pays out once. Worse, repetition actively teaches people to ignore alerts. The second identical email is the first lesson in skimming, and by the twentieth the lesson is learned for good. Repeated news does not add certainty. It subtracts attention.
So the design goal is simple to state: each change in the world earns at most one interruption, sized to fit the news. One disk crossing a threshold is one notification. One dead switch is one incident message, however many devices sit behind it. Everything else — every poll result, every repeat observation, every downstream symptom — still gets recorded, in the console and the history. You can drill into it there during the investigation. Deduplication deletes deliveries, never data. Keep that distinction handy, because it answers the objection you will hear most: "but I want to know everything." You will know everything. You just will not be interrupted for everything.
The five repetition patterns
Nearly all duplicate volume comes from five recognizable patterns. Learn their names and your alert history starts reading like an X-ray. You can see exactly where the noise is manufactured, and each pattern has a specific, well-understood collapse mechanism.
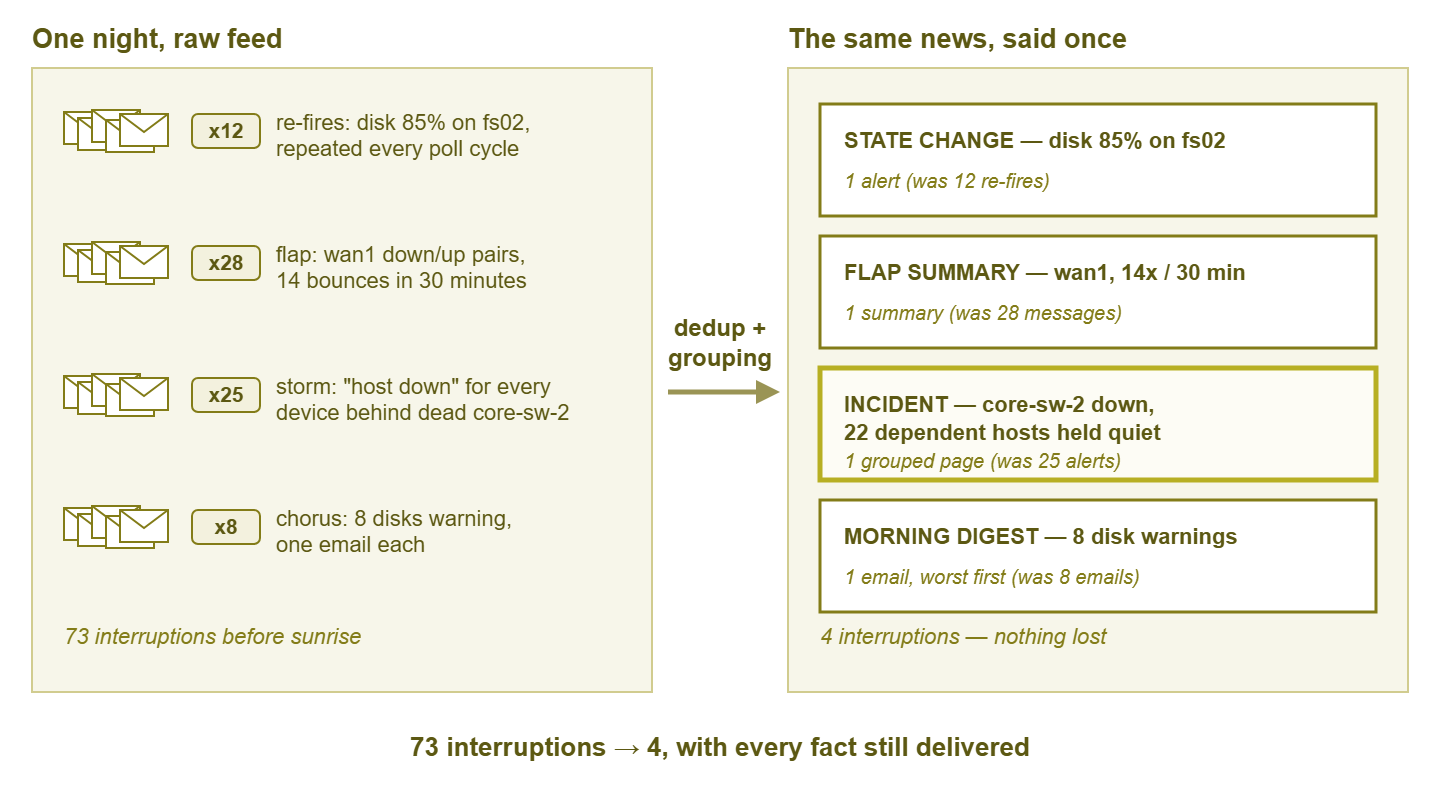
Figure 1: The same night, said twice. Every fact on the left still exists on the right — delivered once, at the right size.
1. The re-fire
Monitoring works by polling — checking each condition on a schedule, typically every one to five minutes. A naively configured alert fires every time the check runs and the condition is still true. Disk at 85%, polled every five minutes, is 288 emails a day carrying the news value of exactly one. The fix is to alert on state change, not state. That means one notification when the disk crosses from OK to warning, one when it recovers, and silence in between. Nearly every monitoring tool can do this; surprisingly many are not configured to. Pair it with a deliberate reminder policy for things that stay broken: a re-notification at a sane interval. That could be every few hours, or when the problem worsens, say 85% becoming 95%. That way, an open problem cannot quietly age into the wallpaper. The line between a reminder and a re-fire is intent. A reminder arrives about as often as you would genuinely re-decide what to do; a re-fire arrives every time the poller wakes up.
Tollgate Foods learned the cost of the re-fire the slow way. A warehouse file server crossed its disk threshold in the spring. The alert was configured to fire on every poll and did so every five minutes for the next seven months. Meanwhile, the purchase order for a bigger disk moved through three approvals. Everyone on the team had a mail rule for it by the second week. When the disk finally filled and the label printers stopped, the message announcing it was roughly the sixty-thousandth with that subject line. It looked exactly like the ones before it. The mail rules filed it with the others. The warehouse found out from the printers.
2. The flap
A flap is a check bouncing between states — an interface or service going down, up, down, up, often around some marginal threshold or a failing cable. Each direction generates a message, so fourteen transitions in half an hour is twenty-eight notifications, arriving in maddening problem/recovery pairs that each cancel the last. Two mechanisms tame it. At the threshold level, hysteresis and confirmation stop the borderline dance before it starts. They use separate trigger and clear levels, and require a condition to hold for more than one poll. That deserves its own guide, and has one in hysteresis and confirmation. At the notification level, flap damping catches whatever gets through. When an object changes state too often in a window, the tool holds individual notifications and sends one summary instead. For example, "wan1 flapped 14 times in 30 minutes" is both quieter and more informative, because "flapping" is itself the diagnosis.
3. The shotgun
One cause, many symptoms: the dead switch and its forty-three downstream unreachables, the full storage volume that fails a dozen application checks at once. The cure has two halves. The suppression half is dependency awareness: teach the tool that those hosts sit behind that switch (a parent-child relationship). When the parent is down the tool holds the children's alerts, because they carry no independent news. The reasoning discipline behind that — root cause versus symptom — is a deep subject with its own pillar at Alert Correlation. The half that belongs to this guide is grouping: whatever the tool cannot suppress, it should bundle. Related alerts landing inside the same short window are delivered as one incident notification: "core-sw-2 down; 24 dependent hosts unreachable," with the list inside. One interruption, and it names the actual problem.
4. The same-class chorus
Eight disks drift past 80% in the same week and produce eight separate interruptions, none of them urgent. The real news is not any single message: it is the pattern — "storage is filling across the fleet" — and eight singletons actively hide it. The fix is digest grouping: same-type, non-urgent warnings collected into one periodic message that lists all eight with their numbers. One email a day saying "8 disk warnings, worst first" beats eight emails saying "a disk warning." That means less noise and more insight, which is the trade you always hope for and rarely get.
5. The multi-channel echo
One alert sent to email and the chat channel and a phone push is one piece of news experienced three times. Each channel interrupts separately, tripling the perceived dose without adding a syllable. The fix is channel roles: each channel gets a distinct job, decided by urgency. The page interrupts for act-now problems; the ticket or chat message queues work for later; the digest carries awareness items. One alert, one channel, chosen by severity. Assigning those roles properly is really a routing-policy question, and it is treated fully in Quiet Hours and Response Tiers.
The opening storm, annotated
Go back to the 2 a.m. switch failure from the top of this guide and read it again with the pattern names on. Here is a slice of that inbox, each line tagged with the pattern that manufactured it:
02:03  HOST DOWN core-sw-2                the actual news
02:03  HOST DOWN fs01                     [3] shotgun — behind the switch
02:03  HOST DOWN prn01                    [3] shotgun
02:03  HOST DOWN cam-nvr                  [3] shotgun
02:04  ...19 more HOST DOWN               [3] shotgun
02:05  same alert, chat copy (x23)        [5] channel echo
02:08  HOST DOWN fs01                     [1] re-fire, next poll cycle
02:08  ...22 more repeats                 [1] re-fire
02:11  HOST UP / HOST DOWN wan1 (x6)      [2] flap — unrelated, bad timing
Forty-three messages; one carries news. Now replay the night with the collapse mechanisms in place. Dependencies recognize that everything behind core-sw-2 is a child of the switch, so the twenty-two downstream alerts are held. State-change alerting means nothing re-fires at 02:08. Channel roles mean the page goes to the phone and nowhere else. Flap damping folds the WAN bounce into one summary line. The on-call phone receives exactly two interruptions: "core-sw-2 down — 22 dependent hosts unreachable" at 02:04, and a flap summary that can frankly wait for morning. The engineer wakes up knowing what broke, instead of deducing it from forty-three symptoms while half asleep. That is the entire promise of this guide, compressed into one bad night.
Designing the grouped view
Collapsing repeats is half the craft. The other half is making the collapsed messages good, because a grouped notification that nobody can scan is just a different shape of noise. Three design tools cover most situations.
Time-window bundling. When a significant alert fires, hold the related alerts that follow within a short window — a few minutes is typical — and deliver them as one bundle. The honest tradeoff: bundling delays part of the picture by those few minutes. So bundle the followers, never the leader — the triggering alert goes out immediately, and the window only decides what rides along with the next update. For anything below page-severity, a few minutes of delay costs nothing at all.
Entity grouping. Roll related alerts up by what they belong to — a site, a service, a cluster. "Branch office: 6 alerts" as a single notification, with the detail inside, respects the reader's actual decision process: first whether to engage, then how deep. The rollup answers the first question in five words; the detail waits until it is wanted.
All-clears that match their alerts. Recovery notifications deserve a deliberate policy too, because they can double your volume all by themselves. The rule of thumb: an all-clear travels the same road as its alert, one step quieter. A paged outage earns a recovery message — the on-call engineer genuinely needs to know it ended. A warning that went to the ticket queue can close the ticket silently. And digest-grade items should never send individual recoveries at all; "resolved" is just a section in tomorrow's digest. Send recoveries for trivia and a quiet week doubles its own volume without adding a single fact.
The daily digest, done well. The digest is the home for everything that deserves awareness and no interruption — and it lives or dies on formatting. A 400-line dump of yesterday's events is fatigue with a bow on it. A good digest is short, sectioned, sorted worst-first, and built around counts and deltas — what is new, what got worse, what resolved:
MORNING DIGEST — infrastructure (yesterday 06:00 → today 06:00)

NEW (2)
  disk 81% on fs02 D:            was 79% last week
  cert mail.example expires 26d

STILL OPEN (3, worst first)
  disk 91% on db01 E:            +2% since yesterday
  disk 84% on fs02 C:            unchanged, 11 days open
  UPS-2 battery health degraded  replacement ordered

RESOLVED (4)  ...listed one line each

totals: 5 open / 2 new / 4 resolved — full detail in console
Thirty seconds to read, and it carries more usable information than the fifteen individual emails it replaced. The deltas matter most: "+2% since yesterday" turns a static complaint into a trend you can schedule work against.
Tip: give every digest a fixed arrival time and a fixed shape. Never let it be empty — send "nothing new, 3 still open" rather than nothing. A digest that arrives erratically or only on bad days trains people to dread it. One that arrives at 06:30 looking the same every day becomes part of the morning coffee. That is exactly the level of alarm it should carry.
What to ask of your platform
Deduplication and grouping features vary a lot between monitoring tools, and they hide under different names. So rather than a tool list, here is the capability checklist. Whatever you run, or evaluate, walk through it asking "where is this setting?":
- State-change alerting as the default behavior — notify on transitions, not on every poll while a condition holds.
- Configurable reminders for still-open problems — you choose the interval, and escalation on worsening.
- Flap detection — the tool notices rapid state cycling and summarizes instead of relaying every bounce.
- Dependencies — parent-child relationships between devices, so a dead router mutes the alerts for everything behind it.
- Notification batching — some form of time-window or per-entity grouping for related alerts.
- Scheduled summaries — a digest, scheduled report, or saved view that can be delivered periodically.
- Per-severity channels — routing rules that send different urgencies to different channels, so the echo pattern is preventable.
Missing features are not a dead end, because process can stand in for most of them. No flap damping? Hysteresis at the threshold layer removes most flapping at the source. No digest engine? A scheduled report of open warnings, or even a saved console view reviewed at a fixed time each morning, is a hand-rolled digest that works fine. No batching? Strict severity discipline plus one shared triage channel — instead of every alert landing in every personal inbox — cuts perceived volume dramatically on its own. The design matters more than the engine; a modest tool configured with these five patterns in mind will out-quiet a fancy one left on defaults.
The payoff, measured
Here is the arithmetic from a composite but entirely realistic small shop. Call it one admin, two sites, a normal week that included one switch failure and one flappy WAN link. The point of the table is not the exact numbers. It is that each row is just one of the five patterns, collapsed by its standard mechanism.
| Pattern | Before (week) | Mechanism applied | After (week) |
|---|---|---|---|
| Re-fires (disk, CPU, cert repeats) | 130 notifications | State-change alerting + 4-hour reminders | 10 |
| Flapping WAN interface | 60 | Hysteresis + flap summaries | 6 |
| Switch failure storm (downstream hosts) | 70 | Dependencies + one grouped incident | 3 |
| Same-class warnings (disks, certs) | 25 | One daily digest | 7 digests |
| Channel echo (email + chat copies) | 15 duplicate copies | Channel roles | 0 |
| Genuinely distinct single alerts | 14 | Left alone | 14 |
| Total interruptions | 314 | 40 |
Three hundred and fourteen interruptions become forty, and the information content of the week is identical. Every underlying event is still recorded, still graphed, still there in the console for the investigation. What changed is how many times a human was interrupted to be told. And notice the last row: the fourteen real, distinct alerts were untouched by any of this, but they are the true beneficiaries. In a week of 314, they were fourteen lines in a wall of repeats. In a week of 40, every one of them gets read.
The dedup design worksheet
To turn this into a working session, take your last month of alert history and fill in one row per pattern. Find the tell, pick the mechanism, and write the policy down where the team can see it. A policy of "state changes only, reminders every 4 hours" is short enough to remember and specific enough to configure.
| Pattern | Tell in your alert history | Collapse mechanism | Policy to write down |
|---|---|---|---|
| Re-fire | Identical alert, metronome timing, every poll cycle | State-change alerting; deliberate reminder interval | Notify on transition; remind every ___ hours while open |
| Flap | Problem/recovery pairs, minutes apart, same object | Hysteresis + confirmation; flap summaries | Trigger/clear gap of ___; summarize > ___ transitions per ___ min |
| Shotgun | Burst of different alerts, same moment, same segment | Dependencies; grouped incident notification | Parent-child map maintained; bundle followers within ___ min |
| Same-class chorus | Same warning type across many devices, days apart | Digest grouping | Non-urgent warnings of type ___ go to the ___ digest |
| Channel echo | Same alert, several channels, same minute | Channel roles by severity | Critical → page; warning → ticket/chat; info → digest |
Where to go next
Deduplication and grouping are the biggest volume win in the alert fatigue toolkit, and they work best in company. Measure your starting noise first with the one-week audit in Diagnosing Alert Fatigue. Some of what you are about to collapse should be removed outright, and that judgment call is The Courage to Delete Alerts. Channel roles and after-hours behavior get their full treatment in Quiet Hours and Response Tiers. The deeper work of tying symptoms to causes lives in Alert Correlation. The switch will die again one night. The only question is whether it sends one message or forty-three. The rest of the campaign against noise is collected in the Alert Fatigue pillar.
Put this into practice with SysPeep Monitor
The dead-switch storm is the classic test of a monitoring tool's manners. SysPeep Monitor's dependency rules exist for exactly that case. When a parent device goes down, the alerts for everything behind it stay quiet. SysPeep Monitor's thresholds and alert rules are designed to keep the rest of the noise down too. Try it against your own network with the free trial.
Download Free TrialLearn About SysPeep - All Rights Reserved.