
Healthy Signs: How to Tell Your Monitoring Practice Is in Good Shape
Most of what makes a monitoring practice good never appears in a number. You can have a flawless availability figure and a team that dreads the phone. You can have a low alert count because someone muted the channel in the spring. The numbers in the rest of this pillar are honest and worth computing. And they still cannot tell you whether a new starter could find out what a check means, or whether anyone has ever restored the archive. Those are behaviours, and behaviours have to be described in words.
This guide describes them. It walks through eight areas of a monitoring practice. For each one, it says what health looks like and what trouble looks like, in sentences you can check against your own week. Then it gives you a self-assessment worksheet with a three-point scale and a way to run it in an hour with two people. It also gives you a rule for what to do with the result that involves no comparison with anyone else at all.
There is no maturity model here with levels and badges, and no score that means "industry standard". The scale is yours, the reference is you six months ago, and the only benchmark is whether the zeros are turning into ones.
In this guide
- Health is a set of behaviours, not a number
- The eight areas and the signs in each
- The wheel: what a practice looks like drawn
- The self-assessment worksheet
- How to run it
- What to do with a low score
- A war story and a checklist
- Where to go next
Health is a set of behaviours, not a number
A monitoring practice is everything around the monitoring tool. The practice covers who looks at the tool, what they do when it speaks, and how it is kept current. It also covers how the organisation uses what the tool produces. The tool is a small part of this. A well-configured tool inside a poor practice produces alerts nobody answers and reports nobody reads. And I have seen that combination more often than the reverse. The practice is the thing to assess, and a practice is made of habits.
Habits show up as signs. A sign of health is something you could observe on an ordinary Tuesday that indicates the habit is present. A new server appeared in the monitoring before its first user logged on, say. A sign of trouble is the observable opposite. Neither needs a number, and both are harder to fake than a number, which is the point. A percentage can be adjusted by changing a definition. "The archive has been restored once" is either true or it is not.
One thing this guide is not about is the network's own metrics. Whether a link's latency or packet loss is reasonable is a different question with a different answer, and Healthy Network Metric Ranges covers it. Here we are assessing the people and the routine, not the cables.
The eight areas and the signs in each
Coverage
Coverage is whether the things that matter are monitored at all. The sign of health is that new systems are monitored before they go live, as a step in the build rather than an afterthought. Another is that when a coverage review happens it finds little. There is a printer here, a test box there, nothing that would have made the phone ring. The sign of trouble is discovering an unmonitored production system during an outage, which is the most expensive way to run a coverage review. Monitoring Coverage Reviews describes how to do the review deliberately. The sign to look for here is simply whether it happens and what it turns up.
Alert quality
Alert quality is whether an alert, when it arrives, is worth the interruption. The sign of health is that most alerts lead to an action. That means someone did something because of the alert, even if the something was "checked and closed with a reason". The sign of trouble is that the alert channel has been muted, filtered into a folder, or moved to a phone that lives in a drawer. If you want to measure the quality rather than observe it, Diagnosing Alert Fatigue has the method. The observation, though, is usually enough. Ask who reads the alerts. If the answer takes more than a second, you have your score.
Response habits
Response habits are what people do in the minutes after an alert. The sign of health is that alerts are acknowledged by a named person, who either resolves the problem or hands it on. And the alert history shows the acknowledgement. The sign of trouble is alerts that are ignored until they clear on their own. That teaches everyone that ignoring works, right up until the one that does not clear. If your monitoring exports alert history with an acknowledgement column, counting the unacknowledged ones is a one-line check:
Import-Csv .\alerts.csv |
  Where-Object { -not $_.AcknowledgedBy } |
  Measure-Object |
  Select-Object Count
Compare that count with the total, and compare it with the same count last quarter. The direction matters more than the value. Column names vary by product, so check the export before trusting the script.
Documentation
Documentation, for a monitoring practice, means that the meaning of a check and the response to its alert are written down somewhere findable. The sign of health is that a new starter, given the name of a check, can find what it monitors. They can find why the threshold is where it is and what to do when it fires. They can do all that without asking the person who set it up. The sign of trouble is that the knowledge lives in one head, and that head is on holiday. The test is not whether documentation exists. It is whether someone who did not write it can find it in five minutes. (Most documentation exists. That is rarely the problem.)
On-call load
On-call load is what carrying the phone costs the people who carry it. The sign of health is that people sleep, that the rota is shared fairly, and that nobody dreads their week. The sign of trouble is a phone that goes off most nights and a rota that always seems to land on the same person. There is also the quiet conversation about whether this job is worth it. Humane On-Call is the guide to fixing it. The sign to score is how the people on the rota talk about it when the manager is not in the room.
Review cadence
Review cadence is whether thresholds, dashboards, and trends are looked at on a schedule rather than when something breaks. The sign of health is that the reviews are on a calendar and they happen. And they produce changes: a threshold moved, a dashboard panel deleted, a capacity item raised. The sign of trouble is a review that has been "next month" for a year, or one that happens and changes nothing. That is a meeting wearing a review's clothes. If you keep action items from post-incident reviews, the same discipline applies, and Post-Incident Action Items That Get Done covers making them stick.
Data care
Data care is looking after the monitoring's own data: the database it writes to, the history it keeps, and the backups of both. The sign of health is that retention has been decided and written down. The database is not full, and somebody knows how full it is. The archive or backup has been restored at least once to prove it can be. The sign of trouble is a database on a disk nobody has checked since the install. Another is a backup that has never been tested because testing it seemed like tempting fate. A quick look at the free space on the monitoring server's drives is the smallest piece of evidence you can collect:
Get-PSDrive -PSProvider FileSystem |
  Select-Object Name, @{n='FreeGB';e={[math]::Round($_.Free/1GB,1)}}
Write the number in the evidence column, then write the date the archive was last restored beside it. If that date is blank, the score for this area is decided.
Management relationship
The management relationship is whether the people who fund the practice understand what it does. The sign of health is that the monthly one-pager is read and questions come back about it. And the last budget case was decided on evidence from the monitoring rather than on who spoke last. The sign of trouble is a report nobody has replied to in a year and a budget cycle that runs on anecdotes. The guides under Translating Monitoring Data for Management are about building this relationship; the sign to score is whether it exists.
The wheel: what a practice looks like drawn
Eight areas, each scored from zero to two, draw naturally as a wheel with eight spokes, and the drawing is more honest than a total. A total of nine could be a practice with nine ones, which is fine. Or it could be a practice with four twos and four zeros, which is a very different situation with the same score. The shape shows the difference. The figure below is an example with fictional scores: strong coverage and alert quality, middling everywhere else, and two areas at zero.
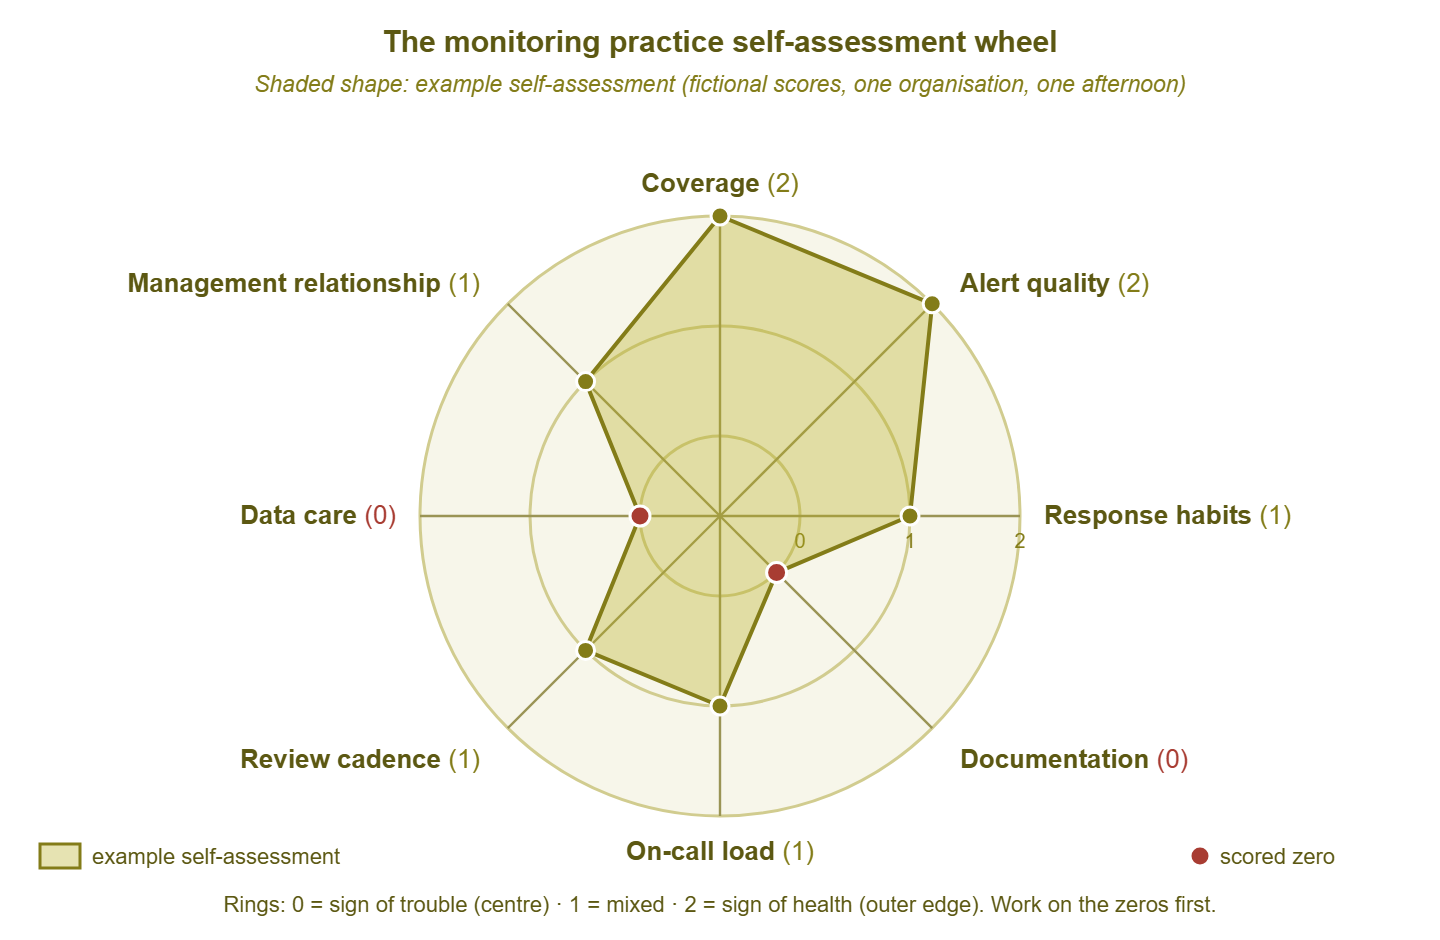
Figure 1: The self-assessment wheel. The shaded shape is a fictional example: strong on coverage and alert quality, weak on documentation and data care. The dents are where the work is.
That shape is common, and it tells a story. A team that scores two on coverage and alert quality has done the hard technical work. The right things are monitored and the alerts are worth reading. The zeros on documentation and data care are the parts of the job that never page anyone, so they never get done. The wheel does not say the team is bad. It says where the next quarter goes.
The self-assessment worksheet
The worksheet is the eight areas as a table, with the signs beside each. It has two columns for you to fill: an honest score and the evidence for it. The score is 0, 1, or 2. Two means the sign of health is plainly present. Zero means the sign of trouble is plainly present. One means mixed, partial, or "it depends who you ask". The evidence column is what stops the scores drifting upward; a two with an empty evidence cell is a one.
| Area | Sign of health | Sign of trouble | Score (0–2) | Evidence |
|---|---|---|---|---|
| Coverage | New systems are monitored before go-live; the coverage review finds little. | An unmonitored production system is found during an outage. | [ ] | [date of last review; what it found] |
| Alert quality | Most alerts lead to an action; the channel is read by named people. | The channel is muted, filtered, or in a drawer. | [ ] | [who reads it; last quarter's alert count per person] |
| Response habits | Alerts are acknowledged by a person and resolved or handed on. | Alerts are ignored until they clear on their own. | [ ] | [unacknowledged count vs total, last quarter] |
| Documentation | A new starter can find what a check means and what to do in five minutes. | The knowledge lives in one head. | [ ] | [name of the check tested; who tried; how long it took] |
| On-call load | People sleep; the rota is fair; nobody dreads their week. | The phone goes off most nights; the rota lands on one person. | [ ] | [night alerts last month; rota distribution] |
| Review cadence | Threshold, dashboard, and trend reviews are on a calendar, happen, and change things. | The review is always next month, or happens and changes nothing. | [ ] | [date of last review; what changed because of it] |
| Data care | Retention is decided and written; the database is not full; the archive has been restored once. | The disk has not been checked since install; the backup has never been tested. | [ ] | [free space; retention document; date of last test restore] |
| Management relationship | The monthly one-pager is read; the last budget case was decided on evidence. | No reply to a report in a year; budgets run on anecdotes. | [ ] | [last reply received; how the last case was decided] |
Scoring is deliberately simple: count the twos, and work on the zeros first. That is the whole scoring system. If the worksheet lives in a spreadsheet with the scores in column D, the two counts are one formula each:
Areas scoring 2 (healthy):   =COUNTIF(D2:D9,2)
Areas scoring 0 (trouble):   =COUNTIF(D2:D9,0)
There is no pass mark and no industry figure to compare the count of twos against, and there will not be one. The count of twos is a number you compare with your own count six months ago. The zeros are a list of work.
Tip: score the evidence, not the intention. "We are about to write the runbooks" is a zero with a plan attached, and the plan goes on the roadmap, not in the score. The worksheet is only useful if the next one can be compared with it, and intentions do not compare.
How to run it
The self-assessment takes an hour, two people, and a willingness to write down things that are slightly embarrassing. You need two people because one person marks themselves generously in the areas they own and harshly in the ones they resent. The second person evens it out. If you are a department of one, borrow someone. The person who most recently joined the organisation is ideal, because they are the new starter the documentation row is about.
- Book an hour with the door shut. Not the end of a day, not during an incident, not with the manager present for the first run.
- Collect the evidence beforehand. The alert history export, the date of the last coverage review, the free space on the server, the date of the last test restore. Ten minutes the day before saves the hour turning into a search.
- Go through the eight rows in order. Each person says their score and their reason before the other speaks. Disagree by a point? Take the lower one and write down why.
- Fill the evidence column for every row, including the ones you scored two. Especially those.
- Draw the wheel. A sketch on paper is fine. The shape is the summary.
- Date it and file it with the monthly report, and book the next one for six months' time before you leave the room.
The second run is where the value appears. The first one tells you where you are, which you half knew. The second tells you whether anything moved, which nobody knew. And a zero that became a one is the most satisfying line in any report I have written.
What to do with a low score
A zero is a piece of work, and it goes on the roadmap with a date and a name. The natural home is the plan described in A Twelve-Month Network Monitoring Roadmap. There, "documentation: zero" becomes "runbooks for the top twenty checks by the end of the quarter". There, "data care: zero" becomes "test restore of the monitoring database, written up, by the end of next month". A zero that does not become a roadmap item will be a zero at the next self-assessment too.
Do not try to fix all the zeros at once, and do not try to raise the ones while there are still zeros. The ones are tolerable; the zeros are where the outage, the resignation, or the lost data will come from. Two zeros a half-year is a realistic pace for a small team with everything else to do. It is a pace that shows in the wheel.
A low score in the management relationship row deserves one extra note, because it is the one area you cannot fix alone. The lever is the monthly one-pager: short, consistent, and sent whether or not anyone replies, until someone does. It is slower than the other fixes and worth more than most of them.
A war story: the practice that scored itself all twos
Meridian Parts ran its first self-assessment with two long-serving administrators. The worksheet came back with eight twos, an empty evidence column, and a note that the exercise had taken twenty minutes. A month later a new starter was given the name of a firing check and asked to find out what it meant. She spent an afternoon searching a shared drive, a wiki with two pages, and the inbox of an administrator who was on leave. She found the answer in the end, in a text file on the monitoring server's desktop, dated shortly after the install. The second self-assessment was run with her in the room and took the full hour. It produced two zeros, four ones, and two twos with evidence beside them. The team described the first sheet, in the monthly report, as "optimistic".
The first sheet was not dishonest. It was scored by the two people who knew where everything was, and to them everything was documented, because it was in their heads. The evidence column exists to catch exactly that, and the new starter is the best evidence there is.
The checklist
Before you file a self-assessment, check it against this list.
- Two people scored it, and one of them does not own the monitoring day to day.
- Every row has an evidence entry, including the rows scored two.
- Every score describes something observable now, not something planned.
- Where the two scorers disagreed, the lower score was taken and the reason noted.
- The wheel has been drawn, and the dents match the zeros.
- Each zero has become a roadmap item with a date and a name.
- The sheet is dated and filed with the monthly report.
- The next self-assessment is booked, about six months out.
- No score has been compared with any organisation but your own.
Where to go next
This guide is the words half of the pillar. The numbers half is in Benchmarking Uptime and Incident Counts Fairly and Benchmarking Monitoring Spend and Staffing Without Inventing Numbers. And the reason the two halves are kept apart is explained in Am I Normal? What Benchmarking Can and Cannot Tell You. When a self-assessment result has to be mentioned in a budget conversation, Using Benchmarks in Budget Conversations shows how to do it. That keeps the result from turning into a comparison it cannot support. All five guides live under Am I Normal? Benchmarking Your Network and Monitoring Practice.
Put this into practice with SysPeep Monitor
Half the evidence column comes straight from the monitoring tool. It includes who acknowledged what, how many alerts each person received, which services were down and for how long. SysPeep Monitor keeps availability and alert history as reports in one web console. Its auto-discovery is the coverage check that finds the new system before the outage does. The free trial installs on any Windows machine in minutes.
Download Free TrialLearn About SysPeep - All Rights Reserved.