
From Firefighting to Foresight: A Twelve-Month Monitoring Roadmap
Firefighting looks like this: you learn about outages from users. Your day is shaped by whatever broke overnight, and "monitoring" is a pile of checks somebody set up once, trusted by nobody. Foresight looks like this: problems announce themselves while they are still small. Incidents follow a script instead of an adrenaline spike. Uptime is a number you can show your boss, and budget requests arrive with graphs attached. Between those two states there is no tool purchase and no heroic weekend. There is a year of steady, unheroic work. I spent about three years looking for the shortcut before I did the year.
Maturity is a staircase, not a leap. This roadmap climbs it in four steps, one per quarter: see, trust, respond, prove. Each quarter has a goal, concrete tasks, a realistic time budget, and a definition of done you can test honestly. The order is the point. Each step stands on the one below it, and skipping steps is how monitoring projects fail politely.
This guide also covers the parts most roadmaps skip. It covers what the year actually costs in hours and what to do when a quarter gets eaten by fires. It covers how to find your true starting point if you are not at zero. It also covers the one tempting shortcut that reliably backfires.
In this guide
- The staircase at a glance
- Quarter 1 — See: cover what matters
- Quarter 2 — Trust: make alerts worth reading
- Quarter 3 — Respond: make incidents routine
- Quarter 4 — Prove: show the value, see ahead
- The whole year on one table
- The time budget, honestly
- Where are you now?
- The shortcut that backfires
- Where to go next
The staircase at a glance
The order carries the logic. You cannot tune thresholds for checks that do not exist, so coverage comes before signal quality. You cannot write runbooks for alerts nobody trusts, so signal quality comes before process. And any number you report is only as good as the signal underneath it, so proving value comes last. That is not because it matters least, but because doing it earlier produces confident nonsense. Each quarter below ends with a success sentence: a plain-language test you can honestly pass or fail.
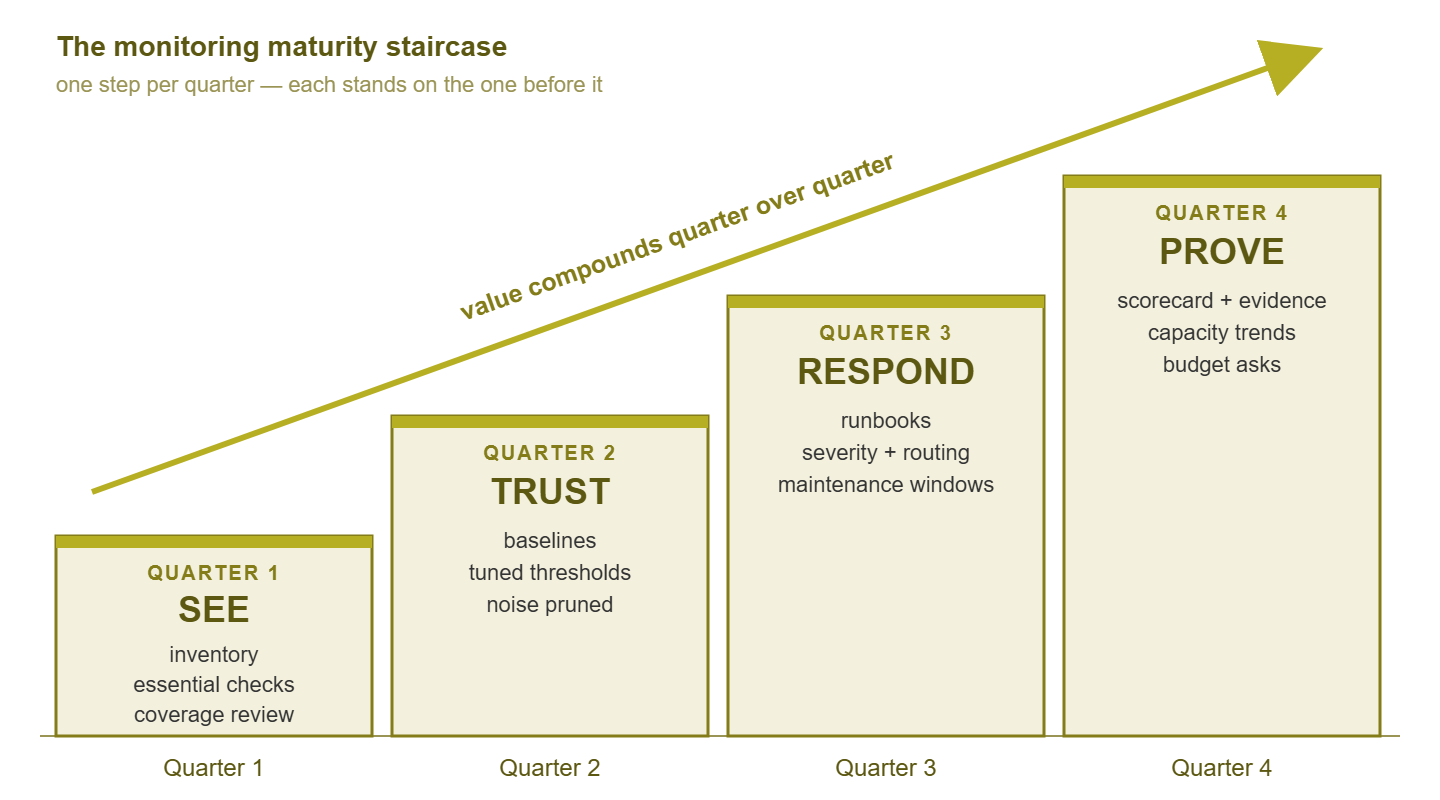
Figure 1: The four-quarter staircase. Each step makes the next one possible, and the value compounds as you climb.
Treat "quarter" as a unit of steady part-time attention, not a calendar religion. Stretching a step to four months is fine; reordering the steps mostly is not. The staircase is climbed in sequence for the same reason it is climbed at all.
You will be offered the popular alternative, so it deserves a name: the leap. A new tool gets bought, a big weekend rollout happens, and maturity is declared. Three months later the new tool has the old problems, because coverage, tuned thresholds, and response habits were never features you could install. They are work someone does. A good tool genuinely helps at every step; it is the handrail, not the stairs.
Bellweather Logistics had a monitoring roadmap, and it fitted on one slide. Quarter one said "monitor everything". Quarter two said "zero false alerts". Quarter three said "full automation". Quarter four said "executive dashboard". There were no hours, no owner, and no way of telling when any of them was done. Quarter four was the only one delivered, because it demoed well. The dashboard reported the warehouse systems at one hundred per cent availability for the whole year. That was true in the sense that none of them was being monitored. The following year's roadmap was the same slide with the quarter numbers moved along. The year after that, somebody wrote the hours in, and the slide became a plan.
Quarter 1 — See: cover what matters
The goal: end the era of learning about outages from users. By the end of this quarter, everything that matters has at least essential checks on it — not everything, everything that matters. The difference between those two phrases is what keeps this quarter achievable.
"What matters" is a short written list, made before any checks are created. It is the handful of services whose failure produces immediate phone calls. Typically, that means the internet link, the core network gear, the servers everyone touches, backups, and whatever the business actually sells with. Ten minutes with a pen beats a week of monitoring the wrong things enthusiastically. The discipline of leaving things off the list is what protects the quarters that follow from drowning in noise.
- Month one: work through a structured first rollout — the first 30 days plan is exactly this: discovery, the essential checks on core infrastructure, and first-pass thresholds, week by week.
- Month two: extend to the rest of the in-scope estate: branch equipment, backup job results, certificates, the internet link, and the services users actually consume.
- Month three: run your first coverage review — the systematic diff between what exists and what is watched. Adopt the intake rule: from now on, nothing goes live without monitoring.
Time budget: this is the most front-loaded quarter — expect four to five hours a week, roughly 50 hours in total, with month one the heaviest.
Done when: the phrase "how did we not know?" has left the building. Concretely: the last two incidents were announced by your monitoring before any user noticed. And you can name, from a written list, the things you have deliberately chosen not to watch.
Quarter 2 — Trust: make alerts worth reading
Quarter 1 has a side effect nobody warns you about: noise. Dozens of new checks with guessed thresholds alert enthusiastically about things that turn out to be normal. This is expected — but if you stop here, the alerts get ignored. In that case, six months from now your shiny coverage is decoration on a system nobody reads. Quarter 2 turns coverage into signal.
- Gather baselines: let the checks run and record what normal looks like for your network. A baseline is simply the documented normal range a metric lives in. It is what turns "CPU at 70%" from a mystery into a verdict. The methods live under Baselining.
- Tune the worst offender weekly: each week, take the noisiest alert and fix it. Raise the threshold, add a delay, or delete it, writing one line about why. The craft is covered under Threshold Tuning.
- Add dependencies: teach the system that when the branch router is down, the twenty devices behind it are unreachable, not broken. One outage should be one alert, not forty.
- Prune ruthlessly: any alert that fires repeatedly and is never acted on gets demoted or deleted. The full argument for this discipline lives under Alert Fatigue.
The engine of this quarter is a small weekly ritual: thirty minutes with the alert history, sorted by count. The top of that list is your worst offender. Fix that one alert properly, log one line about what you changed and why, and stop. Twelve weeks of that beats any heroic tuning weekend, because each fix is made calmly, with data, and stays fixed. "Worth reading," for the record, means one of two things: the alert demanded action, or it delivered information you were glad to have. Everything else is a candidate for the ritual.
Time budget: around four hours a week, roughly 45 hours — and unlike Quarter 1's setup work, a lighter version of this habit continues forever.
Done when: you can say, honestly, "every alert this month was worth reading." Test it by scrolling the alert history and counting the ones you ignored. Zero is the passing grade — and you will notice the side effect at home, too, when the notification sound stops producing a flinch.
Quarter 3 — Respond: make incidents routine
You now trust the alerts; the next gap is what happens after one fires. Without process, the response depends on who is on duty and how awake they are. The same incident, handled by a different person at a different hour, takes a different path — or no path. Quarter 3 makes the response repeatable, so the same incident gets the same fix in the same number of minutes, whoever picks it up.
- Write runbooks for the top ten alerts by frequency: a runbook is the written answer to "this alert fired — now what?" It covers symptoms, first checks, the fix, and when to escalate. Start with the alerts that fire most; templates and technique live under Runbooks.
- Write the conventions down: what critical and warning mean in your shop, who is told, and by which channel — the naming, severity and ownership standards from the monitoring standards guide.
- Adopt maintenance-window discipline: planned work gets announced and suppressed in advance, so Saturday patching stops paging anyone and stops polluting your uptime statistics with self-inflicted "outages."
There is a quieter payoff hiding in this quarter: delegation becomes real. A monitoring setup that lives in one person's head has a bus factor of one. That is the number of people whose sudden absence takes the knowledge with them. The setup has a vacation factor of zero. You cannot hand off what only you can interpret. Runbooks plus written conventions are what let a colleague, a junior, or an outsourced pair of hands take a shift without you narrating over their shoulder. If you have ever answered a "sorry to bother you on holiday, but…" call, this is the quarter that ends them.
Time budget: a runbook takes about an hour once you accept that a checklist beats a novel. The conventions are an afternoon. Call it 45 hours across the quarter.
Done when: the same incident happening twice takes half the time the second time. And anyone on the team can resolve the top alerts from the runbook alone. The honest test: hand the newest colleague a firing alert and watch, without narrating. If you have to talk, the runbook is not done.
Quarter 4 — Prove: show the value, see ahead
The monitoring now works. This quarter makes it visible — to leadership, who fund it, and to future-you, who must plan with it. The work splits into proving what happened and predicting what is coming.
- Start the evidence file: a running record of monthly uptime, incidents, causes and durations, kept where reports can cite it. The format is in the uptime evidence file guide.
- Publish a monthly scorecard: one page of trends — availability, worst offenders, capacity headroom — sent whether anyone asked or not; the network health scorecard shows the shape.
- Turn capacity trends into budget asks: disk growth and bandwidth growth curves convert "we need a new switch" from a plea into a chart with a date on it.
- Re-read the strategy: once a year, re-read your goals and scope document and update it for what the business changed while you were busy. These changes include new services, new sites, and new priorities.
To see why the prediction half matters, picture one chart: the file server's disk usage over the past six months. A straight line through it crosses 95% shortly before year end. Presented in October, that chart is a routine purchase approved in a calm meeting. Discovered in December, the same disk is an emergency — rush shipping, a weekend migration, and a conversation about why nobody saw it coming. The data was identical in both stories; the only difference is that in one of them, somebody drew the line early. Charts get funded; hunches get deferred.
Time budget: the first scorecard and evidence file cost real setup time; after that it is a few hours a month. Call the quarter 40 hours.
Done when: leadership sees the numbers monthly, and the next budget conversation cites them. The moment a decision-maker quotes your scorecard back to you, this quarter — and the year — is done.
The whole year on one table
| Quarter | Theme | Key tasks | Budget | Done when |
|---|---|---|---|---|
| Q1 | See (coverage) | Discovery and inventory; essential checks on everything in scope; first coverage review; intake rule | ~50 h | Outages announce themselves; no more "how did we not know?" |
| Q2 | Trust (signal) | Baselines; weekly threshold tuning; dependency rules; pruning | ~45 h | Every alert this month was worth reading |
| Q3 | Respond (process) | Runbooks for top ten alerts; severity and routing conventions; maintenance windows | ~45 h | A repeat incident takes half the time; anyone can work the top alerts |
| Q4 | Prove (value) | Evidence file; monthly scorecard; capacity trends into budget asks; strategy re-read | ~40 h | Leadership sees the numbers and the budget conversation cites them |
The hour figures assume a small environment — tens of devices, not thousands — and they are budgets, not stopwatch results. Bigger fleet, more hours; the sequence and the definitions of done stay the same.
The time budget, honestly
Add it up and the year costs about 180 hours — roughly four hours a week, or a tenth of one person's working week. That fits inside a real job, but only if it is booked. "When things are quiet" is not a time slot, because things are never quiet. They are merely on fire elsewhere. Put a recurring half-day block on the calendar and defend it like a meeting with your most important stakeholder. That is what it is — a meeting with the future version of you who is either grateful or up at 3 a.m.
Quarters will get eaten by fires anyway. When that happens, resequence by these rules. Stretch, never skip: a six-week "quarter" is fine; the order carries the logic, the calendar does not. Coverage debt jumps the queue: if a project just dropped a batch of unmonitored systems on you, pause wherever you are and re-run the coverage review. That is because everything downstream assumes you can see. Noise debt comes second: if alerts have turned noisy again, return to Quarter 2 work before adding anything new — trust decays faster than it builds. Quarter 4 degrades gracefully: reporting can start a month late with a shorter baseline, as long as the report says so.
And a reframe that helps morale: a firefighting quarter is not a lost quarter. Every incident is raw material — a coverage finding, a threshold lesson, or the first draft of a runbook written while the details are fresh. The staircase eats fires and turns them into steps.
Tip: keep the roadmap itself visible — a one-page copy of the table above, pinned where you and your manager both see it. It quietly answers "what does IT even do all day?" It turns each quarter's definition of done into something you can point at with modest, well-earned smugness.
Where are you now?
Not everyone starts at the bottom step. Ask yourself these four questions, in order, and be honest — the quiz only works if the answers hurt a little. Your starting quarter is the first question that gets a "no."
| Ask yourself | If the honest answer is no |
|---|---|
| Did monitoring — not a user — tell you about your last outage? | Start at Quarter 1 |
| Was every alert of the past month worth reading? | Start at Quarter 2 |
| Could a colleague resolve your three most common alerts from written steps alone? | Start at Quarter 3 |
| Could you show last quarter's uptime numbers to your boss within five minutes? | Start at Quarter 4 |
One caution about grading yourself: the questions cascade, so a "yes" that sits on top of a lower "no" deserves suspicion. A quiet alert history feels like a Quarter 2 pass. But if coverage is thin, the phone is quiet because the monitoring is blind, not because the network is healthy. (A blind monitoring system is the calmest thing in the building.) Silence is only a good sign when you have verified there is something there to make noise. Answer the questions in order, and let the first honest "no" win.
Four yeses means you are past this roadmap — write next year's, with sharper targets. Starting later on the staircase is allowed and sensible. What is not sensible is skipping a step while its question still gets a "no." That brings us to the shortcut.
The shortcut that backfires
The tempting move is to jump straight to Quarter 4. Reports look like maturity, leadership asks for them by name, and a dashboard demos beautifully. But a scorecard built on half coverage and untuned thresholds does something worse than nothing: it reports wrong numbers confidently. Unmonitored systems count as healthy because nothing says otherwise. Flapping checks (ones that bounce between failed and fine every few minutes) inflate the incident count while real degradations hide under the noise. Decisions get made on those numbers. When the gap comes out, as it does, it comes out publicly, and takes your credibility with it. Reporting noise is worse than silence, because silence at least knows what it does not know.
If leadership wants numbers before your signal deserves them, report what is actually solid. That means the roadmap itself, plus the few figures you already trust. In that case, label the figures honestly — "availability of the twelve core systems monitored since January; expanding each quarter." In practice, "here is the plan and here is what is solid so far" lands far better than a beautiful chart you later have to retract. Nobody remembers the retraction as being about the chart.
Where to go next
By the end of the year, outages announce themselves, and alerts are trusted. By then, incidents are routine, and the value shows up in a monthly page leadership actually reads. Then write next year's roadmap — and notice that it is smaller and sharper. Deepen coverage for one device class, cut detection time for the top incidents, and automate the responses you now understand well enough to automate. That shrinkage is the whole point. Maturity compounds: every quarter's output makes the next quarter cheaper, which is why the staircase is climbed once and maintained forever, not climbed annually.
A roadmap is strategy laid out on a calendar. The thing that separates it from a wish list with quarter numbers is that every line has hours and a test beside it. The documents and decisions each quarter leans on — goals and scope, service thinking, standards, coverage reviews — live in the rest of Building a Monitoring Strategy.
Put this into practice with SysPeep Monitor
A roadmap moves faster when the tool is not fighting you. SysPeep Monitor covers the Quarter 1 grind with auto-discovery of devices and interfaces and health checks over SNMP, WMI and SSH. Thresholds, dependencies and alert rules built to keep noise down carry Quarter 2. Dashboards and reports from a single web console hand Quarter 4 its numbers. The free trial installs on a Windows machine in minutes — a sensible first task for month one.
Download Free TrialLearn About SysPeep - All Rights Reserved.