
Your First 30 Days of Network Monitoring: A Week-by-Week Setup Plan
Somewhere on your task list, between password resets and a printer that lies about being out of paper, sits the item "set up monitoring." It has probably been there a while. Not because you disagree with it, but because every guide assumes you have a free week, and you have never once had one. Neither have I.
There is also a trap waiting for the motivated version of you: the big-bang rollout. I walked into it myself the first time. Spend one heroic weekend adding every device and switching on every alert, and Monday morning delivers three hundred emails about things you did not need to know. By Friday you have a mail rule shoveling them into a folder. The monitoring project is quietly dead — not because it failed, but because it succeeded at the wrong thing.
This guide is the middle path: a four-week plan that fits around a real job. Each week has one theme, a short list of tasks, and an honest time budget. And — because some weeks explode on their own — each has a fallback for when you only have two hours. Follow it and by day 30 you will have monitoring you actually trust: a system that speaks rarely, and that you listen to when it does.
In this guide
- How this plan works
- Week 1: Find everything and get access
- Week 2: Deploy the essential checks
- Week 3: Baseline quietly
- Week 4: Tune thresholds and go live on alerts
- The 30 days at a glance
- If you fall behind (and day 31)
- Where to go next
How this plan works
The whole plan costs roughly fifteen to twenty focused hours spread across a month — four to six in the busy weeks, much less in the quiet one. It is a real cost, and here is the honest return. Monitoring usually repays it all the first time it catches a filling disk or a dying uplink before it becomes an outage. Everything after that is profit.
There is exactly one rule: keep the order. The weeks build on each other. You cannot deploy checks against devices you have not found and cannot log into. You cannot judge whether a number is bad until you have watched it when everything is fine. And you cannot set alert thresholds worth anything until you know what normal looks like. The step people skip is week 3 — the quiet baseline week — because it feels like doing nothing. Skipping it is how you end up alerting on your own backup window at 2 AM. A system that raises false alarms trains you to stop listening. Admins call that state alert fatigue — so many alerts that none of them registers. Alert fatigue is the most common cause of death for young monitoring systems.
The new admin at Bellweather Logistics had the tool installed by lunchtime on day one. By the end of the day, she had pointed it at all two hundred and twelve devices the discovery scan found. She had every default alert switched on. Day two began with three hundred and forty emails, most of them about port utilisation on switches she had never heard of. She understood none of them, which was entirely reasonable. There was nothing yet to understand them against. By day four the mail rule existed. By day nine a warehouse scanner gateway went down and its alert arrived, correctly, in a folder with nine hundred siblings. The second attempt followed the order below, with notifications off for two weeks, and it is the one still running.
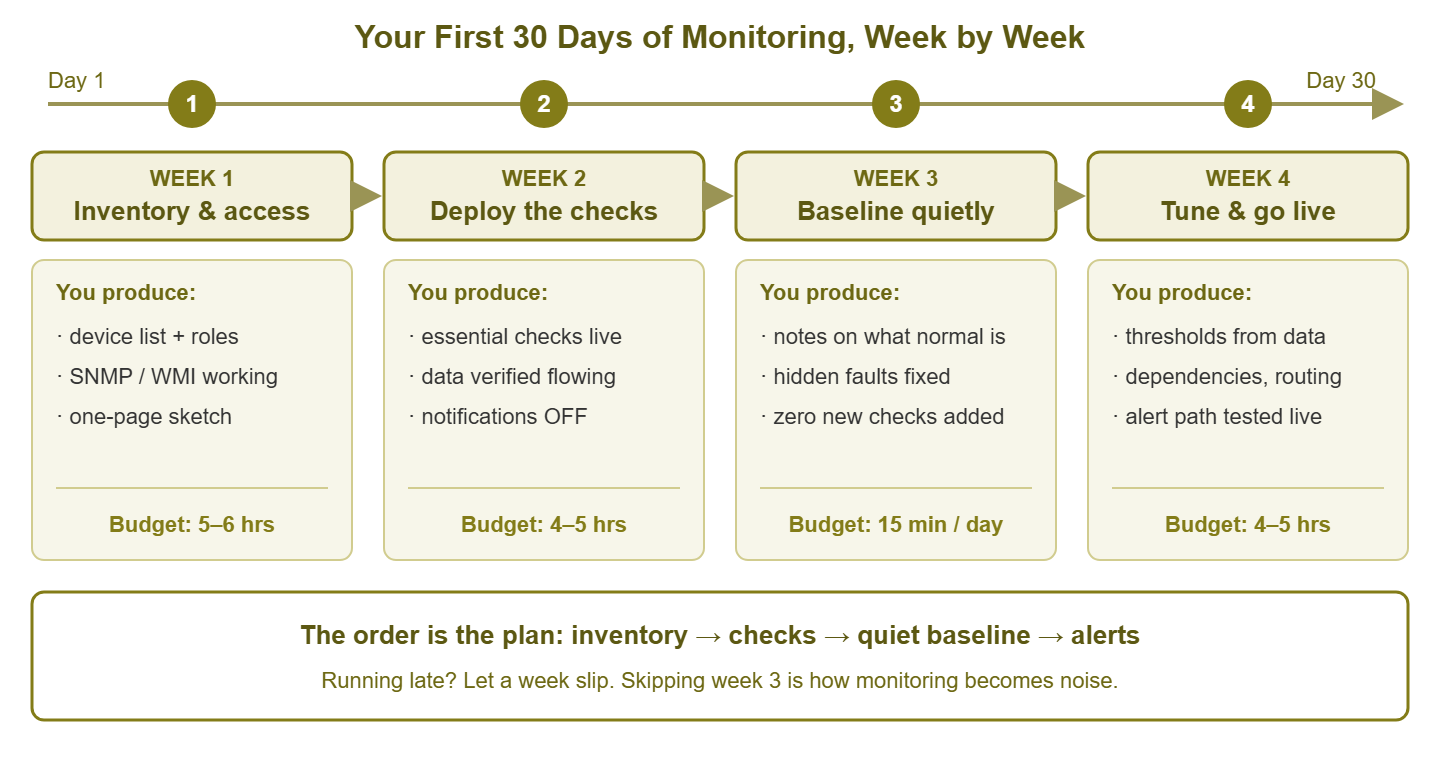
Figure 1: The four weeks at a glance. The order is the plan — each week's output is the next week's raw material.
Week 1: Find everything and get access
The goal for week 1 is simple: by Friday you know what is on your network. You can ask those devices questions. And you have a one-page sketch of how they connect. You will not configure a single check yet — deliberately. This week removes every obstacle that would otherwise stall next week's rollout.
Task 1: Build the device list (about two hours)
You cannot monitor what you do not know exists, and almost nobody's mental inventory survives contact with reality. Start a plain spreadsheet and fill it from several sources, because each one sees things the others miss. Start with the lease table on your DHCP server. DHCP is the service that hands out IP addresses, and the lease table lists who currently has one. Check the firewall's ARP or neighbor table (its list of which hardware address sits at which IP address). Check the MAC address tables on your switches (which record which device's hardware address was last seen on which port). Check whatever documentation you inherited (read it charitably — it was true once). Take a physical walk to the wiring closets with your phone camera. Expect surprises. Every network has a forgotten access point, a NAS (network-attached storage, a small box of disks that shares files) under someone's desk. Or it has an unmanaged switch behind reception that nobody admits to owning.
Keep the sheet small and honest. Something like this is plenty:
name        ip            role           access      matters because
fw-01       10.0.0.1      firewall       snmp v2c    all traffic passes through it
sw-core-01  10.0.0.2      core switch    snmp v2c    everything plugs into it
dc-01       10.0.0.10     domain ctrl    wmi         logins, DNS, DHCP live here
fs-01       10.0.0.11     file server    wmi         every department's files
ups-01      10.0.0.20     UPS            snmp v1     keeps the rack alive
ap-01..06   10.0.0.30-35  wi-fi APs      ping        half the office is wireless
The "matters because" column is the one that earns its keep: it becomes your priority order for everything that follows. If you cannot say why a box matters, do not delete the row — flag it. Mystery devices are a finding in their own right.
Task 2: Collect and test credentials (about two hours)
A monitoring system is only as useful as its permission to ask questions, so set up its accounts now. There are three families. For network gear — switches, firewalls, UPS units, printers — enable SNMP (Simple Network Management Protocol, the standard way monitoring tools ask devices about their health) in read-only mode. Access in the older SNMP versions is controlled by a community string — essentially a shared password. It often defaults to public; pick something else. Use SNMPv3 with a username and encryption where the device offers it. For Windows servers, create a dedicated monitoring account for WMI (Windows Management Instrumentation, the operating system's built-in question-answering interface). For Linux boxes, a read-only account over SSH (Secure Shell, the encrypted remote command line) does the same job. So does a small agent (a helper program installed on the machine that answers questions about it).
Two habits to start now: give the monitoring system its own accounts rather than reusing your admin login. The system will authenticate thousands of times a day, and you want its activity distinguishable from yours. Also, record everything in your password manager as you go. Then test at least one device of each kind before declaring victory. A one-line SNMP test from any machine with the standard tools installed looks like this:
snmpget -v2c -c yourcommunity 10.0.0.2 1.3.6.1.2.1.1.5.0
That long dotted number is simply the standard address of the device's name. If the switch's name comes back, your credentials work. If you get a timeout, the usual suspects are SNMP not actually enabled, a mistyped community string, or a firewall rule blocking UDP port 161 from your machine. SNMP travels over UDP, a lightweight message protocol, and 161 is its standard door. Fix it now, calmly — not mid-rollout next week, with a colleague reading over your shoulder.
Task 3: Sketch the network (about one hour)
One page. Internet at the top, then the firewall, then the core switch, then what hangs off it: other switches, servers, access points, the UPS. Boxes and lines — a whiteboard photo is a perfectly respectable network diagram. This sketch pays off twice. In week 4 it becomes your dependency map. It is how you will teach the monitoring system that forty devices live behind the core switch, so a switch failure produces one alert instead of forty-one. And it is the fastest orientation document you will ever hand a colleague.
Full week budget: five to six hours. If you only have two hours: shrink the scope, not the steps. List only the devices people would scream about within minutes. That means the firewall, core switch, whatever runs DNS (the service that turns names into addresses) and DHCP, and the main file or application server. Get SNMP working on the firewall and core switch, WMI on one server, and sketch the map from memory. That is a legitimate week 1 for the six devices that matter most; the long tail can join the inventory later.
Week 2: Deploy the essential checks
The goal for week 2: your first checks are live and collecting data — and the system is still silent. Install the monitoring software on a boring, stable machine that is not one of the servers it will be watching. Then start adding the devices from your week-1 list. If your tool can scan the network and discover devices automatically, run that too, and cross-check it against your inventory. Discovery finds the things you forgot, and your inventory tells you which of them actually matter. Discovery will also offer to add all of them. It offers this to everyone.
As for what to check — do not reinvent this. The companion guide What Should You Actually Monitor? The First 10 Checks for Any Small Network walks through the starter set one check at a time. It covers the internet link, the firewall, the core switch, DNS, and DHCP. It covers the key servers (especially their disks), backup jobs, the UPS, Wi-Fi access points, and certificate expiry dates. It explains why each earns its place and suggests starting thresholds. Use those exactly as written for now, even though some will be wrong for your network. They are training wheels, and week 4 replaces them with numbers derived from your own data.
Then verify that data is genuinely flowing, which is a different thing from the tool looking configured. Open each device in the console and confirm real numbers are arriving. Confirm the CPU graph has values, traffic counters are climbing, and the disk gauge shows a plausible percentage. The classic day-one failures are all fixable in minutes once spotted:
- Timeouts on a network device: SNMP is off, the community string is wrong, or an access list on the device or a firewall is blocking your monitoring machine.
- "Access denied" from a Windows server: the monitoring account lacks WMI permissions on that particular box. Fix the account rather than granting yourself a workaround you will forget about.
- A switch offers you 92 interfaces to monitor: decline politely. Monitor the uplinks and the ports feeding servers and access points; ignore the port where Gary charges his phone.
- A device answers ping but nothing else: it is alive but was never configured for SNMP. Add it to the week-1 leftovers pile; ping-only monitoring is still worth having meanwhile.
Finally, the discipline that makes this plan work: leave notifications off. The system watches this week; it does not speak. If your tool insists on sending something, point it at a mailbox folder you visit on purpose rather than your inbox. An alert that arrives before its threshold has earned trust is just noise with a timestamp.
Full week budget: four to five hours. If you only have two hours: set up reachability (up/down) checks on everything in your shortlist plus disk-space checks on the servers, and stop there. Up/down and disk space are a startlingly large fraction of monitoring's real-world value. Add the rest of the ten as spare minutes appear.
Week 3: Baseline quietly
A baseline is a record of what your network looks like when nothing is wrong — the shape of a normal Tuesday. It is the reference that turns a number into a judgment: 70% CPU means nothing by itself, but "70% on a server that idles at 20%" means something changed. Nobody can hand you a baseline; you grow one by watching, starting this week.
The method is a ritual, not a project: fifteen minutes a day, ideally the same time each day, coffee in hand. Skim every graph. You are looking for rhythms. CPU that breathes with the workday. Bandwidth that spikes at 2 AM when backups run. Disk-usage lines and the slopes they are on — a disk at 60% climbing one percent a week is a calendar entry, not a crisis. Latency that is boring all day and lumpy at lunch. As patterns emerge, write them into the inventory sheet from week 1: add columns for "normal CPU," "busy hours," "notes." You are building the written baseline and, at the same time, training the most valuable monitoring instrument you will ever own: your own sense of what looks weird.
Expect discoveries. Almost everyone finds something in baseline week. It might be the backup job that saturates the WAN link nightly. That is the wide area network link, meaning the line to the internet or another site. Nightly saturation by that backup is normal — write it down so future-you does not panic. It might be the weekly antivirus scan that pins a server for an hour, a switch port quietly accumulating errors, or a disk already at 91%. Fix the real problems as you find them. It is a quiet pleasure to solve an outage that never got to happen, before you have configured a single alert.
Tip: finding pre-existing problems during baseline week does not mean your network is unusually bad — it means the flashlight is finally on. Fix them and enjoy the win, but resist building alerts for each discovery on the spot; properly tuned alerting arrives next week.
Just as important is what you do not do this week. Do not add two hundred new checks because the tool makes it easy. Every check you add before the first ten are trusted dilutes them, and the tool will not stop you. And do not switch alerting on early, however tempting it is now that the graphs are alive. Trust first, volume later.
Full week budget: fifteen minutes a day — call it two hours across the week. If you only have two hours: good news — this already is the two-hour week, and it cannot be compressed because elapsed time is the ingredient. If your week disintegrates entirely, let baselining run a second week instead. Baselines are like cast iron: they only improve with seasoning.
Week 4: Tune thresholds and go live on alerts
This is the week the system earns the right to interrupt you. The goal is that every alert that can fire is one you would genuinely act on. The goal also requires that the path from "check fails" to "human knows" has been tested end to end. Work through it as a sequence:
- Step 1 — set thresholds from your baseline, not from folklore. The rule of thumb: warn above your observed normal peak, alert at "something is definitely wrong." If the file server touches 78% CPU during every backup, a textbook warning at 70% will page you nightly about nothing. In that case, set the warning at 85% sustained instead. Your graphs now outrank anyone's defaults, including week 2's starting set.
- Step 2 — require persistence. Configure alerts to fire only when a condition survives two or three polling cycles, or sustains for several minutes — not on a single blip. This one setting eliminates most flapping noise (a check bouncing rapidly between OK and failed, emailing you every bounce).
- Step 3 — encode dependencies from your week-1 sketch. Tell the system what lives behind what: the servers behind the core switch, the branch devices behind the VPN. When a parent dies, the children's alerts are suppressed, and you get one meaningful alert instead of forty-one. This is the sketch cashing in.
- Step 4 — route by severity, honestly. Decide what each level means in human terms. Critical means "wake someone": the internet link, the firewall, the core switch, a key server down, a disk about to be full. Warning means "look during business hours": rising errors, shrinking disk, a struggling AP. Info means "dashboard only." Be ruthless about the wake-up list — only things you would genuinely get out of bed to fix belong on it. Then set an escalation: if a critical alert sits unacknowledged for fifteen minutes, it goes to the second person. In a team of one, it goes to a second, louder channel instead.
- Step 5 — test the pipe by breaking something. Unplug a lab switch port, stop a non-critical service, and watch the whole chain run: check fails, alert fires, phone buzzes. Untested alerting is a hope, not a system. While you are in the settings, create a maintenance-window habit too. That is a way to silence planned work like patch night, so scheduled reboots do not train everyone to ignore Tuesday alerts.
Tip: book a recurring fifteen-minute "false alarm review" for the first several Fridays. For every alert that fired that week, ask one question: did I act? If not, raise the threshold, add a delay, or delete the alert. If you acted — or wish you had been told sooner — keep it or tighten it. This tiny loop is the entire secret of monitoring that stays quiet and trusted.
Full week budget: four to five hours. If you only have two hours: switch on only the five scream-level alerts. These are internet down, firewall down, core switch down, any key server down, and any disk over 95%. Give each a persistence delay, and leave everything else as warnings collecting in the folder. That is a defensible go-live; finish the tuning as hours appear.
The 30 days at a glance
| Week | Theme | You end the week with | Budget | The 2-hour version |
|---|---|---|---|---|
| 1 | Find everything, get access | Device list with "matters because," tested SNMP/WMI credentials, one-page network sketch | 5–6 h | Just the six devices people would scream about |
| 2 | Deploy the essential checks | The first 10 checks live and collecting; notifications deliberately off | 4–5 h | Up/down everywhere that matters, plus server disks |
| 3 | Baseline quietly | Notes on normal for every graph; pre-existing problems found and fixed | 15 min/day | Already is the 2-hour week — extend it rather than skip it |
| 4 | Tune and go live | Thresholds from your baselines, dependencies, severity routing, a tested alert path | 4–5 h | Five scream-level alerts only; the rest stay warnings |
If you fall behind (and day 31)
The weeks are a rhythm, not a law. If a real crisis eats week 2, let the whole plan slip a week — nothing about it expires. The order is the plan; the pace is adjustable. The only genuinely damaging shortcut is jumping ahead to alerting, because a noisy alerting system is worse than none at all. With none, at least you know you are blind. A noisy one convinces you that you are watching while it methodically teaches you to look away.
And day 31? The plan ends; the habits continue. Grow the check list a few at a time, and make every candidate pass the test from the first-10 guide: if this fired at 9 AM tomorrow, would you do something? Re-baseline after anything big changes — a new server, a new ISP (internet service provider), twenty new hires — because normal has moved. Revisit thresholds quarterly, and keep the Friday review until nothing false fires. A monitoring system is a garden, not a monument. Tended in minutes every week, it stays useful for years; ignored, it goes to seed exactly when you need it.
Where to go next
Thirty days ago "set up monitoring" was a guilt-inducing line on a task list, just above the printer. Now it is a running system with an inventory behind it and checks you chose on purpose. It has a baseline that tells you what weird looks like, and alerts that have earned the right to interrupt you. You got there without a free week, because there was never going to be one. From here it is refinement: understanding more deeply what each check measures, how the data moves, and how to keep the alert list honest as the network grows. The other guides in Network Monitoring Fundamentals pick up each of those threads.
Put this into practice with SysPeep Monitor
The slowest parts of this plan are weeks 1 and 2 — finding every device and wiring up the first checks by hand. SysPeep Monitor compresses both. It auto-discovers the devices and interfaces on your network and sets up health checks over SNMP and WMI in minutes. That lets you spend your 30 days baselining and tuning instead of doing data entry. The free trial installs on any Windows machine.
Download Free TrialLearn About SysPeep - All Rights Reserved.