
The Services Everything Depends On (and Nobody Watches)
It is a quarter past nine on a Tuesday and the tickets are arriving in flavors. Marketing cannot log into the CRM. Two people in the warehouse say the Wi-Fi "keeps kicking them off." Someone in accounting reports that email is "acting weird," which is somehow both urgent and impossible to act on. Three symptoms, three applications, so it must be three separate problems — except it is not. It is one problem, in a service you have probably never opened a dashboard for, quietly wobbling underneath all of them.
Every network has a small set of foundation services that everything else stands on: name lookup, time, identity, and admission control. Users never see them. Applications rarely name them in error messages. And monitoring setups routinely skip them, because checks get added where complaints point — and complaints never point at the foundations. That combination is a blind spot with a signature: weird, scattered, "impossible" symptoms that eat entire afternoons.
This guide is about closing that blind spot. By the end you will know which services belong to the foundation family and why their failures surface everywhere except at the guilty service. You will know how to map the dependency chains in your own network. And you will know the handful of cheap checks that turn an "everything is broken" morning into a two-minute diagnosis.
In this guide
- The iceberg under your applications
- Meet the foundation family
- Why symptoms surface far from the cause
- The symptom-to-hidden-cause table
- Mapping your own dependency chains
- Monitoring foundations as first-class services
- The payoff: five minutes that save hours
- Where to go next
The iceberg under your applications
When users think about "the network," they picture the things they touch: email, file shares, the CRM, video calls, the print queue (bless it). Those are the visible tip. Underneath the waterline sits the mass that keeps the tip upright. These are services with unglamorous names that answer questions applications ask hundreds of times an hour. What address does this name point to? What time is it? Who is this user, and what groups are they in? Should this laptop be allowed onto the network at all?
The proportions matter. The visible tip is small; the submerged mass is large. And — this is the part that bites — users can only file tickets about the part they can see. When something below the waterline cracks, the tip tilts, and every complaint describes the tilt, never the crack. Nobody has ever opened a ticket that says "I believe the domain controller's clock has drifted." They open tickets that say the CRM is broken.
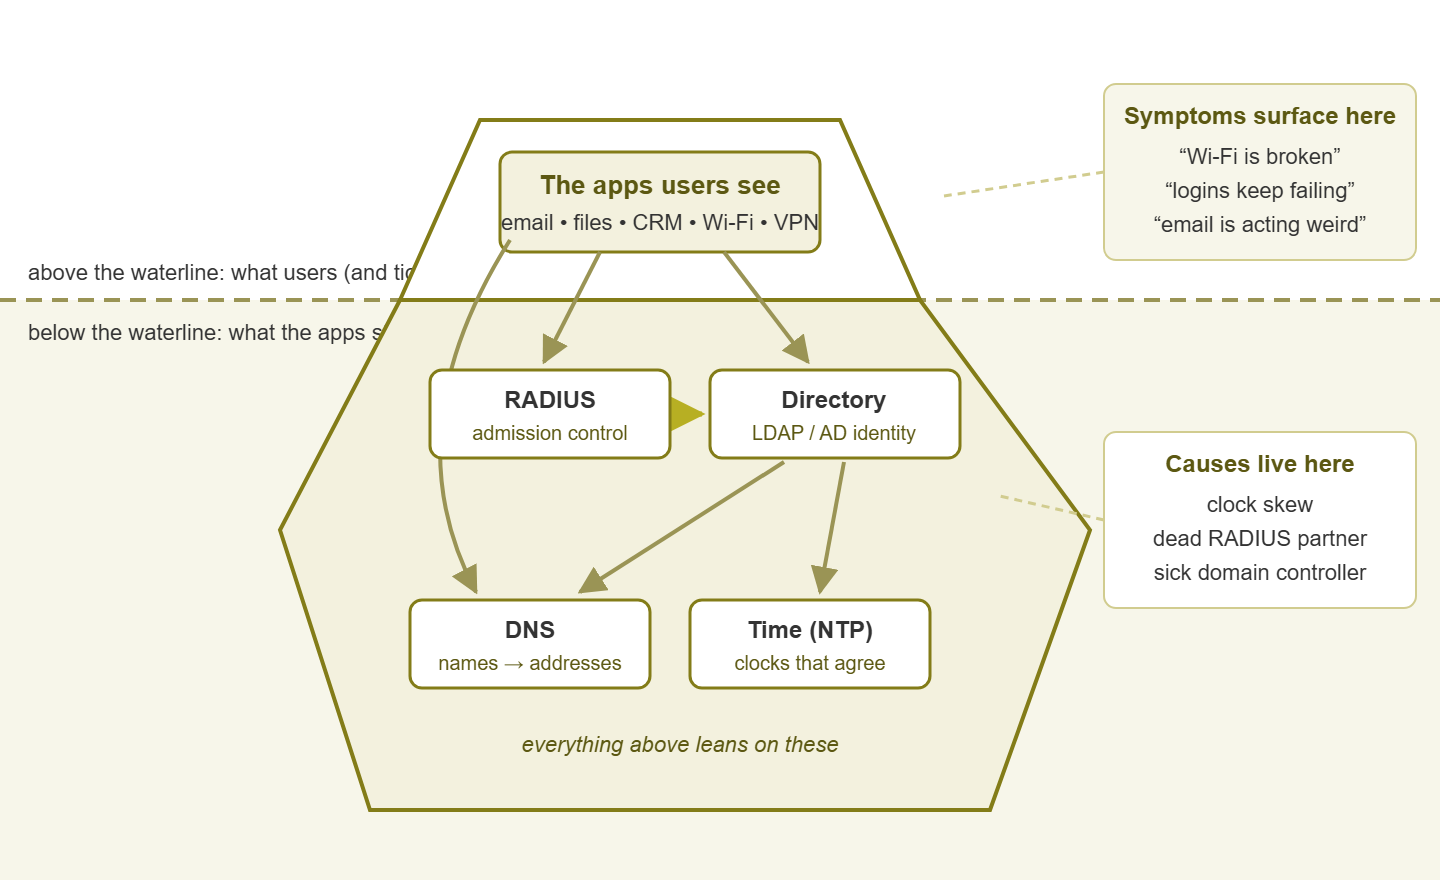
Figure 1: The dependency iceberg. Users experience the tip; the failures that produce the weirdest tickets live below the waterline.
Meet the foundation family
Four services make up the core of the family. You almost certainly run all four, even if nobody formally owns them.
Names: DNS
DNS (the Domain Name System) turns names into addresses. It is the most famous member of the family, and it has a full guide series of its own. See It's Always DNS: Name Resolution Health for everything from how lookups fail to a step-by-step playbook. Here we only need it as a named member of the family: everything on this page leans on it.
Time: NTP
Every computer has a clock, every clock drifts, and NTP (the Network Time Protocol) is the service that keeps them agreeing with each other. That agreement turns out to be load-bearing: authentication tickets, log timestamps, certificates, and scheduled jobs all quietly assume the clocks match. NTP and Clock Drift covers its famously strange failure modes in depth.
Identity: the directory (LDAP or Active Directory)
The directory is the org's official record of who exists: accounts, passwords, groups, and policies. In most Windows shops that means Active Directory, queried over a protocol called LDAP (the Lightweight Directory Access Protocol). Every login, everywhere, eventually consults it. LDAP and Active Directory Health covers what a network admin can and should watch.
Admission: RADIUS
RADIUS is the bouncer at the door — the service your Wi-Fi access points, VPN concentrator, and switches ask before letting a user or device on. It usually checks its list by asking the directory, which makes it a dependency with a dependency. RADIUS: Monitoring the Gatekeeper gives it the full treatment.
You could argue for more members — DHCP hands out addresses, certificates vouch for identities — and you would not be wrong. But these four share the trait that defines the family. They are consulted constantly, invisibly, by nearly everything. When one of them wobbles, the wobble shows up wearing someone else's clothes.
There is one more family trait worth naming: nobody owns them. In a lot of orgs, time syncing "just happens." In those orgs, RADIUS was set up by a contractor two admins ago, and the directory belongs to whoever touched it last. Services without an owner do not get monitoring, because monitoring is something owners add. If you have read this far, congratulations — you may have just become the owner. It is less work than it sounds, and the rest of this guide is the job description.
Why symptoms surface far from the cause
This is the heart of the matter, and it is worth understanding properly, because it explains years of confusing afternoons. Four mechanisms conspire to make foundation failures look like anything but foundation failures.
Applications report their own point of view. An app that fails to authenticate a user does not say "the domain controller's clock is six minutes ahead of yours." It says "invalid credentials, please try again." Error messages are written in the application's vocabulary, about the application's little world. Each layer between the user and the broken foundation translates the failure into its own dialect. By the time it reaches a human it reads like an app bug or a user mistake.
Foundations fail partially more often than totally. A totally dead directory would at least be obvious. What you actually get is one domain controller of three misbehaving. Or you get one RADIUS server of two silently dead while its partner carries the load with added timeouts. Partial failure means intermittent symptoms: some users affected and not others, retries that sometimes work, problems that vanish when you go look. Intermittent is the most demoralizing word in troubleshooting, and foundation services generate more than their share of it.
Caching smears failures across time. Authentication tickets last hours. Name lookups are cached. Sessions stay up until they need to renew. So when a foundation breaks at 6:00, nothing happens at 6:00. The failures drip in over the morning as caches expire and tickets come up for renewal. By the time complaints peak, the cause is hours old. The reflex question "what changed in the last ten minutes?" points at exactly the wrong window.
The guilty server looks healthy on standard checks. This is the cruelest one. The server hosting the broken service answers pings. Its CPU is low. Its service shows as "running." A time server that has lost its upstream sources will keep serving time confidently — increasingly wrong time. Every conventional check you have gives it a clean bill of health. That is because conventional checks ask "are you up?" when the question that matters is "are you right?"
The symptom-to-hidden-cause table
Put those mechanisms together and you get a translation problem: the tickets arrive in symptom language, and the cause is written in foundation language. This table is the phrasebook. It is not an oracle — sometimes the Wi-Fi complaint really is the Wi-Fi. But when a symptom is scattered, intermittent, or "impossible," check the right-hand column before you spend an afternoon on the left.
| What gets reported | What you observe | Where the cause often lives |
|---|---|---|
| "Random people can't log in" | Scattered authentication failures; retries sometimes work; no pattern by app | Clock skew — a machine or DC outside the login system's time tolerance |
| "The VPN is flaky today" | Some connections fail or hang, then succeed on retry | One RADIUS server of the pair dead or slow; the edge is timing out and failing over |
| "The network is down" | Browsing fails, but pings and existing sessions are fine | Name resolution — the family member with its own pillar of guides |
| "Wi-Fi keeps asking for my password" | Prompt loops, rejoin loops, devices refusing the network | RADIUS trouble, or the certificate on the RADIUS server |
| "The app broke, but only for some people" | A permission or group change applied unevenly | Directory replication lag — the DCs disagree with each other |
| "These logs make no sense" | Events out of order across systems; effects before causes | Clock drift on one or more log sources |
| "Everything is slow first thing in the morning" | Logins and app launches crawl at 9:00, fine by 10:00 | Auth latency — the directory or RADIUS queuing under the login storm |
Notice what the left column has in common: every single entry sounds like a different team's problem. The Wi-Fi row sounds like an access point issue. The VPN row sounds like the firewall. The logs row sounds like a logging bug. That is the dependency iceberg doing what icebergs do. It is why the fastest troubleshooters you will ever meet share a habit. When symptoms are weird and plural, they glance at the foundations first.
Mapping your own dependency chains
A generic iceberg picture is a fine start. But the version that saves you at 9:15 on a Tuesday is the one with your server names on it. Building it takes about an hour, no special tools, and one honest exercise per application.
- Step 1: pick the top three. Choose the three applications whose failure would generate the most noise — usually email, the main line-of-business app, and file sharing. You are not mapping everything; you are mapping what matters.
- Step 2: walk one login in slow motion. For each app, narrate what actually happens when a user connects. The laptop looks up a name (who answers that?). It authenticates (against which server, speaking which protocol, via which middleman?). The credential it receives is time-stamped (whose clocks have to agree?). Write each answer down as a box with an arrow.
- Step 3: follow the middlemen. Wherever you wrote RADIUS or a web login portal, ask what it consults. The arrows almost always continue to the directory, and from there to name lookup and time. Chains, not single hops.
- Step 4: look for the convergence. Lay the three maps side by side. The top halves differ; the bottom halves are the same four boxes. That convergence is the punchline of the whole exercise: it is why one wobbling foundation produces symptoms in three unrelated apps at once.
- Step 5: keep it on one page. Redraw the merged map small enough to pin up or paste into your wiki. Its job is to be glanced at during an incident, not admired.
This exercise is a specific case of a general monitoring skill. It means asking, for every service you care about, "what does this depend on, and who watches that?" The guide on dependency thinking develops that habit fully, including how deep to go and when to stop. For today, the four foundation boxes at the bottom of your map are the point: they are about to become monitored services.
Monitoring foundations as first-class services
"First-class" means the foundation gets what your important servers already get. That means its own checks, its own thresholds, and its own place on the dashboard — not a ping and a shrug. But there is a twist. As we saw, a broken foundation often looks perfectly healthy to a ping or a service-status check. The check that works is a synthetic check: a scripted rehearsal of the real question, asked on a schedule, with the answer timed and verified.
The recipe per family member looks like this:
- Time: measure the clock offset of every machine that matters against a reference. Alert when any of them drifts past a threshold measured in seconds. Also watch whether your time servers can still reach their sources — the confident-but-wrong time server is the classic trap.
- Directory: perform a scripted LDAP bind (a login) and a small lookup against every domain controller individually, and record how long each takes. "One of them answers" is not the same as "all of them are healthy."
- RADIUS: run a scheduled test authentication with a dedicated test account against each RADIUS server directly. If the test account cannot get in, neither can the CEO.
- Names: resolve a real name against each resolver on a schedule. The DNS pillar linked above covers the details, so we will not re-teach them here.
- The hosts underneath: keep the ordinary server checks too — disk, CPU, memory, service status. They will not catch a free-running clock, but they catch the full disk that causes next week's outage.
In command terms, the synthetic checks are humble one-liners — the same things you would type by hand during an incident, which is exactly the point. A monitoring system just types them every few minutes so you do not have to:
# Time: how far is this DC's clock from mine?
w32tm /stripchart /computer:dc1.corp.example /samples:3

# Directory: can I bind and read, and how fast?
ldapsearch -H ldap://dc1.corp.example -D monitor@corp.example \
  -w PASSWORD -b dc=corp,dc=example "(sAMAccountName=monitor)" dn

# RADIUS: will a real authentication succeed right now?
radtest monitor-test PASSWORD radius1.corp.example 0 SHARED_SECRET
Two practical details make these checks trustworthy. First, run them from where the users are. That means a probe on the office network, not just the monitoring server's own segment. That way the check travels the same path a real login travels and fails when users would fail. Second, give synthetic accounts the least privilege you can get away with and a name that screams "monitoring." That way, the day one shows up in a security log, nobody's heart stops.
Run the checks every one to five minutes. Alert when a check fails twice in a row (one blip is life; two is a pattern). Also alert when response time drifts well above its normal range. That is because foundation slowness hurts users before foundation death does. Then do the step most people skip. Tell your monitoring system that everything else depends on these checks. That way, when a foundation fails, downstream alerts are suppressed and the page you receive names the cause instead of forty symptoms.
Tip: make the foundation checks the roots of your alert dependency tree. The difference between "1 alert: RADIUS synthetic auth failing" and "43 alerts: various" at 2 a.m. is not cosmetic. It is the difference between a five-minute fix and an hour of triage while users wait.
The payoff: five minutes that save hours
Replay the Tuesday morning from the top of this guide, now with foundation checks in place. At 9:12, before the first ticket, the dashboard shows one red item: the synthetic clock-offset check on a domain controller has crossed its threshold. The CRM complaints, the Wi-Fi drop-offs, and the "weird" email all arrive as expected. None of them start an investigation, because a glance at the foundation row already explains them. You fix one clock. The symptoms evaporate together. Total elapsed time: about the length of a coffee.
Without the checks, the same morning runs differently, and you have probably lived it. One person reboots access points, another blames the ISP, and someone reinstalls a mail profile that was never broken. The actual cause is found late, by accident, or worst of all never. In that last case, the clock gets corrected by its next scheduled sync and the whole episode goes down as "it fixed itself." Nothing corrodes trust in IT quite like that sentence.
The economics here are lopsided in your favor. The foundation family is four services. Watching them properly costs a handful of synthetic checks and a few minutes of setup each — call it an afternoon, once. In exchange you convert the most expensive class of incident you face (vague, scattered, multi-app) into the cheapest kind of diagnosis there is: reading a dashboard. Checks on the visible tip of the iceberg tell you that users are hurting. Checks below the waterline tell you why.
Where to go next
You now have the map: a small family of services underneath everything. You know the failure modes that surface far from the cause, and a synthetic-check recipe for watching each member properly. The rest of this pillar goes deeper on each box below the waterline: time and clock drift, RADIUS, and the directory. When the day comes that logins break anyway, the authentication-path playbook walks the whole chain hop by hop. Start with whichever service your map says the most arrows point at; for the full set, see Core Services: NTP, RADIUS, LDAP/AD.
Put this into practice with SysPeep Monitor
The foundation services in this guide run on hosts your monitoring can watch today. SysPeep Monitor auto-discovers the servers behind your directory, time, and authentication. It tracks their health over SNMP, WMI, and SSH. Its dependency-aware alert rules mean one wobbling core service sends you one alert — not forty downstream ones.
Download Free TrialLearn About SysPeep - All Rights Reserved.