
Dependency Thinking: Monitoring the Things Your Things Depend On
There is an outage every admin lives through at least once. The application server is perfect: CPU calm, memory fine, disks half empty, every check green. And yet there is a queue at your desk, because the application is unusable. The real culprit is somewhere off to the side. The DNS resolver died, or a certificate expired at midnight. Or the NAS (network-attached storage) quietly reached 100 per cent. That is the shared disk box the application keeps its data on. Your monitoring watched the patient closely and never once glanced at the life support.
Services rarely fail head-on. They fail sideways, through the things they need. The first time it happened to me I spent an afternoon rebooting a server that had nothing wrong with it. Dependency thinking is the habit that fixes this. For every system you monitor, ask "what does this need in order to work?" and then make sure each answer has a check of its own. By the end of this guide you will know the eight dependency families that sit under almost every service. You will know how to hunt down the dependencies nobody wrote down. You will know how to wire dependencies into your monitoring tool without doubling your alert noise. You will also know how to run a simple dependency audit on every critical system you own.
In this guide
- What dependency thinking means
- The eight dependency families
- Shared roots: why dependency checks punch above their weight
- The hidden-dependency hunt
- Designing monitoring around dependencies
- The classic blind spot catalog
- The dependency audit worksheet
- Where to go next
What dependency thinking means
Think of each service as a tree. The part above ground — the app, the website, the file share — is what users see and what you instinctively monitor. Below ground is the root system: name resolution, authentication, time, certificates, storage, the network path, power. Nobody looks at roots. But when one rots, the whole tree drops its leaves, and everyone stands around staring at the healthy-looking trunk wondering what happened.
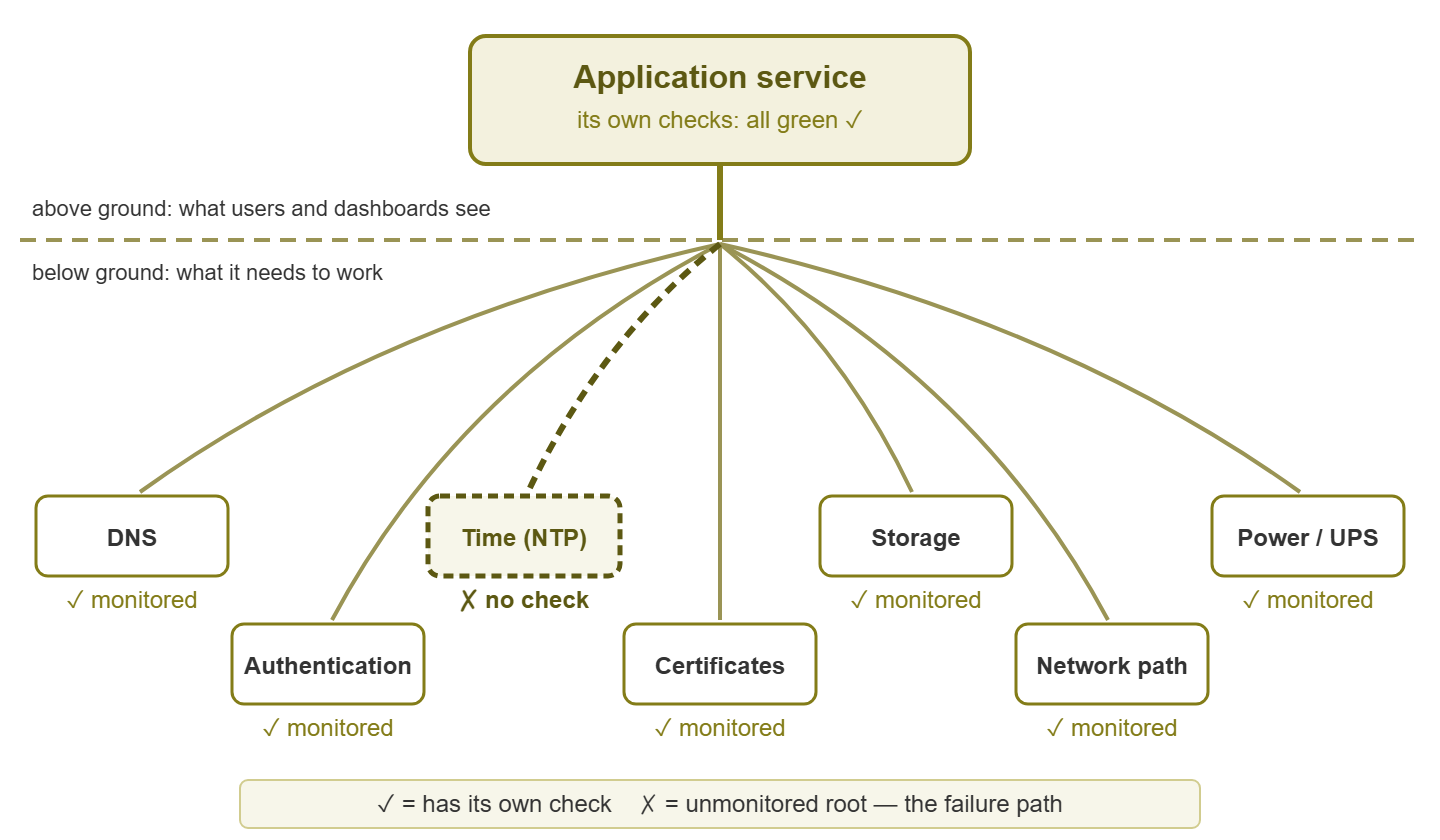
Figure 1: The service everyone watches, and the roots it stands on. Every unmonitored root is a way for a green service to fail anyway.
The practical rule is short enough to memorize: a monitored service with unmonitored dependencies is only half monitored. The failure will simply arrive through the half you cannot see, and it will arrive wearing a disguise. The symptom shows up on the healthy system. The cause hides on the ignored one. Dependency thinking does not require new tools or new budget. It requires asking one question, per service, with a pen in hand: what does this need to work? The rest of this guide is a tour of the usual answers.
The eight dependency families
Almost every dependency you find will belong to one of eight families. For each, here is what it looks like when it fails and the check it deserves.
1. Name resolution (DNS)
Everything needs DNS — the service that turns names like app.company.local into addresses. When a resolver dies, the blast radius is spectacular. Every application that looks anything up starts timing out at once. Users report "everything is slow" or "the internet is down" while every server shows green. The check it deserves: a query that resolves a real name against each resolver separately and confirms a timely answer. A ping of the DNS box is not enough, because a server can answer pings while its DNS service is wedged.
2. Authentication (AD, LDAP)
When the domain controller or directory service is down, nothing else is actually broken — and everything is unusable. Logins fail, shares refuse connections, and applications reject valid passwords. The ticket queue fills with reports about a dozen different "broken" systems that are all one system. The check: verify the authentication service itself responds on every controller. Use an LDAP bind, which is a test login against the directory, or your tool's equivalent. Also check the health basics of the boxes that run the service.
3. Time (NTP)
The sneakiest family. Clocks that drift far enough apart break authentication protocols that are sensitive to time skew. Such clocks scramble the timeline in your logs (good luck correlating an incident when servers disagree about when it happened). They can also upset certificate validation, scheduled jobs, and database replication. Time fails quietly: nothing crashes, things just get weird. The check: monitor clock offset on your key servers against a reference, and alert when skew crosses a few minutes. That is long before the level where logins start failing mysteriously.
4. Certificates
Every TLS-secured service — the web app, the mail server, the VPN portal — carries an expiry date the day it is deployed. A certificate is a dependency with a built-in countdown: nothing is wrong until one midnight when everything is. Expiry is the most predictable outage in IT and still one of the most common. The check: read the certificate on each service and count days remaining; warn at 30 days, alert at 14. This one check converts a guaranteed future outage into a routine calendar task.
5. Storage beneath compute
Virtualization hides a brutal dependency. Twenty VMs can share one datastore (the pool of disk a hypervisor carves up and hands to its virtual machines). When that datastore fills or its array degrades, every VM on it suffers at once — often by pausing or crashing in ways that look like twenty separate emergencies. The same applies to the NAS behind your file shares and the SAN behind your databases. The check: monitor free space and health on the underlying storage — the datastore, the array, the volume. Do not just monitor the disks the guest operating systems think they have. A guest's view of its own disk is an opinion. The datastore is the fact.
6. Network path
Between users and any service stands a chain of switches, uplinks, firewalls, and sometimes a VPN tunnel. The service inherits the health of every link in that chain. That is exactly the inheritance rule from criticality tiers: the switch under a Tier 1 service is a Tier 1 device, however humble it looks. The check: reachability and port status for every device on the path, plus error counters on the links. That way, a dying cable shows up as a counter climbing instead of as "the app is slow sometimes."
7. Power and environment
Every dependency chain ends at a power outlet. The UPS, the circuit it protects, and the air conditioning that keeps the room survivable are dependencies of literally everything in the rack. They also fail with a countdown rather than a bang. A UPS on battery or a failed AC unit starts a timer measured in minutes. The check: UPS status (on battery? battery health? runtime remaining?) and room temperature, with alerts that fire immediately. These are the alerts where minutes of warning change the outcome.
8. External dependencies
The ISP, the cloud apps, the vendor's license server on the internet — dependencies you can watch but never fix. Monitoring them is still worth it, for one reason: attribution. When the CRM stops working, a reachability check from your network tells you in seconds whether the problem is your link, their service, or one user's laptop. That decides whether the next step is troubleshooting, a status-page refresh, or a cup of tea. You cannot repair what you do not own, but you can stop burning hours diagnosing it.
Shared roots: why dependency checks punch above their weight
Here is the economics that makes all of this worth your time. Ordinary checks protect one thing each: the check on the file server protects the file server. Dependency checks protect everything downstream at once, because dependencies fan in. Your two DNS resolvers are a dependency of practically every service you run. One clean pair of DNS checks therefore stands guard over the whole estate. The same is true of the domain controllers, the NTP source, the core switch, the datastore, the UPS. A typical environment has thousands of things that could be checked, but only a dozen or so of these shared roots. That dozen participates in almost every outage worth having.
This is why dependency thinking is a scope tool and not just a troubleshooting trick. If your check budget is limited — and attention always is — the shared dependencies are the highest-leverage checks you can buy. It is also the flip side of the inheritance rule from criticality tiers. The more services stand on a dependency, the higher its tier, the deeper its checks, and the louder its alerts deserve to be. A humble box that forty services stand on is not humble. Rank it, monitor it, and treat its maintenance windows with the respect you would give the services themselves.
The hidden-dependency hunt
The eight families tell you where to look. But every environment also has dependencies nobody wrote down — the ones discovered at the worst possible time. Four techniques surface them in advance.
Outage archaeology. Your past incidents are a free dependency map. For each memorable outage, ask: what else broke when X died? If the last DNS hiccup also took out printing, badge access, and the phone system, you have just learned three dependencies no diagram mentions. Old tickets and the "remember when..." stories from long-tenured colleagues are primary sources here. To keep the map growing, make "what else broke, and was that dependency monitored?" a standing question in every post-incident conversation. Each outage then pays for itself with at least one new edge on the map.
Config reading. The application's own configuration confesses its dependencies. Connection strings name database servers. Mail settings name an SMTP relay. Log lines name license servers and API endpoints. Twenty minutes reading config files or watching which addresses a service actually talks to yields a truthful list. Software cannot hide what it connects to, however hard its documentation tries.
The service-map walk. Pick one service users care about and walk the full delivery path on a whiteboard. The path is user → Wi-Fi → switch → firewall → server → database → storage, plus the side-arrows to DNS, auth, and time. Every box you draw is a dependency; every box without a check is a gap. This is the same exercise as service-based monitoring, worked from the dependency angle.
Ask the owner. The person who runs the application can rarely list its dependencies. But ask "what breaks you?" and the stories pour out. "We go down whenever they reboot that box in accounting." "It dies if the license server is unreachable for an hour." Every story is a dependency edge, told by someone who paid for the knowledge.
Tip: you can spot-check the two sneakiest families by hand in under a minute while you decide what to automate. Manual checks do not scale, but they are a fine way to discover which checks your monitoring should be running for you. They can also prove to a skeptic that the resolver really is slow.
# does this specific resolver answer, and quickly?
nslookup app.company.local 10.0.0.5

# how far is this machine's clock from the time source? (Windows)
w32tm /stripchart /computer:your-ntp-server /samples:3
Designing monitoring around dependencies
Once dependencies are found and monitored, one design step keeps the new checks from drowning you. Most monitoring tools let you declare dependency relationships (sometimes called parent checks). The switch is the parent of the servers behind it. The resolver is the parent of the services that use it. When a parent goes down, the tool suppresses or downgrades the flood of child alerts. In that case, it sends you one message about the actual cause — "the switch is down," not forty variations of "a thing behind the switch is unreachable." Without this, dependency-aware monitoring makes outages louder; with it, outages get quieter and clearer at the same time. The mechanics of suppression, root-cause flagging, and correlation are their own subject — the alert correlation guides cover them properly.
Northgate Retail had every device in the building monitored and no parent relationships at all, because nobody had drawn the dependency. When the core switch lost a power supply at ten past two one morning, the monitoring did exactly what it was told. It raised one alert per unreachable device, which came to a hundred and twelve in four minutes. The on-call engineer read them in the order they were sorted, which was alphabetical by hostname. The switch was called sw-core-01. He reached it twenty-six minutes later, somewhere after the printers. The review recorded that the monitoring had "performed as configured". Declaring the parents took one afternoon, and the next uplink failure produced one message, which said what had broken.
One placement detail matters more than it looks. Check a dependency from where its consumers sit, not just from wherever the monitoring server happens to live. A DNS resolver can answer perfectly from the server VLAN and be unreachable from the branch office because of one firewall rule. A "green" check from the wrong vantage point proves nothing about the users who are suffering. The monitoring server has the best network view in the building, which is exactly why it is the worst witness to what users can reach. Where your tool supports remote probes or checks run from multiple locations, put the dependency checks on the same side of the network as the dependency's consumers. These are the people and systems that rely on the dependency.
Dependency knowledge also works in reverse, and the reverse view might save you more pain than the forward one. Before touching any box, ask: "what depends on this?" The switch you are about to reboot "quickly" — what hangs off it? The storage volume you are expanding — which VMs live there? A written dependency map turns pre-maintenance guesswork into a lookup. The map is the difference between a planned five-minute blip and an accidental company-wide outage with your name on the change record. If you cannot answer "what depends on this?" for a device, treat that as a finding in itself.
The classic blind spot catalog
Some dependencies get forgotten so reliably that they deserve a most-wanted poster. Each has a signature — a recognizable pattern of weirdness it produces when it fails. Learn the signatures and you will diagnose these in minutes instead of afternoons.
| The forgotten dependency | Symptom signature when it fails | The check that catches it |
|---|---|---|
| NTP / time sync | Logins fail "randomly," logs disagree about event order, jobs misfire — nothing crashes outright | Clock offset on key servers vs. a reference; alert past a few minutes of skew |
| DHCP | Network looks perfect on every graph; new and returning devices cannot join; complaints trickle in one laptop at a time | Service up + address pool (scope) usage; warn at 80% full |
| The license server | One application refuses to start or drops to read-only for every user at once; server metrics all normal | Reachability of the license host/port; expiry date of the license itself on a calendar check |
| The one switch in the middle | Two halves of the network each look fine but cannot see each other; everything pings from somewhere | Reachability + uplink port status for every switch on the path, not just the core |
| The internal mail relay | Applications work but their notifications, reports, and alerts silently stop arriving, including your monitoring emails | SMTP check that actually accepts a test message; a daily heartbeat message whose absence is the alarm |
| Service accounts & expiring passwords | A service that ran for years fails at a reboot or password-policy deadline; "nothing changed" | Monitor the services that log on with the account; keep expiry dates on the same calendar as certificates |
The mail relay row deserves a second look, because it fails in the one way monitoring cannot report. The first message to stop arriving is the one telling you that messages have stopped arriving. That is why the check is a daily heartbeat whose absence is the alarm, rather than an alert you would never receive.
Notice the family resemblance across the signatures: the healthy-looking estate with inexplicable behavior. That combination — all green, yet clearly broken — is practically a klaxon announcing that an unmonitored dependency has failed. When you see it, stop staring at the services and start walking the roots.
The dependency audit worksheet
Everything above condenses into one repeatable exercise. Take each Tier 1 service — if you have not ranked services yet, start there — and fill in one worksheet row per dependency. Name at least five, using the eight families as your prompt list. Then answer honestly whether each one has its own check today. Here is the worksheet mid-audit for a company's ERP system:
| Tier 1 service: ERP | Dependency | Family | Monitored today? | Action |
|---|---|---|---|---|
| 1 | Internal DNS (both resolvers) | Name resolution | Yes — real lookup, each resolver | — |
| 2 | Domain controllers | Authentication | Yes — service check + host health | — |
| 3 | Datastore LUN “PROD-01” | Storage | No — only the VM's own disks | Add datastore free-space check |
| 4 | Switch stack + firewall on user path | Network path | Partly — firewall yes, access switch no | Add switch reachability + uplink status |
| 5 | Web certificate on ERP portal | Certificates | No | Add expiry check, warn 30 days |
| 6 | NTP source | Time | No | Add clock-offset check on ERP + DCs |
A blank cell in the "monitored today?" column is not a failure — it is the entire point of the audit. Every "No" you convert into a check is one future sideways outage that will announce itself politely instead of arriving in disguise. Budget half an hour per Tier 1 service. Most teams finish their whole critical estate in an afternoon and find at least one datastore, certificate, or middle-switch surprise along the way. Then make the worksheet a living habit. Every new system's intake should include mapping its dependencies before go-live. That is exactly the step covered in the intake rule.
Where to go next
Dependency thinking is the second half of knowing what to monitor. The first half is ranking what matters. This half keeps the ranking honest by dragging the unglamorous, load-bearing systems into the light, one "what does this need?" at a time. From here, criticality tiers shows how dependencies inherit importance. And the not-to-monitor list covers the opposite decision — what deserves silence. The rest of Monitoring Scope: What to Watch (and Skip) ties scope into one discipline. When a sideways failure does slip through, the symptom signatures above will at least point you at the right root first. Watch the patient, by all means. Then put a check on the life support.
Put this into practice with SysPeep Monitor
Dependency thinking needs a tool that understands dependencies. SysPeep Monitor lets you define dependency relationships between checks. So when a switch dies you get one alert about the switch instead of forty about everything behind it. SysPeep Monitor's auto-discovery of devices and interfaces helps you find the middle switches and quiet infrastructure your services secretly stand on. The free trial runs on any Windows machine.
Download Free TrialLearn About SysPeep - All Rights Reserved.