
Monitoring Services, Not Devices: The Service-Map Approach
Here is a scene every admin eventually lives through. The dashboard shows sixty devices, every one of them green. The phone rings anyway: "the orders screen won't load." You stare at the wall of green dots, and the wall of green dots stares back. Neither of you knows which dot is lying. Technically none of them is. Every device really is up. What is down is something your monitoring has no word for: the service. That is the chain of six things that all have to work at once for an order to get entered. I lived through that scene more times than I would like to put in writing before I understood what was missing.
The fix is a mental flip from "is the server up?" to "can people work?" A simple artifact called a service map makes the flip practical. A service map is not enterprise software, a modeling language, or a diagram standard. It is a short, honest answer to one question per service: what does this actually depend on? This guide shows you what a map looks like and how to build one with a whiteboard and the right three people. It also shows the four concrete things that improve the day you have one. These are check design, alert meaning, outage communication, and your view of hidden single points of failure. At the end there is a one-hour version you can do this week.
In this guide
- The mental flip: devices vs. services
- What a service map is (two worked examples)
- Building maps with a whiteboard
- What maps change: checks, alerts, communication
- The shared-dependency discovery
- Keeping maps honest
- Service dashboards: the payoff
- Three questions people ask about maps
- The one-hour version
The mental flip: devices vs. services
Device-first monitoring is nobody's fault. It is simply what tools produce by default: discovery scans the network, finds routers and servers and printers, and offers to watch them. Devices are what monitoring sees. But devices are not what anyone experiences. No user has ever cared whether a server is up; they care whether they can send the invoice, take the order, print the label. A service, in this sense, is something people do, stated in business words — the same language you used when defining your monitoring goals. "People can take orders." "Email works." "The warehouse can print labels."
The gap between the two views is where that opening scene comes from. A service can be down while every device behind it is green (the app is hung, but the server answers pings). A device can be down while every service hums along (the redundant switch died, and its twin picked up the load). You would like to know about that calmly, not urgently. The service map is the bridge: it records, for each service, the chain of devices and dependencies underneath it. So the two views can finally talk to each other.
Northgate Retail had a device-first estate of the classic kind: two hundred and ten devices. Every one of them was polled, nearly all of them green at any given moment. On a payroll run day the finance director rang to ask whether payroll was up, and the admin on duty could not say. He could say that the payroll server answered pings, and that its disk was at 61 per cent. He could say that the switch it hung off had no port errors. The finance director asked the question again, more slowly. Payroll, it turned out, also needed a file share and a license server. It needed a scheduled job on a box nobody had ever thought of as a payroll box. The job had been failing quietly since the previous Thursday. The map drawn that afternoon had seven entries under "Payroll runs". The monitoring had been watching three of them, very carefully.
What a service map is: two worked examples
Let's decompose two everyday services and watch the method appear. Start with the deceptively simple claim "email works." For a user, that means one thing: they hit send and the message goes. Behind that single act stands a chain: their mail client has to run. The LAN or Wi-Fi — the local network, wired or wireless — has to carry the traffic. DNS (the network's phone book, turning names into addresses) has to resolve the mail server's name. The mail server or cloud tenant (your company's own slice of the provider's service) has to accept the message. If mail lives in the cloud, the internet path has to be up and reasonably quick. And before any of it, authentication — the sign-in service — has to have let them in. Six links. A failure of any one produces the identical user report: "email is down." The map is what lets you hear six different possible meanings inside those three words.
Now a business-specific one: "people can take orders" at a company that ships physical goods. The order screen is served by an application server. The app stores everything in a database. Attached documents live on a file share. The whole conversation crosses the core switch. Names resolve through DNS again. And the finale — the part everyone forgets because it is not a computer — is the label printer in the warehouse. Without it, the order exists but the pallet cannot leave. If any link in that chain fails, revenue stops moving, and it does not matter one bit which link it was.
Notice what sneaks onto maps once you start drawing them: dependencies that are not devices at all. The TLS certificate on the order page — the file that puts the padlock in the browser — is a dependency. It can "fail" on a perfectly healthy server the day it expires. The license server for the design software is a dependency. So is time itself: authentication systems get grumpy when clocks drift, which makes your time-sync service a quiet ancestor of "people can sign in." A good map records whatever the service truly needs, computer-shaped or not.
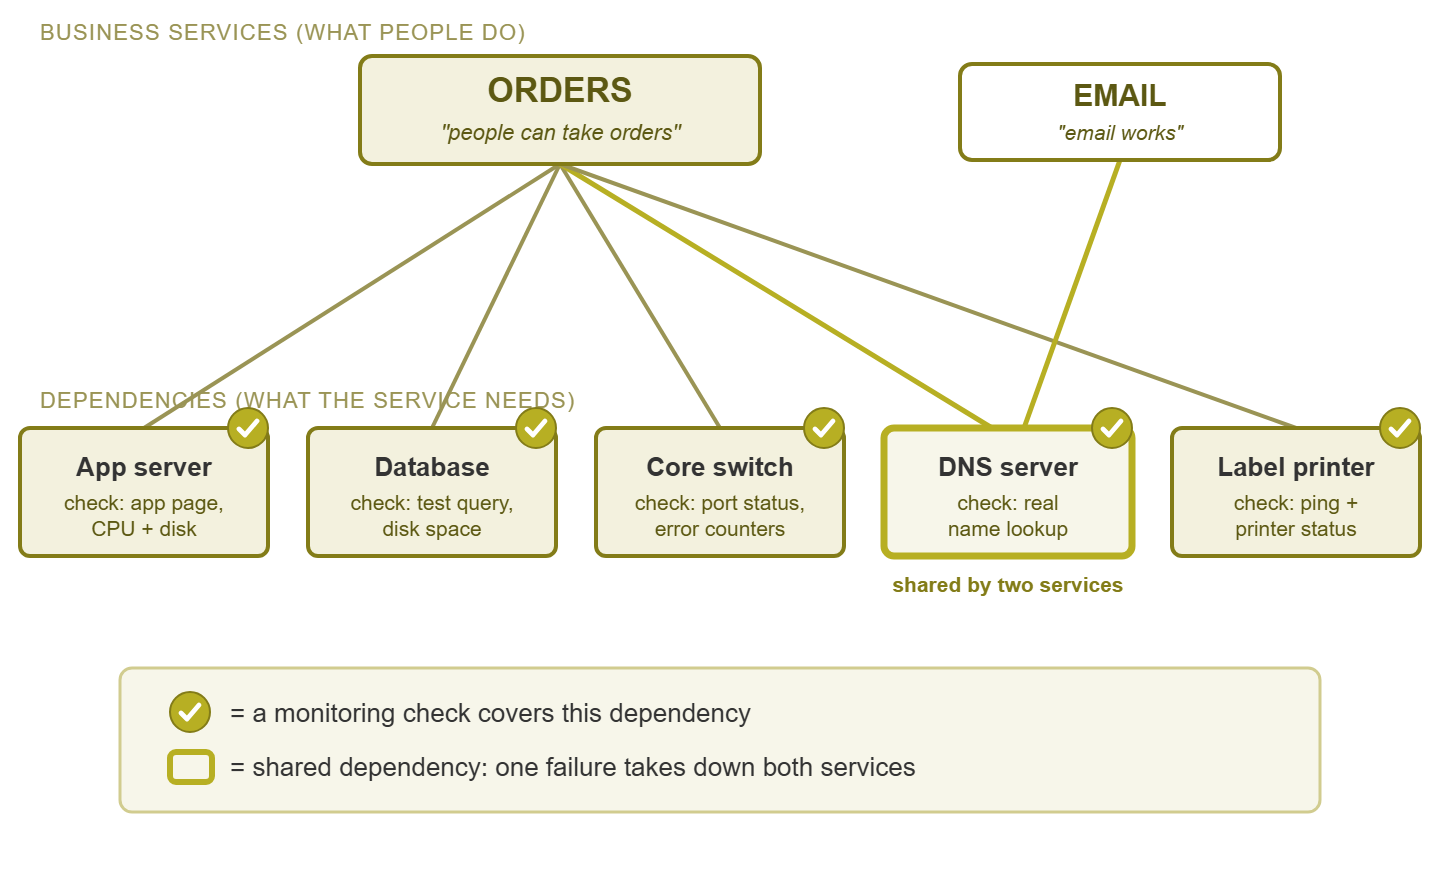
Figure 1: A service map for "Orders." Every dependency carries a check, and the highlighted DNS server is shared with Email — one failure, two services down.
Building maps with a whiteboard
You do not need dependency-mapping software, an agent on everything, or a data model. You need a whiteboard, an hour, and — this part is not optional — the people who actually do the work. The admin knows the infrastructure. The order-desk lead knows that step four of every order involves a scanner and a shared spreadsheet the admin has never heard of. The method:
- 1. Write the user action at the top. Not a system name — an action: "a customer's order gets entered and a label prints."
- 2. Ask "what does this need to happen?" Write every answer below it: the app, the network path, the sign-in, the printer.
- 3. Ask the same question of each answer. The app needs its server and its database; the database needs its disk; the path needs the switch. Walk backward until you hit bedrock.
- 4. Stop at the boundary of your control. The ISP's backbone and the cloud provider's data center are real dependencies you cannot see inside. Mark them at the edge — your check there is "can we reach it, and how fast," which is exactly what your users experience anyway.
- 5. Have the workers check your chain. Ask "so if all of this is up, you can always finish an order?" The answer is reliably "well, except when..." — and whatever follows except goes on the map.
Then get it off the whiteboard before someone erases it. The permanent home does not need to be a diagram at all. A four-column table does the job, and the fourth column is where the value hides:
| Service | Depends on | Already monitored? | Gap |
|---|---|---|---|
| Orders | App server (app service, CPU, disk) | Ping only | Add app + resource checks |
| Orders | Database server | Yes — full checks | — |
| Orders | Core switch | Yes — ports + errors | — |
| Orders | DNS server | No | Add lookup test |
| Orders | Label printer (warehouse) | No | Add ping + status check |
| DNS server, internet path, cloud tenant | Partial | Add reachability test to tenant |
That "gap" column is a to-do list you did not have this morning, sorted by business impact for free. That is because every row already belongs to a named service whose priority you know.
Tip: resist the urge to make the map complete or beautiful. A rough map of your top three services, finished this week, beats an exhaustive dependency model that is still a project next quarter. Maps earn their keep by existing, not by being perfect.
What maps change: checks, alerts, communication
Check design becomes derivation, not inspiration
Without a map, choosing checks is a creative exercise — you monitor what occurs to you. That is how estates end up with forty sensors on a test VM (virtual machine) and nothing on the label printer. With a map, checks are derived: walk the dependency column and give each entry the check that matches what it is. The app server gets a real application check (does the order page load?) plus CPU, memory, and disk. The database gets a query test and disk space. The switch gets port status and error counters. DNS gets an actual name lookup, not a ping. The printer gets reachability and, if it speaks SNMP, its own status codes. SNMP is Simple Network Management Protocol, the standard way a device reports its own status. If you want sensible starting checks and thresholds for each dependency type, the first ten checks covers them one by one. And the map points out one check nobody derives from a device list: the end-to-end test that performs the user's action itself. That means loading the order page, resolving the name, and timing the response. Blending those user's-eye tests with your device checks is its own craft, covered in blended monitoring design.
Alerts start meaning something
"Switch 3 is down" is a fact. "Switch 3 is down, and Orders, Label Printing, and the phone system stand behind it" is a situation. It is the same event, transformed by dependency context into something that tells you how fast to run. The map is what adds that second sentence. It also works in reverse to quiet things down. When the switch dies, you do not need twenty separate alerts for everything behind it screaming individually. Most monitoring tools can express dependencies — "if the switch is down, suppress the alerts for things reached through it". But they can only encode a map you have actually drawn. One root-cause alert with service context beats twenty symptoms every time, at 3 PM or 3 AM.
Outage communication writes itself
During an incident, the hardest message to compose is the one to non-technical people. That is because the honest technical answer ("a switch is down") answers nothing they asked. The map performs the translation mechanically: find the dead dependency, read up the map, and the affected services fall out. "Orders and label printing are down; email and phones are fine; next update in twenty minutes" — that sentence is only possible because the map says which services stand on the broken thing. It is the difference between an IT team that sounds in control and one that sounds like it is guessing. And it costs nothing extra during the worst moments, because the thinking was done on a calm afternoon. Nobody draws a good map during an outage; I have watched several people try.
The shared-dependency discovery
Draw maps for three or four services and an uncomfortable pattern appears: the same box keeps showing up at the bottom. The one DNS server that every chain passes through. The single core switch under everything. The one authentication server that gates every sign-in, or the file server that turned out to be quietly load-bearing for three departments. You drew the maps to design checks, and accidentally performed a single-point-of-failure audit — the cheapest one in IT. That is because a consultant charges real money for the same picture and gets it from the same interviews.
Here is what to do with the discovery, in escalating order of cost. First, monitor the shared box hardest of all. Its detection goal is inherited from the most critical service standing on it, not the least. Second, treat changes to it with matching respect; the shared dependency is the last place for casual Friday firmware. Third, if redundancy for it ever needs justifying, the map is the business case. "This one device carries orders, email, and phones" is a sentence budget holders understand without a single acronym. Whether the answer is a second unit or accepted risk, the decision is now deliberate rather than a surprise waiting for its moment.
Keeping maps honest
A map is a claim about reality, and reality moves. The mail server migrates to the cloud and the new quoting app quietly acquires a database. The label printers get replaced with networked ones on a different VLAN (a virtual LAN, a separately fenced slice of the switched network). Six months later your map describes a company that no longer exists. A wrong map is worse than none, because people trust it during incidents, precisely when trusting it costs the most.
Three habits keep the drift in check. Review on change: any project that adds, moves, or retires a system ends with a two-minute question: "which service maps does this touch?" Answer it before the project is called done. Give each map an owner: one named person per service map, typically whoever runs the service, so staleness has an address. Verify on a schedule: once or twice a year, walk each map against reality. That is exactly the exercise the coverage review formalizes, using the map's gap column as its input. None of the three takes an hour; together they are the difference between a living document and a fossil.
Service dashboards: the payoff
Here is where the work pays off visibly. A device-level dashboard shows forty green dots. When the boss asks "is everything OK?", forty green dots is not an answer — it is a data set. Group the checks by the service they belong to (the map tells you which is which). Then the dashboard can finally speak the language of the goals page: Orders: OK. Email: OK. Label printing: DEGRADED. Phones: OK. Four lines, readable from across the room, by anyone in the company.
The grouping needs a roll-up rule, and simple works. A service shows down if any dependency on its critical path is down. It shows degraded if a redundant leg or a non-blocking dependency is out (one of two label printers, say — work continues, slower). It shows OK otherwise. The rule does not need to be clever. It needs to be honest. That way, the day the dashboard says all services are green and a user calls anyway, you treat it as a map bug. That is a dependency you have not drawn yet — and you fix the map. Over time the dashboard becomes the shared answer to "are we OK?" for people who will never once care what a switch is. That is, quietly, the whole point of monitoring.
Three questions people ask about maps
How deep should the map go?
Stop at the level where you can check something and act on it. "Database server" is a useful map entry because you can monitor its disk and restart its service. "The database server's RAM module in slot 2" is not. That is because no check you run day to day sees that layer. No action of yours addresses it short of a hardware call. The practical bottom of most maps is: the device, its key resources (CPU, memory, disk), the service or process on it, and the network path to it. If a dependency is real but unwatchable, it still belongs on the map, marked as boundary. Examples include the ISP's core (your internet service provider's own network) and the cloud provider's storage layer. Marking it this way means nobody wastes an incident hour looking for it inside your walls.
Where does redundancy go on the map?
Draw both legs, and mark them as a pair. A service standing on a redundant pair is degraded, not down, when one leg fails. That distinction is exactly what your roll-up rule and your alert urgency should express, and the map is where it gets recorded. Drawing redundancy honestly also exposes the industry's favorite illusion: the "redundant" pair whose two legs run through the same switch, power strip, or ISP. If both legs of anything converge on one box further down the map, you have one leg with extra steps. It is better to learn that from a whiteboard than from an outage.
Do cloud services belong on the map?
Emphatically yes — they are dependencies like any other, just ones you monitor from the outside. Map the cloud service at your boundary, along with everything on your side that reaching it requires: the internet link, DNS, the firewall. Your check is "can we reach it from here, and how fast" — which mirrors the user's experience exactly. During an incident, this section of the map separates "our link is down" (your problem, fix it) from "the provider is having a day" (their problem, your communication task). Without the map, both look identical: a chorus of "email is broken."
The one-hour version
You do not need a mapping project. This week, take your top three services. If you have written a goals and scope page, they are the top three lines. If not, "which three things would generate calls within ten minutes?" is a fine proxy. Spend twenty minutes per service with one person who does that work daily. Put the user action at the top, walk backward, mark the boundary, and capture it in the four-column table. Then read down the gap column and fix the single worst hole. That is usually an unmonitored dependency of your most important service, and usually a ten-minute fix once you can see it. Finding the hole is the hour; fixing it is the ten minutes.
One hour, three maps, one closed gap, and the flip has happened: your monitoring now describes what people do, not just what you own. The next time the phone rings while the wall is green, the dots will have something to say for themselves. The rest of the strategy series builds on that foundation. It covers writing the requirements document your maps feed into, plus the standards and reviews that keep a growing setup coherent. They are all collected in Building a Monitoring Strategy.
Put this into practice with SysPeep Monitor
Once your service maps exist, the tool's job is to make them operational. SysPeep Monitor auto-discovers the devices behind each service and checks them over SNMP, WMI and SSH. It lets you wire up dependencies so one dead switch raises one meaningful alert instead of twenty. Live dashboards and network maps show status at a glance. The free trial runs on any Windows machine.
Download Free TrialLearn About SysPeep - All Rights Reserved.