
A Blended Monitoring Design on a Small Budget
Anyone who has read about active versus passive monitoring already knows the diplomatic conclusion: you need both. Passive monitoring watches what your devices and your traffic actually do. Active monitoring sends test traffic to find out what a user would experience right now. Each covers the other's blind spots. All of that is true. None of it helps the moment you sit down to build something, because "use both" is not an architecture. The reference architectures that are easy to find assume a bigger team and a bigger budget than most organizations of this size have.
This guide is the missing middle: a concrete reference design for an organization of roughly 100 to 300 people. One main site or a few, a rack of servers, a growing pile of cloud apps, and one person (possibly you) responsible for all of it. The design combines both monitoring modes in six components, most of them features your equipment already has. Nearly everything runs on a single modest virtual machine. For each component you get the job it does, the questions it answers, and an honest effort rating. You also get a build order in which every phase pays off before the next one begins. I have built this design three times, at three employers, and the parts list has not changed. You do not have to buy everything. You barely have to buy anything.
In this guide
- The two modes in thirty seconds
- The design at a glance
- Ground rules: what "small budget" means
- The passive layer: SNMP, one flow source, syslog
- The active layer: reachability, synthetics, path tests
- The build order: four phases
- What one modest VM can host
- The coverage map and the design on one page
- A design that absorbs growth
The two modes in thirty seconds
Passive monitoring observes things that are happening anyway. A switch counts the traffic crossing each port. A firewall writes a record of each connection it forwards. A server reports its own disk space and narrates its own events into a log. Active monitoring is the opposite: it creates traffic that exists only to be measured. That could be a ping, a test web request, or a scripted login performed by a robot user every few minutes. Passive tells you what the infrastructure is doing; active tells you what a user would experience if they tried. The pillar covers the full argument and the failures each mode is structurally unable to see. It has Active vs. Passive Monitoring, Explained and The Blind Spots of Active and Passive Monitoring. This guide takes the short version and gets on with the building.
The design at a glance
The design has two layers and two vantage points. The passive layer is three components. It includes SNMP polling across your network gear and servers, flow export from exactly one device (your internet edge), and device logs collected in one place. The active layer is three more components. First come reachability tests for your public services run from outside the firewall. Next comes a small handful of synthetic transactions against the applications people would riot over. Last come scheduled path tests to the few destinations your business depends on. Everything indoors runs on one collector VM; the outside tests run from one cheap external vantage point.
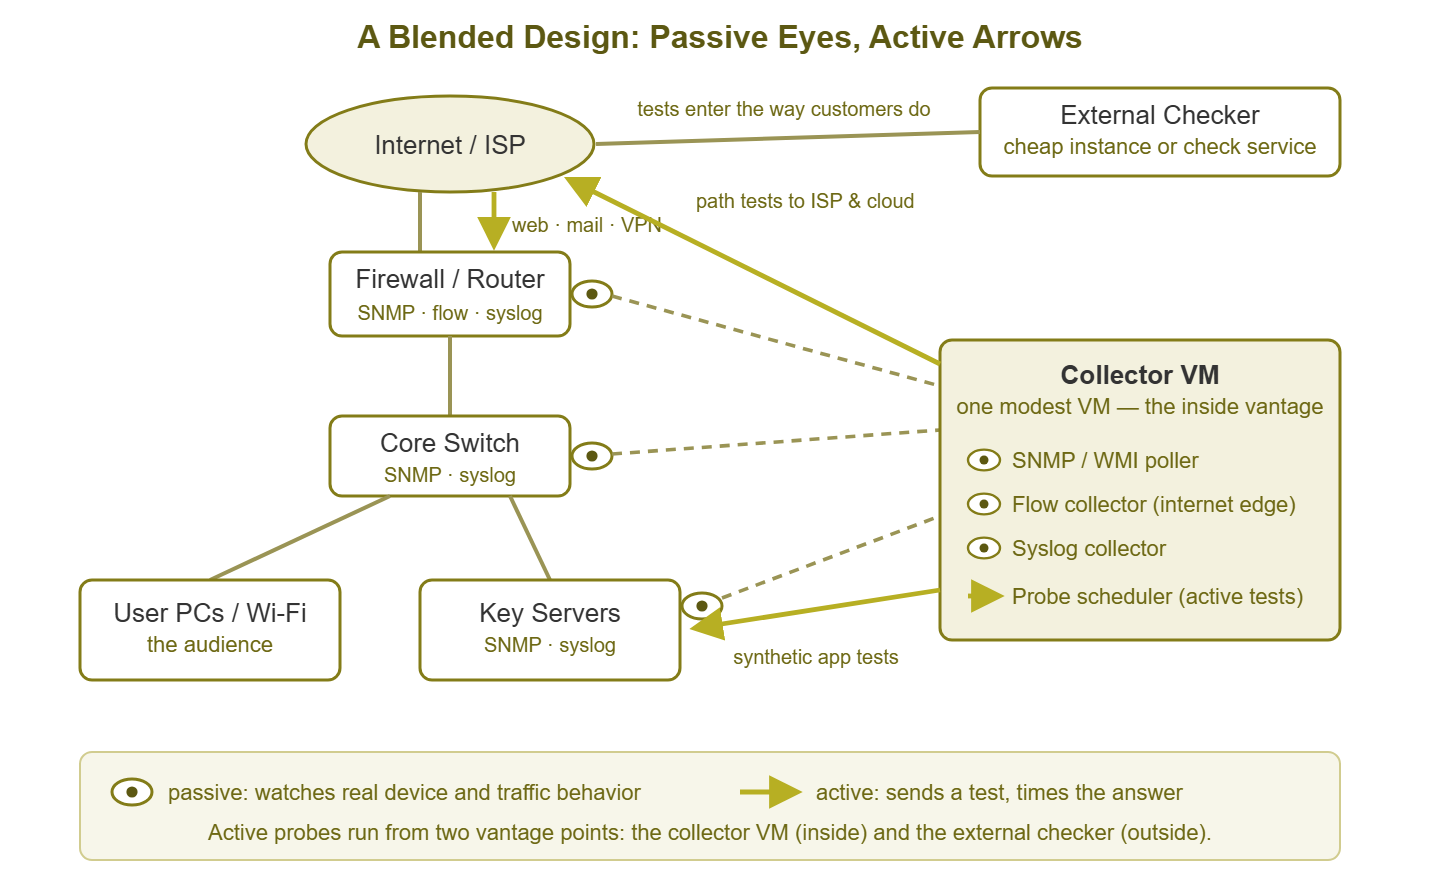
Figure 1: The blended design. Eyes sit still and watch real behavior (SNMP, flows, syslog); arrows spend a little test traffic to ask specific questions, from two vantage points.
Keep the eyes-and-arrows picture in mind. The eyes are cheap per fact learned, because real activity generates the evidence. The arrows are precise per question asked, because you choose what to test and from where. The coverage map near the end shows which questions land with which component.
Ground rules: what "small budget" means
The design assumes an environment like this: 100 to 300 users and one or two internet connections. It has a business-grade (not necessarily new) firewall and a stack of managed switches. It has a few Windows or Linux servers, probably virtualized, with the rest of the app portfolio in the cloud. There may be a remote site or two. If that is roughly you, the main cost of this design is your time. That is why every component below carries an effort rating.
"Small budget" means no new appliances and no per-seat observability suite (the kind of product priced by how many users or hosts it watches). You build from four things. First, use features your equipment already has. SNMP is built into nearly every business-grade switch, firewall, printer, and UPS, the uninterruptible power supply under the rack. Flow export is built into most business firewalls; syslog into almost everything with a power cord. Second, use one modest VM to collect it all. Third, use a monitoring package. Capable options exist at small-organization prices, and some cost nothing but setup time. Fourth, spend a token amount for an external vantage point. That can be a cheap hosted check service or a tiny cloud instance.
One more ground rule, and it is the important one: every component must earn its place by answering questions you actually get asked. "Is it down?" "Why is the internet slow?" "What happened last night?" "Can customers reach us?" Anything that does not answer a real recurring question is out, no matter how impressive it looks in a screenshot.
The passive layer: three components
The passive layer is the always-on half of the design. Once configured, it collects around the clock whether or not anything is wrong — which is exactly what makes it the right place to start. When trouble comes, the history is already there.
Component 1: SNMP polling on gear and servers — the workhorse
SNMP (Simple Network Management Protocol) is the standard question-and-answer protocol that nearly every business device speaks. Your collector VM asks each device every few minutes: are your ports up? How much traffic crossed each one? Any errors? How are your CPU, memory, and temperature? Servers answer the same kinds of questions over SNMP, WMI (Windows Management Instrumentation, Windows' own way of answering them), or a small agent. They add disk space and service status. A note for the pedantic (a group that includes all good admins): polling does send packets. But it sits in the passive column because it observes what is really happening rather than staging a fake user action.
This single component catches most infrastructure failures outright: the dead device, the down uplink, the filling disk, the port quietly accumulating errors. It also builds the baseline graphs every later diagnosis leans on. It is the first thing you build and the last thing you would give up. What it answers: is it up, how busy is it, what does normal look like. Effort: low. Enable read-only SNMP on each device, point the poller at it, and let discovery find the interfaces. The fiddliest part is choosing alert thresholds, and you can borrow sane starting values rather than invent them. The whole protocol has its own pillar at SNMP Monitoring when you want depth.
Component 2: One flow source at the internet edge
A flow record is a small summary a router or firewall writes about each conversation crossing it. It records which internal machine talked to which outside address, on what port, for how long, and how many bytes moved. Think of it as an itemized phone bill — who called whom and for how long — rather than a recording of the calls. The common technologies are NetFlow, sFlow, and IPFIX, covered in the Flow Monitoring pillar. This design uses exactly one exporter: the device at your internet edge.
Why only one, and why there? Because SNMP already tells you the WAN link is 90% full — what it cannot tell you is who is filling it. Flow data answers the "who and what" question: the cloud backup that never finished, the workstation uploading something enormous, the conference room streaming in ultra-high definition. On a small network, the internet link is the one resource everyone shares and everyone complains about. So the edge is the one place flow data pays for itself immediately. Effort: moderate. Enabling export is a few configuration lines on most firewalls. The collector runs on your VM. The real effort is learning to read top-talker reports (the ranked list of which machines moved the most traffic). One honest caveat: some cheaper edge devices cannot export flows at all. Check yours before promising this layer. If it cannot export flows, the rest of the design still stands, and flows can wait for the next refresh.
Component 3: Device syslog to one collector
Syslog is the ancient, universal way devices send one-line event messages to a collector the moment things happen. Examples include "interface down," "VPN tunnel established," "failed login," "configuration changed." Point your firewall, switches, servers, and UPS at the collector VM, and you suddenly have one searchable timeline of everything your infrastructure felt strongly enough to mention.
The log layer has two jobs. The first is forensic: when something broke at 3:12 AM, counters tell you that it broke. But logs often tell you why — the tunnel renegotiated, the power blinked, someone changed a config at 3:11. The second job is a short list of live alert patterns: tunnel down, hardware errors, authentication storms (bursts of failed logins from one source). The discipline is the word short. Logs are noisy by nature, and alerting on everything interesting-looking is how log projects die. Effort: low to start — typically one configuration line per device — and moderate to keep useful, because the restraint is the skill. The Syslog & Log Collection pillar covers collection, parsing, and retention properly.
The active layer: three components
The active layer spends a little test traffic to answer the question the passive layer never can: would it work if someone tried right now? It is also your only view from places you do not control — most importantly, the outside world.
Component 4: External reachability tests for key services
From a vantage point outside your firewall, test the services the outside world uses, every few minutes. Does the website load, and does it contain the words it should? Does the mail server answer? Does the VPN portal (the virtual private network front door that remote staff log in through) respond? These are simple availability checks with one crucial property: they take the customer's road in. Public DNS, your ISP, your firewall's inbound rules, your TLS certificate exactly as strangers see it.
That property makes this the only component that catches the "works inside, broken outside" family of failures. Examples include the certificate that expired on the public listener only and the port-forward broken by last week's firewall change. Another is the DNS record that quietly stopped pointing where you think it points. From your desk, everything looks fine, because your traffic takes a different road. Effort: low. Hosted check services exist, a tiny cloud instance works, and the checks themselves are one-liners.
Component 5: A handful of internal synthetic transactions
A synthetic transaction is a scripted fake user. Every few minutes it logs into the ERP (the enterprise resource planning system: the big application that runs orders, stock, and invoices) and opens a record. Or, on that schedule, it runs a known query against the database, or opens a file on the share. In each case, it times every step and complains when a step fails or crawls. It is the only monitoring that experiences an application the way a person does. It goes through the login, the application logic, and the database, rather than just confirming that a network port answers.
The design calls for a handful — the top five applications by scream volume. That is because this is the highest-effort component per unit in the whole design. Scripts must be written, and then repaired every time the application changes its login page or moves a button. Five scripts you maintain beat fifty that rot. Choosing what the script should do, and avoiding probes that pass while users suffer, is its own craft. It is covered in Designing Synthetic Probes That Mimic Real Users. Effort: the highest here. Budget an evening per application, plus occasional repairs, and spend it only on apps whose failure you must know about within minutes.
Component 6: Scheduled path tests to critical destinations
A path test repeatedly measures the route between you and a destination: the latency, the packet loss, and the list of router hops in between. Think of traceroute (the tool that lists every router between you and a target) given a memory and a schedule. Aim it at the short list of destinations your business depends on: your ISP's gateway, your main cloud suite, each remote site, your phone provider.
Path tests answer the eternal triage question — is it us, our ISP, or the far end? — and they quietly build the evidence file for provider disputes. "Loss began at your second hop on Tuesday at 14:00, here is the chart" is a very different phone call from "it feels slow lately." Effort: low. Many monitoring tools include this, and free utilities cover it otherwise.
The build order: passive core first
Build in four phases, each independently useful — if life interrupts the project (it will), you keep everything already built.
Phase 1 — SNMP on the core (a weekend)
Firewall, switches, key servers, UPS. If you want the exact target list with starting thresholds, the fundamentals pillar has it ready-made: the first ten checks are precisely this phase. Payoff: most outages now announce themselves to you before users do.
Phase 2 — Active checks for the top five services (an afternoon, plus tinkering)
Pick the five services whose failure generates the loudest, fastest screams. Typically, those are the internet link, the public website and mail from outside, the main line-of-business app, and the file share. Stand up the external vantage and the first synthetic or two. Payoff: you are now measuring user experience, not just infrastructure pulse.
Phase 3 — Flows at the edge (an evening)
Enable export on the edge device, start the collector, find the top-talkers report. Payoff: "why is the internet slow?" changes from speculation to a thirty-second lookup.
Phase 4 — Syslog plus a short alert list (an evening, then pruning)
Point devices at the collector, then define a handful of alert patterns. The payoff is a forensic timeline for every incident, plus alerts for events no counter can see. Those include tunnel flaps (a tunnel dropping and re-establishing over and over) and authentication storms.
Why this order? Coverage per hour of effort. The passive core is the widest safety net per hour you will ever spend. Active checks come second because they close the user-experience gap on exactly the services people yell about. Flows and logs are mostly diagnosis layers: they explain problems more often than they announce them. So they land best once you have alerts worth explaining.
Tip: resist the heroic all-in-one-week build. Every phase produces a tuning tail — thresholds that are wrong for your network, log patterns that fire too often. Let each phase settle until its alerts are trusted before adding the next, or you will spend week two learning to ignore your own monitoring.
What one modest VM can host
Here is the "one collector machine" reality, and it is good news. At this scale, everything indoors fits on one unremarkable VM. An SNMP poller asking a few dozen devices a few questions a minute is trivial arithmetic for a modern CPU. A flow collector for one edge link is light work at these volumes. A syslog collector for a few dozen chatty devices barely registers. The probe scheduler is lighter still. Monitoring workloads at this size are mostly remembering, not computing.
One collector VM — a sane starting size
  CPU:   2 vCPU
  RAM:   4-8 GB
  Disk:  100+ GB   <-- the number that actually matters
  Runs:  SNMP/WMI poller + flow collector + syslog + probe scheduler
  Rule:  not hosted on any server it monitors
Disk is the number that matters because metrics are tiny while flows and logs have an appetite. Set retention on day one: keep flow detail for a few months and logs for whatever your policies require. Add a check on the collector's own disk. Yes, the monitoring VM monitors itself, because a full disk on the collector is the one outage nothing else will report.
Two placement rules complete the picture. First, do not host the collector on a production server it monitors, or one crash takes out both the patient and the doctor. Second, give the VM a heartbeat visible from somewhere else. Even a daily "I am alive" message whose absence tells you something is wrong will do. A silently dead monitor provides confidence instead of coverage. And component 4 cannot live here by definition; a "from outside" test run from inside is just a very confident lie.
The coverage map
The payoff of blending shows up when questions land in your inbox — each now has a component whose actual job is answering it:
| Question you get asked | Layer that answers it |
|---|---|
| "Is anything down right now?" | SNMP polling; external checks for the public side |
| "The internet is slow — who is using it?" | SNMP (how full) + edge flows (who and what) |
| "A customer says the site is down, but it works for me" | External reachability from outside |
| "Can people actually log into the ERP?" | Internal synthetic transaction |
| "What happened at 3:12 last night?" | Syslog timeline |
| "Is our ISP getting worse?" | Path tests + SNMP history |
| "Which disk fills up next month?" | SNMP/agent trends |
| "Did the VPN tunnel flap again?" | Syslog alert, corroborated by path tests |
Notice what is deliberately absent: full packet capture, per-user traffic inspection, application tracing. Those answer rarer questions at much higher cost. On a network this size you can capture packets on demand during the occasional mystery instead of running the machinery always.
The coverage map is also what stops a blended design from being two designs that happen to share a building. Tollgate Foods had an SNMP poller run by the network team and a hosted external check service set up by the web team. The two had never been introduced. One night, the ordering site's certificate expired on the public listener only. The external check went red in a mailbox nobody opened before nine. The SNMP wall stayed green all night, because the server was up and the port was answering. The two teams spent the first hour of Monday assuring each other that their monitoring showed nothing wrong. Both were telling the truth. The review called it "a reconciliation gap". The external checks now alert into the same console as everything else, and every row of the map above has exactly one owner.
The whole design on one page
| Layer | Component | What it answers | Effort |
|---|---|---|---|
| Passive | SNMP polling on all gear and servers | Up or down, load, errors, capacity, history | Low — enable, point, tune thresholds |
| Passive | Flow export at the internet edge only | Who and what is filling the WAN | Moderate — enable export, learn the reports |
| Passive | Syslog to the collector VM | Causes, timeline, a few event alerts | Low to start; restraint to maintain |
| Active | External reachability from an outside vantage | Can the world reach our public services | Low — simple checks, cheap vantage |
| Active | About five internal synthetic transactions | Can users actually use the key apps | High per app — scripts need upkeep |
| Active | Scheduled path tests to critical destinations | Is it us, the ISP, or the far end | Low — built into many tools |
A design that absorbs growth
Nothing in this design is a dead end, which is its quiet advantage. A second site earns a lightweight probe running the same checks from a new vantage point. Another critical application earns synthetic number six. Auditors make the syslog layer grow retention rather than be replaced; serious capacity planning adds a second flow source. Every component deepens in place; none gets thrown away. Organizations that skip the blend usually discover the gap during an incident — passive graphs all green while customers cannot log in. In those cases, they rebuild under pressure. You are building the same thing calmly, in four phases, on one VM.
If you are starting from zero, start tonight with phase 1 and the first ten checks. This guide compressed some judgment calls: which mode catches which failure and how to write probes that do not lie. When you hit those calls, the rest of the Active vs. Passive Monitoring pillar takes each in turn. This is what "use both" looks like once it is an architecture. It has six components, four phases, one VM, and one console where the answers to every question on the map land together.
Put this into practice with SysPeep Monitor
The passive workhorse in this design discovers your devices and polls health over SNMP and WMI. It uses thresholds and dependency rules that keep alert noise down. That is exactly what SysPeep Monitor automates. SysPeep Monitor runs as a central service on one modest Windows machine, with optional lightweight remote probes when you add sites. It shows everything in a single web console. The free trial installs in minutes, which pairs nicely with a phase 1 weekend.
Download Free TrialLearn About SysPeep - All Rights Reserved.