
Active vs. Passive Monitoring, Explained Through Five Real Scenarios
Ask two experienced admins how a network should be monitored and you will get two answers. They will be delivered with some heat. One says active monitoring: send test traffic around the clock. That is the only way to know something broke before a user tells you. The other says passive monitoring: watch the traffic that already exists. A test ping says nothing about what real users are experiencing. Both are right about what their preferred mode does well. Both are describing half of a monitoring system. I have argued each side with real conviction, about a year apart. I was proved wrong both times by the same network.
This guide settles the argument the practical way. First the definitions: what each mode does, and what kind of question it can answer. Then come five situations every admin meets sooner or later. They include a nighttime outage, a vague slowness complaint, and a budget question. The other two are a provider dispute and a problem that only happens some evenings. For each one you will see which mode catches it, which one stares straight past it, and why. By the end, "active or passive?" should feel less like a debate and more like choosing between a screwdriver and a hammer. You look at the job, and the tool picks itself.
In this guide
- The two modes, defined
- Scenario 1: the 2 a.m. outage
- Scenario 2: "the app is slow for some users"
- Scenario 3: the capacity review
- Scenario 4: holding your ISP to its SLA
- Scenario 5: the some-evenings problem
- The honest comparison table
- Why the argument is fake
The two modes, defined
Active monitoring means your monitoring system generates traffic whose only purpose is to be measured. The classic examples form a ladder of increasing realism. A ping is a tiny "are you there?" message that any live device will answer. It proves reachability and measures the round-trip time. A port check goes one step further. It opens a connection to the numbered doorway a specific service listens on. That might be port 443 for a secure website or port 25 for mail. The port check confirms that something answers the knock. At the top sits the synthetic transaction: a scripted fake user. It logs in, searches, and downloads exactly the way a person would. The common thread is that the traffic is synthetic — manufactured purely for testing. It runs on a schedule you chose.
A useful mental picture: active monitoring is a night watchman. He walks the same route every hour and rattles every door on his list. He radios in the moment a door that should open, doesn't. He never waits for something to happen. He goes and checks.
Passive monitoring means observing activity that would exist whether or not you were watching. One example is reading the traffic counters that every switch and router keeps for each of its ports. These counters are usually collected over SNMP (Simple Network Management Protocol). This is the standard way monitoring tools ask devices about themselves. Another example is collecting flow records — summaries a router can export. They say who talked to whom, when, and how much. This is a discipline of its own, covered in the flow monitoring guides. Then there is gathering logs, the diary every server and service writes as it works. And, in deeper setups, there is mirrored traffic. A switch is configured to copy real packets to an analyzer that reads them like mail. The common thread here is the opposite one: the thing being measured is real activity. It is produced by real users and real systems going about their day.
Passive monitoring is the security camera over the loading dock. It never opens a door and never rattles one. But when you need to know what actually happened on Tuesday afternoon, the camera has the answer. It shows who came through, how much they carried, and when the crowd peaked. The watchman does not have that answer.
One nuance trips up nearly every newcomer, so let's retire it early. The label describes what is measured, not how the measurement travels. When your monitoring server polls a switch over SNMP, it does send a small query — technically, traffic. But the numbers that come back describe real user traffic passing through the switch. So this counts as passive monitoring: you collected an observation. You did not create the thing observed. The test that always works is a single question: did my monitoring generate the activity being measured, or merely collect evidence of it? Generated it: active. Collected it: passive.
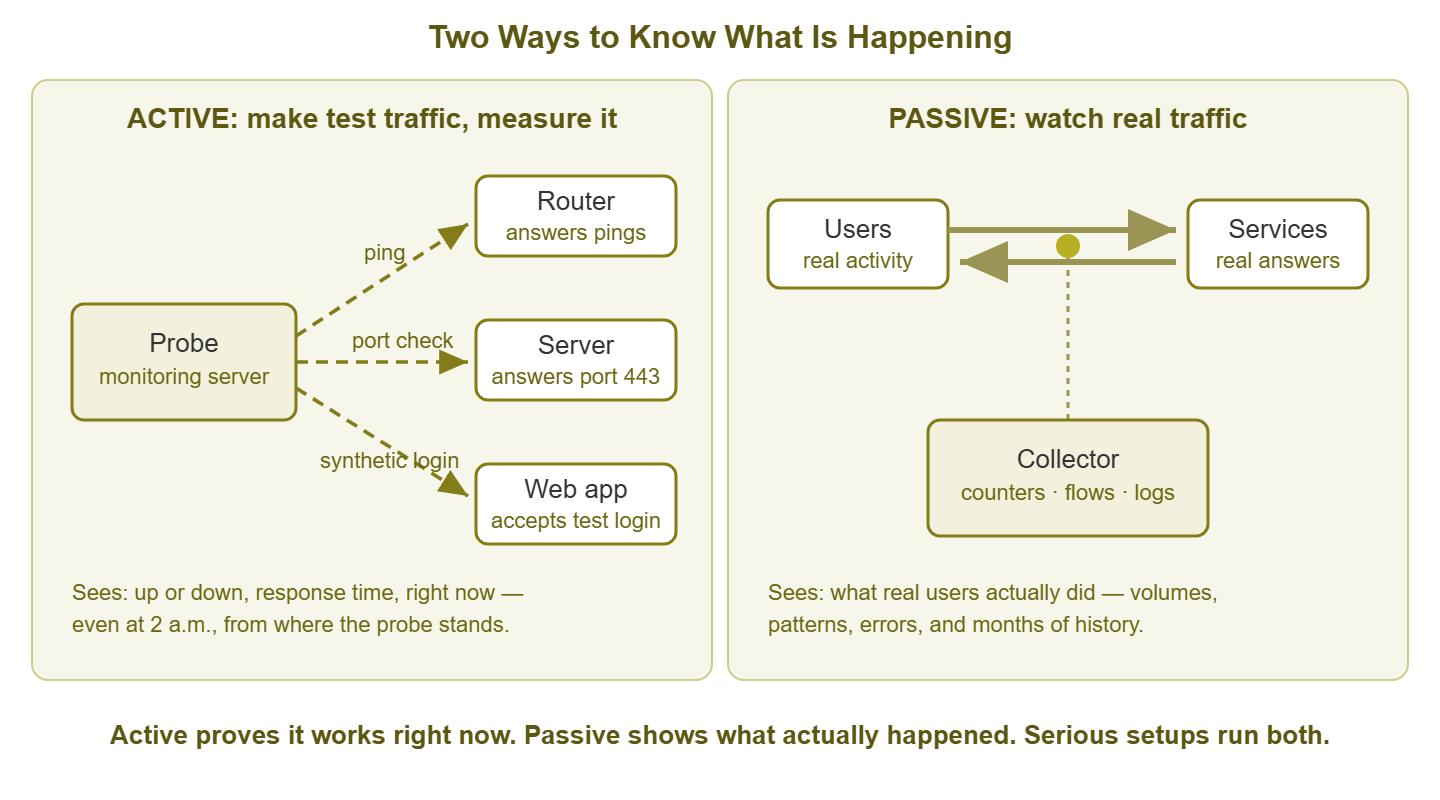
Figure 1: Active monitoring makes traffic and measures it; passive monitoring watches the traffic that is already there.
Both modes feed the same machinery of collector, database, dashboards, and alert engine. That pipeline is walked end to end in how network monitoring actually works. Nothing in it cares which mode produced the number. The difference is entirely in what the number can tell you.
Scenario 1: the 2 a.m. outage
It is 2:07 on a Friday morning when the mail server's storage controller locks the machine up solid. Nothing dramatic: no blue screen, no reboot, no farewell log message. The server simply stops answering — the failure mode hardware saves for the hours when nobody is around.
What active monitoring sees: the monitoring system has been pinging that server once a minute all night. That is the watchman rattling the door on schedule. At 2:08 the ping times out. At 2:09, again. At 2:10, a third time. Three misses in a row is the confirmation rule, so the alert fires and the on-call phone buzzes:
02:07:00  ping mail01 (10.0.4.25)   reply  0.6 ms
02:08:00  ping mail01 (10.0.4.25)   no reply (timeout)
02:09:00  ping mail01 (10.0.4.25)   no reply (timeout)
02:10:00  ping mail01 (10.0.4.25)   no reply (timeout)
02:10:01  ALERT: mail01 unreachable, 3 checks — notify on-call
The on-call admin power-cycles the box, spots the controller error, and has mailboxes back before three. When the office opens, mail simply works, and nobody ever knows there was a night shift.
What passive monitoring sees: the traffic counters on the server's switch port fall to zero, and its log stream goes quiet. Here is the problem: at 2 a.m., near-zero and quiet is what normal looks like. Passive monitoring detects activity, and overnight there is almost no activity to lose. A dead mail server at night produces nearly the same passive picture as a healthy mail server at night: not much. Without an active check, the first reliable detector of this outage is the help desk queue at 8:04 a.m. That is to say, your users. They are a remarkably accurate monitoring system with a terrible notification style.
The lesson: only active monitoring can prove a service works when nobody is using it. Its detection speed is set by arithmetic you control: test interval multiplied by confirmation count. It does not depend on when the next human happens to try the door.
Tip: that three-in-a-row rule is doing quiet, important work. A single lost ping is often just a busy moment somewhere along the path. Alerting on every blip would train you to ignore alerts. The full tradeoff between test interval, confirmation, and alarm noise has its own guide: synthetic test frequency.
Scenario 2: "the app is slow for some users"
The ticket every admin dreads, because it contains three unfalsifiable words: "the app is slow." Pressed for details: slow for some people, sometimes. A little patient digging finds the pattern — second floor, most afternoons.
What active monitoring sees: nothing wrong, and it is not lying. The monitoring server pings the application server: 2 ms, clean. The port check on 443 answers instantly. The synthetic login it runs every few minutes passes in under a second, all afternoon. Every one of those results is true — from where the probe stands. The monitoring machine sits in the server room, wired straight into the core switch, testing along a short, quiet road. The second floor rides a different road entirely. The probe has the best seat in the building, and it reports accordingly.
What passive monitoring sees: the culprit, in two steps. Step one is localization. The uplink is the single cable that carries the whole second floor's traffic. It runs from the floor's access switch (the one the desks plug into) up to the core. The per-port counters collected over SNMP show this uplink pinned at 98% utilization from roughly one to four every weekday afternoon. Nothing else is hot. That single number converts "the app is slow, sometimes, for some people" into "this cable is full, in the afternoons, for everyone behind it." Step two is attribution: flow records from the core name names. One workstation is pushing a cloud backup at full throttle, on a schedule its well-meaning owner set to "afternoon." Move the backup to run overnight, and the slowness dies the same day.
The lesson: active monitoring answers "does it work from here, right now?" Passive monitoring answers "what is actually happening on every segment?" A slow-for-some complaint is localization work, and localization is passive's home turf. Counters tell you which link. Flows tell you which machine. An extra probe placed on the second floor would at least have felt the slowness. Where you measure from changes the answer, which is the whole subject of probe placement. But even then, only the passive data could tell you who was eating the link.
Meridian Parts ran active checks and nothing else: forty of them. They ran from a monitoring server in the rack beside the core switch. Every one was green for an entire month. During that month, the goods-in office could barely open the stock system. The probe tested the stock system from the server room. The goods-in office reached it over one uplink that was full from one o'clock to four every afternoon. The tickets said "slow, sometimes", and the dashboard said fine. The dashboard won every argument for five weeks. The day someone switched on port counters for the access switches, that uplink appeared at the top of the list. It was in the color that means full. The review described the month as "a period of reduced visibility". The probe is still in the server room, because that was the only free port. But it has company now.
Scenario 3: the capacity review
Budget season. Your manager asks a fair question: "Will the internet line and the core switch cope with next year's growth, or do we need to spend?" Only one kind of answer survives a finance meeting, and it is not a guess.
What active monitoring offers: almost nothing, through no fault of its own. A ping tells you the link works right now, and how long a round trip takes right now. But capacity questions are questions about the past: how full were the links during the busiest hour of the busiest week? You cannot ping the past. Active tests are a flashlight — brilliant for the spot you point them at, useless for last quarter.
What passive monitoring offers: the whole answer. Months of interface utilization counters, faithfully collected every few minutes, add up to a flight recorder for your network. From that history you can read the daily busy-hour curve and the month-end spike when accounting runs everything at once. You can also see the slow upward creep of growth. You can quote the 95th percentile — the level traffic stays at or below 95% of the time. It is the standard honest way to describe "how full" a link is without being fooled by one-second spikes. And you can put a date on trouble: "at the current growth rate, that uplink crosses 80% in about three quarters." Turning utilization history into purchase timing is a craft of its own, covered in the bandwidth and utilization guides. But the raw material is passive history, full stop.
The lesson: passive monitoring is the only mode with a memory. It only has a memory if it was already running. You cannot retro-collect last spring. That is the argument for switching on counter collection the week your monitoring server is born. Do it long before anyone has asked a question that needs it. Someone will.
Scenario 4: holding your ISP to its SLA
Your internet line has been flaky for three weeks — brief stalls, mostly in the evenings. You call the ISP, the internet service provider that sells you the line. Support runs a test during business hours, from their side. Then comes the verdict every admin has heard: "We're not seeing any problems on our end." They are probably telling the truth. Their test ran at eleven in the morning, and the stalls happen at nine at night.
What you need is leverage, and leverage here has a specific shape: the SLA, or service level agreement. It is the clause in your contract where the provider promises measurable service. That might be an availability percentage, or latency and packet loss under stated bounds. The provider owes credits when it misses those promises. An SLA argument is won with measurements, and the measurements have to be yours.
What active monitoring sees: everything you need, because it tests on your schedule from your edge. The setup uses a ping every minute from just inside your router to the provider's gateway. On that same schedule, it also pings a steady target beyond that gateway. It runs for weeks, recording latency, loss, and timeouts, each stamped with a time. From that series your monitoring can produce the exhibit: outage start and end times, durations, and loss percentages during the bad evenings. The evidence comes from the same test, at the same interval, from the same place, across the whole period. The next support call goes differently, because you are no longer reporting a feeling. You are attaching a ledger. Disputes have a way of resolving once one side shows up with minute-by-minute numbers.
What passive monitoring sees: not enough, this time. Your own traffic is irregular. So a quiet chart at 9 p.m. proves nothing about whether the link could have carried traffic at 9 p.m. And utilization counters cannot measure latency at all, which is half of what the contract promises. Evidence requires the same question asked on a fixed schedule regardless of demand. That is more or less the definition of an active test.
The lesson: when you need proof rather than diagnosis, active monitoring is how you manufacture it. That applies whether the proof is for a provider, an auditor, or a skeptical boss. The surrounding math of availability, and what an evidence file should contain, live in the uptime and availability guides.
Scenario 5: the some-evenings problem
A user mentions, almost apologetically, that video calls "get choppy some evenings." Not every evening. Never mornings. Naturally, when you test at 10 a.m., everything is perfect — intermittent problems can smell an admin coming. This is the scenario where the two modes stop competing and start working shifts.
Passive finds the pattern. You cannot stand in the hallway every evening for a month, but your counter history has been doing exactly that. Scrolling back a few weeks through the WAN (wide area network) interface graphs shows the pattern. These graphs cover the router port that faces the outside line. On the bad evenings, utilization ramps hard after 6 p.m. The interface's drop counters climb in step. These count packets the router had to throw away because the line was full. Cross-checking the calendar explains the "some": the ramp lines up with the offsite backup. Its finish time depends on how much data changed that day. On heavy days it is still saturating the line at 7:30 when the late crew makes calls. On light days it finishes by six and nobody suffers. The most confusing symptom in the ticket — some evenings — was the backup's variable appetite all along.
Active confirms it, then proves the fix. A pattern is a suspicion, not a verdict. So you schedule a targeted test: a fine-grained ping series across the 5-to-9 window toward the far end of the link. It measures loss and delay. On the next heavy-backup evening it draws the picture — loss climbing from 6:40 to 7:50, exactly while the backup runs. You throttle the backup's bandwidth and cap its window. The evening test goes flat and stays flat. Now you have before-and-after numbers proving the fix worked, instead of a hopeful "seems better lately?"
The lesson: passive monitoring finds patterns no human would stand around long enough to see. Active monitoring turns the suspicion into a measurement, and the measurement into proof. Most stubborn real-world problems fall to exactly this pairing, in this order.
The honest comparison table
Here are the two modes side by side, including the row most comparisons politely leave out: where each one lies to you.
| Active monitoring | Passive monitoring | |
|---|---|---|
| What it is | Test traffic you generate on a schedule: pings, port checks, synthetic transactions | Observation of real activity: SNMP counters, flow records, logs, mirrored traffic |
| What it proves | The service works, or doesn't, right now — from that vantage point, even at 2 a.m. | What real users and systems actually did: volumes, patterns, errors, and history |
| What it costs | Extra traffic and login load; scripts and test accounts to maintain; every check is a choice you must think to make | Collection and storage that grow with the network; sensors must be placed; the data needs analysis time |
| Where it lies | Between samples, on paths you never tested, and whenever test traffic gets treated better than user traffic | It never lies about what happened — but it says nothing about what didn't happen, and it speaks only after users already felt the problem |
Both cells of that last row deserve a full accounting, and they have one. The guide to the blind spots of each mode catalogs the failure modes one by one, with the compensating control for each.
Why the argument is fake
Run the five scenarios back. Active monitoring caught the nighttime outage and built the SLA case: detection and proof. Passive monitoring localized the slow afternoons, answered the budget question, and surfaced the evening pattern: explanation and history. The last scenario needed both, in sequence. Not one of the five was cleanly solvable by a single mode. That is the punchline hiding inside the whole active-versus-passive debate. It is an argument between the watchman and the camera. A building protected by only one of them is not protected.
So the serious design question was never which. It is which jobs. Give active monitoring the jobs with a deadline: the services whose failure must wake someone, the promises that need proof. Give passive monitoring the jobs with a memory: every segment where history, diagnosis, or attribution might one day be needed. That is most of them. Overlap the two deliberately where the stakes are highest. If a vendor or a blog post insists that one mode is all you need, you are being offered half a monitoring system. The five scenarios above show what the missing half costs.
The rest of this pillar builds the two-mode design piece by piece. The guide to designing synthetic probes that mimic real users teaches the active craft in depth. And a blended monitoring design on a small budget assembles everything into a concrete reference setup you can copy.
Where to go next
You now own the distinction that organizes everything else in this topic. Active monitoring generates test traffic to answer "does it work, right now, from here?" Passive monitoring observes real traffic to answer "what is actually happening, and what happened before?" One is a watchman, and one is a camera. Every question in the five scenarios sorted cleanly onto one desk or the other, or onto both in order. When a monitoring question lands on yours, sort it the same way. And the next time two admins start the argument in front of you, ask them what the job is. The argument tends to end there. Browse the rest of Active vs. Passive Monitoring to go deeper on whichever thread you met here.
Put this into practice with SysPeep Monitor
A blended setup sounds like a project. But most of it is what SysPeep Monitor does the day you install it. It discovers the devices on your network and polls status and performance counters over SNMP, WMI, and SSH. It keeps the history on dashboards and reports, and alerts you when a reading goes wrong. Its thresholds and dependency rules are designed to stay quiet until it matters. The free trial installs on any Windows machine in minutes.
Download Free TrialLearn About SysPeep - All Rights Reserved.