
How Network Monitoring Actually Works, End to End
The first time you open a monitoring dashboard, it feels a little like magic. Somewhere in a closet a switch is passing packets — the small parcels that every piece of network traffic is chopped into. Here on your screen is a smooth line that somehow knows about it. An alert email at 3 AM produces the same feeling in reverse. Where did that come from? Who decided my sleep was worth interrupting?
None of it is magic, and I promise the machinery underneath is simpler than the dashboard makes it look. Every monitoring product I have ever used — free script or expensive suite — implements roughly the same short pipeline. A number is born on a device, gets collected, stored, drawn, judged, and, once in a while, turned into a message that finds a human. That is the entire mechanism. The products differ in how they decorate it.
This guide follows one reading through that pipeline, stage by stage. Along the way you will meet the five different ways readings can arrive. And you will pick up the practical payoff. When the monitoring itself misbehaves — a gap in a graph, an alert that never fired — you will know exactly which stage to blame. Understand one number's journey and you understand every monitoring tool you will ever touch.
In this guide
- The pipeline at a glance
- Stage 1: The device already knows
- Stage 2: The collector asks (or is told)
- The five ways readings arrive
- Stage 3: The time-series store
- Stage 4: Dashboards draw on demand
- Stage 5: The alert engine judges
- Stage 6: A notification finds a human
- Walkthrough: one counter, start to finish
- When the monitor itself misbehaves
- Where to go next
The pipeline at a glance
Six stages, one direction of travel. A device keeps facts about itself. A collector fetches those facts on a schedule. A time-series store remembers them. From there the path forks — the only fork in the whole pipeline. One branch serves curiosity: dashboards, which draw pictures when you go looking. The other branch serves judgment: an alert engine, which compares every reading against rules. When a rule trips, it hands off to notification — the part that interrupts a person. Everything upstream of the fork is shared plumbing; the two branches just use it differently.
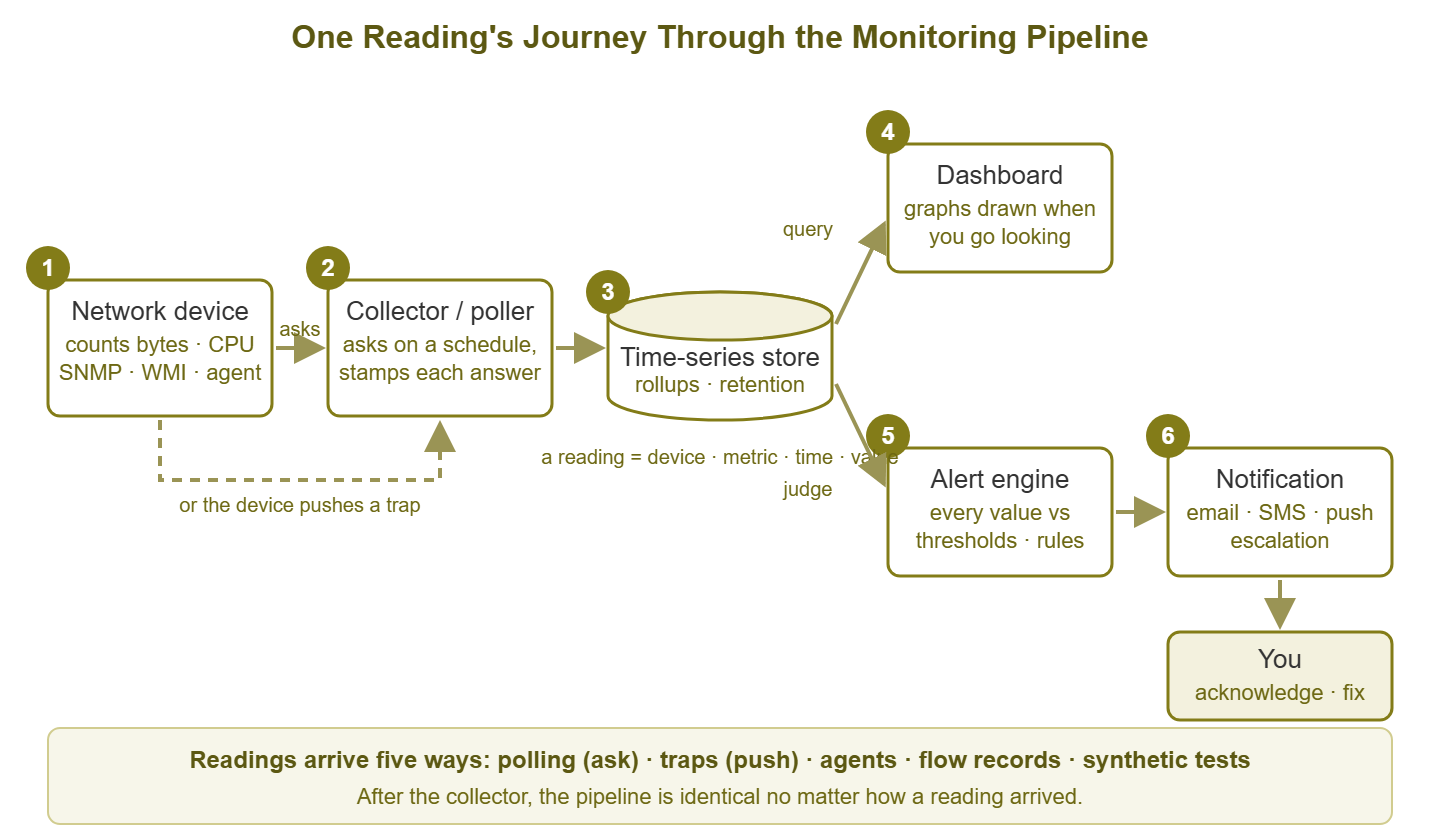
Figure 1: The whole machine. One reading travels left to right; the only branch is after the store — dashboards for curiosity, the alert engine for judgment.
Stage 1: The device already knows
Here is the fact that makes everything else possible: your devices count things constantly, whether or not anyone is watching. A switch increments a packet counter and a byte counter for every port, in hardware, millions of times a second. It has done so since the moment it booted. A Windows server tracks its own CPU, memory, disk space, and the state of every service. A UPS (uninterruptible power supply, the battery box the servers plug into) knows its battery charge to the percent. The facts exist before any question is asked. Monitoring does not install sensors into your network; the sensors are already there. Monitoring is the discipline of finally reading them.
There are three common doors into a device. SNMP (Simple Network Management Protocol) is the standard question-and-answer language of network gear — switches, firewalls, printers, UPS units. In SNMP, every fact sits at a numbered address called an OID (object identifier), waiting to be requested. (The addresses look like 1.3.6.1.2.1.2.2.1.10.25, and nobody has ever memorised one on purpose.) WMI (Windows Management Instrumentation) is the equivalent built into Windows, the way to ask a server about its disks and services without installing anything. And an agent is a small program you install on a machine so it can report from the inside. That is useful where the built-in doors do not reach, or where you want more detail than they offer.
One distinction learned here saves much confusion later. Some values are gauges: right-now numbers that move in both directions, like CPU percentage or temperature — meaningful the instant you read them. Others are counters: running totals since boot, like "bytes received on port 25," which only ever climb. A counter read once tells you almost nothing; a counter read twice tells you a rate. Hold that thought — it becomes important at the drawing stage.
Stage 2: The collector asks (or is told)
The collector — also called the poller — is the heart of the monitoring system. It is the component that holds the device list, the credentials (the passwords and keys that let it ask each device questions), and the schedule. Its life is a loop. For every check on every device, it sends a small question once per polling interval. That is commonly every 60 seconds. For less critical things, it is every 5 or 15 minutes. The question is: "what is the value of counter X?" The interval is a simple tradeoff. Shorter means fresher data and faster outage detection, at the cost of more load on the network and the devices. For most checks on a small network, one minute is plenty.
What the poller does with each answer is beautifully boring. It stamps it, producing a little record: device, metric, timestamp, value. That four-part record is a reading — the atom of monitoring. Everything downstream, every graph and every 3 AM page, is built out of these atoms and nothing else.
Polling is a pull: the monitor asks. But readings can also be pushed — a device can speak up on its own — and that is the first of several variations worth meeting properly.
The five ways readings arrive
Tools use different names, but there are really five collection styles. You do not need all five. Most small networks run on the first one plus a sprinkle of the others. But knowing the menu keeps vendor datasheets from sounding like incantations:
| Style | Push or pull? | Use it when |
|---|---|---|
| Polling | Pull — the monitor asks on a schedule | The workhorse: regular health and performance numbers from everything. Predictable, complete, easy to graph. |
| Traps / events | Push — the device shouts when something happens | You want instant news of events ("link down!") between polls. Pair with polling: a dead device sends no trap, so silence proves nothing. |
| Agents | Push or pull, from software installed on the host | You need inside detail (services, logs, per-process data) or must reach machines the standard protocols cannot. |
| Flow records | Push — routers summarize traffic conversations | The question is "who is eating the bandwidth?", not "how much is used?" — flows describe conversations, not device health. |
| Synthetic tests | Pull — the monitor pretends to be a user | You care about experience: resolve a name, fetch a page, log in. Catches the day everything is green but nothing works. |
The unifying trick: whatever the style, the output is the same shape — device, metric, timestamp, value. A trap becomes a reading. A synthetic login becomes a reading ("login time: 1.4 seconds"). The pipeline downstream neither knows nor cares how a reading arrived, which is why the rest of this article applies to all five.
Stage 3: The time-series store
Each reading lands in a database, and the shape of the data gives the database its name. A time series is the full history of one metric: a two-column list of when and what. One series for port 25's byte counter, one for the file server's disk usage, one for each thing measured — a diary per metric, appended forever.
This workload is peculiar: millions of tiny timestamped appends, queried almost exclusively by time range ("show me this series for the last week"). So monitoring systems store it in structures built for exactly that. These might be a specialized time-series engine or carefully shaped tables inside an ordinary database server. You rarely touch this layer directly, and I recommend keeping it that way, but two of its policies quietly shape everything you see.
The first is rollup. Keeping every one-minute reading forever would be enormous and mostly pointless. So the store periodically condenses aging data. Raw per-minute readings are kept for days or weeks. They are then averaged into five-minute or hourly summaries kept for months or years, while the raw points are discarded. Think of a diary rewritten as a weekly summary, then as a yearbook entry. The second is retention — the schedule saying how long each level of detail survives before deletion.
Together they explain a thing that puzzles every new admin: why last year's graphs look so smooth. That dramatic five-minute spike did not shrink — it was averaged into an hourly summary, where five loud minutes drown among fifty-five quiet ones. The practical lesson: investigate anomalies while the data is young, while the raw detail still exists. A mystery left for next quarter literally loses its evidence.
Stage 4: Dashboards draw on demand
A dashboard looks alive, but it is the laziest stage in the pipeline — and that is a compliment. A graph is just a question posed to the store when you look: "give me this series for the last 24 hours." The result is scaled to fit, drawn as a line. Nothing new is created here. If the collector stopped an hour ago, the dashboard does not know or care; it faithfully draws the nothing it was given.
This is also where counters get their arithmetic. The store holds raw, ever-climbing totals; the graph you want is a rate. So somewhere between store and screen, the system takes consecutive readings, subtracts, and divides by the time between them. Two byte-counter readings a minute apart become "megabits per second." Every bandwidth graph in existence is this one subtraction, repeated.
Learn to read a graph's silences as fluently as its shapes. A gap in the line means collection failed — no readings arrived. So there is nothing to draw; the problem is upstream, at stage 1 or 2. A flat line means collection worked fine and the value simply is not changing. And a line flat at exactly zero means the question was answered with "zero" — a port with no traffic, perhaps. Confusing these three sends admins chasing phantom outages, and distinguishing them takes one glance once you know they differ.
Stage 5: The alert engine judges
Dashboards have one flaw: they require someone to look, and nobody is looking at 3 AM. The alert engine is the branch that never blinks. As each reading arrives (or on a fast cycle), it compares the value against your rules. It maintains, for every check, a state: OK, warning, or critical. There is also "unknown" when the device stopped answering, which is its own kind of news.
The simplest rule is a threshold: a line between fine and not, like "warning above 85% disk" or "critical when unreachable." (Sensible starting values for the common checks are collected in the first 10 checks guide.) Good engines add two refinements that separate quiet monitoring from noisy monitoring. Persistence: require the condition to survive several polls before the state changes, so a single lost packet does not page anyone. Without persistence, a borderline check flaps, bouncing between states and generating a message per bounce. And dependencies: the engine knows your topology (which device sits behind which). So when the core switch dies it raises one alert about the switch and suppresses the forty devices behind it. That avoids burying the real story in its own consequences. Forty alerts about one dead switch is not thoroughness. It is the same fact in forty envelopes.
When a rule trips and survives its persistence window, the engine records an alert: a state change, logged. Note the word carefully — an alert is the system's internal judgment that something is wrong. It is not yet an email. That distinction belongs to the final stage.
Stage 6: A notification finds a human
A notification is what an alert becomes when routing rules decide a person should know. It can be an email, a push message or SMS, a chat post, or a ticket filed automatically. One alert may fan out into several notifications, or into none at all. Plenty of useful alerts are configured to just change a color on the dashboard. Routing is where your policies live. Critical alerts interrupt phones at any hour. Warnings send email during business hours. Everything respects maintenance windows (agreed periods when you are deliberately taking things down) so that patch night does not wake anyone for nothing.
Two mechanisms close the loop. Acknowledgment is you telling the system "seen it, working on it" — which stops repeat notifications and shows colleagues the problem is owned. Escalation is what happens when nobody acknowledges: after a set time the notification climbs the ladder to the next person, or the next louder channel. And then the truly final stage of the pipeline runs: a human acts. It is worth saying once, plainly — monitoring that nobody responds to is expensive decoration. The pipeline exists to move one fact from a switch's hardware register into a decision made by a person.
Walkthrough: one counter, start to finish
Time to run one reading through every stage. The cast: your core switch's uplink, port 25, a gigabit link. The metric: its received-bytes counter, which SNMP files under the name ifHCInOctets. The schedule: polled every 60 seconds. The rule: "warning if the uplink sustains more than 800 Mbps for 5 minutes." Here is the poller's ledger for two interesting moments of the day:
time       counter value        difference       rate
-- a quiet morning --
09:00:00   918,273,645,123      -                -
09:01:00   918,281,145,123      7,500,000        1 Mbps

-- during the evening backup --
20:03:00   1,204,118,000,000    7,095,000,000    946 Mbps
20:04:00   1,211,213,000,000    7,095,000,000    946 Mbps
- 1. The fact exists. Since boot, the switch has counted every byte into port 25 — by 9 AM, some 918 billion of them. Nobody has asked yet today. The counter does not mind.
- 2. The poller asks. At 09:00:00 the collector's schedule fires: one small SNMP request to the switch — "current value of ifHCInOctets on port 25?" The switch answers in milliseconds.
- 3. The reading is stored. The answer becomes an atom — sw-core-01, port25.in-octets, 09:00:00, 918273645123 — appended to that metric's time series. Sixty seconds later, the next one.
- 4. The math happens. Two readings, one minute apart, differ by 7,500,000 bytes. Times 8 for bits, divided by 60 seconds: the uplink is moving about 1 Mbps. A sleepy morning.
- 5. The dashboard draws — if anyone looks. Should you open the uplink graph, that 1 Mbps point gets fetched and plotted. If nobody looks, it simply waits in the store.
- 6. The alert engine judges. Every reading is compared against the rule: 1 Mbps versus the 800 Mbps line. Verdict: OK. Nothing happens — and notice that this is the overwhelmingly common outcome. A healthy monitoring system is a machine for concluding "nothing is wrong" thousands of times an hour.
- 7. The rule trips. At 20:00 the offsite backup replication kicks off, and the ledger changes character. Minute after minute the counter leaps by about seven billion bytes — 946 Mbps, a saturated link. One hot minute changes nothing (persistence). But at 20:05, after five consecutive readings over the line, the engine flips the check's state to warning and records an alert.
- 8. A human decides. Routing says warnings email the admin. Your phone buzzes at 20:05. You recognize the cause and acknowledge the alert to silence repeats. Then you make tomorrow's real decision: move the backup window, or teach the rule that evening saturation is expected. Both are legitimate — the pipeline's whole job was to make sure that choice got made on purpose, by you, instead of by nobody.
Tip: that final step — a human adjusting the rule — is not an afterthought; it is the pipeline's only feedback loop. Tools ship with default thresholds, but every quiet, trusted monitoring system got that way through weeks of small human corrections. Budget for them.
When the monitor itself misbehaves
The payoff for learning the pipeline is that monitoring problems stop being mysterious. Like plumbing, the system fails at joints — and each symptom points at exactly one of them:
| Symptom | Suspect stage | First things to check |
|---|---|---|
| Gaps in every graph for one device | Collection (stages 1–2) | Device reachable? Credentials still valid? SNMP/WMI still enabled after that firmware update? |
| Gaps in every graph for every device | The collector itself | The monitoring host — service stopped, disk full, VM paused. The watcher needs watching too. |
| Graph shows the problem, but no alert fired | Judgment (stage 5) | Is there a rule on that metric? Threshold sane? Persistence window longer than the incident? A dependency wrongly suppressing it? |
| Alert recorded, but no message arrived | Notification (stage 6) | Routing rules, mail configuration, a maintenance window someone forgot to end, messages in spam. |
| A graph shows impossible spikes or negative rates | The counter math | The device rebooted (counters reset to zero) or a 32-bit counter wrapped — the subtraction went briefly nonsensical. |
Half of "the monitoring is broken" tickets are solved by the first row, and nearly all of the rest by the third and fourth. Knowing which stage to interrogate turns an afternoon of confusion into ten minutes of checking.
There is one failure the table cannot catch, because nothing in the pipeline fails: the pipeline answers the wrong question perfectly. Meridian Parts monitored its customer order site with a single check, a ping to the web server every minute. One Tuesday the web service on that server stopped. And the server, otherwise in excellent health, kept answering pings all day with the cheerfulness of a machine that has nothing else to do. The dashboard stayed green for twenty-six hours. Customers phoned the sales desk. The sales desk phoned IT. IT pointed at the green tile, and the conversation went round like that until somebody tried the website. The check they added the next morning fetches the order page and looks for the word "Checkout". It took four minutes to set up and has been the most useful check on the network ever since.
Where to go next
You now hold the mental model that makes every monitoring tool legible. Facts are born on devices, and a collector gathers them into readings. A store remembers them, and dashboards draw them on request. An alert engine judges them, and notifications carry the verdicts to people. Different products decorate the pipeline differently, but the pipeline is always there. Once you can see it the smooth line on the screen stops being magic and starts being a subtraction. The natural next questions are practical — what to point it at first, and how to roll it out without drowning. The other guides in Network Monitoring Fundamentals take those up in order.
Put this into practice with SysPeep Monitor
Everything in this article is a thing SysPeep Monitor runs for you out of the box. It discovers your devices and polls them over SNMP, WMI and SSH. It keeps the history in SQLite, MySQL/MariaDB or SQL Server and draws the dashboards. It weighs every reading against thresholds and dependencies, and delivers the notifications. You bring the judgment. The free trial installs on any Windows machine in minutes.
Download Free TrialLearn About SysPeep - All Rights Reserved.