
Built-In Dashboards vs. Flexible Dashboard Tools
The thought arrives about three months after the monitoring tool goes live: "these dashboards are fine, but..." The built-in screens show the devices and the graphs. The layout is rigid, though, and the helpdesk ticket count is not on it. The operations manager wants the warehouse scanner uptime next to the internet link. So someone suggests a flexible dashboard tool, the kind that can draw anything from anywhere. Someone else says: we already have dashboards.
Both of them are right, which is why this is harder than it looks. A built-in dashboard is right by default and limited by design. A flexible dashboard tool can show anything, and in exchange it becomes a second system you have to run. I have run both, and I have run the second one badly. There is no "correct" choice; the correct choice depends on which questions you need answered and who is asking.
This guide gives you the honest comparison. You will learn what each kind of dashboard actually is and how they compare across the seven dimensions that matter in practice. You will learn the one mistake nearly every team makes when it adopts a flexible tool. You will also learn the situations where flexibility genuinely earns its keep. And you will get a short decision flow you can walk through with your own network in mind.
In this guide
- What "built-in" means
- What a flexible dashboard tool is
- The honest comparison
- The common mistake: rebuilding what you already had
- When flexibility earns its keep
- A decision flow
- Both: how the two coexist without fighting
- Where to go next
What "built-in" means
Every monitoring tool ships with dashboards. They are called built-in because they are part of the tool itself, drawn from the tool's own database. They use the tool's own idea of what the world looks like. That idea is the data model. The tool knows that a "device" has "interfaces," and that an interface has "utilization" measured in bits per second. It knows that a server has "disks" measured in percent used. It also knows that each of those things can be up, down, or warning. Because it knows all that, it can build the device page for you the moment discovery finds the device. You add a switch; you get a screen. Nobody configures anything.
That is the built-in dashboard's superpower and it is easy to underrate. The graph already has the right units. The threshold line is already drawn, because the tool knows what threshold you set. The up/down tile and the alert that fires when it goes red come from the same place at the same moment, so they never disagree. When the tool is upgraded, the dashboards are upgraded with it. When you rename a device, every panel follows. You never log into a second system, and there is no second set of users to manage.
The limits are just as real. The layouts are what the tool offers: a fixed grid, a fixed set of widget types, perhaps drag-and-drop, perhaps not. The styling is the tool's styling. And there is exactly one data source, the tool's own database. Suppose you want the number of open helpdesk tickets next to the WAN graph. The built-in dashboard cannot show it unless the monitoring tool collects it, and most do not. The built-in dashboard is a window onto one system. It is a very good window. It is still only one.
What a flexible dashboard tool is
A flexible dashboard tool is a separate application whose only job is drawing panels. It collects nothing. Instead, every panel is a query — a small question written in a query language — sent to a data source. That source can be a database, a metrics store, a log system, the monitoring tool's own interface, even a spreadsheet. The tool runs the query, gets numbers back, and draws them however you told it to. It does not care where the numbers came from. So it can put a WAN utilization graph, a log error rate, a ticket count, and this morning's order volume on one screen. Each can come from a different place. A flexible, general-purpose dashboard tool is what most people picture when they say "we should build a proper dashboard."
The flexibility is real, and so is the bill. A flexible dashboard tool is a second system. It needs a server or a container to live on. It needs upgrades, and upgrades need testing. It needs backups, because its dashboards are configuration you will not want to rebuild. It needs its own users and permissions. And it needs working credentials to every data source it reads from, kept valid forever. That means every password rotation on a source is a potential blank panel. Each panel is also a small program in a query language you have to learn. When the monitoring tool renames a metric after an upgrade, the built-in dashboard adjusts itself while the flexible tool's panel simply goes empty. The rot problem is serious enough that it gets its own guide, the maintenance burden nobody budgets for.
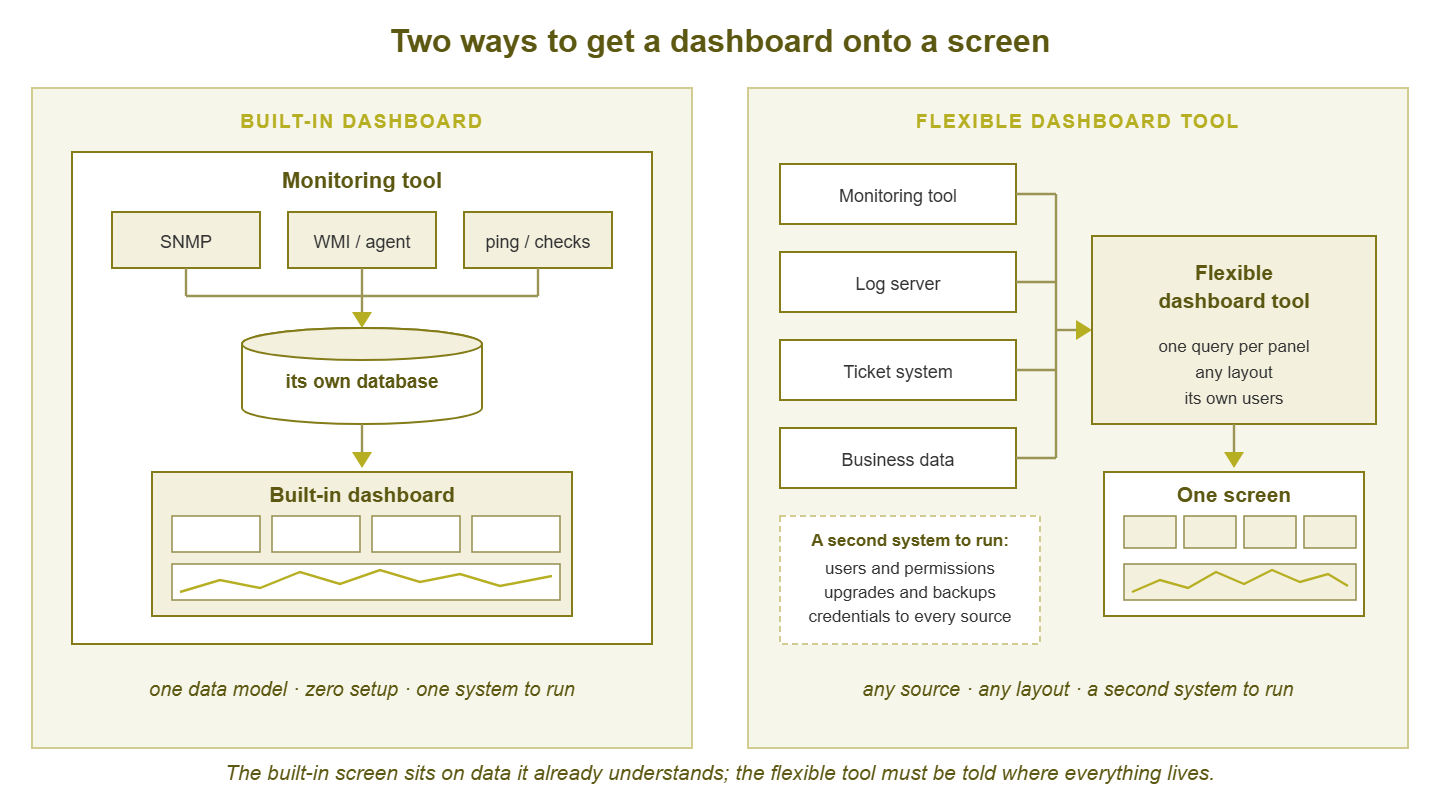
Figure 1: The built-in dashboard sits on data the tool already understands. The flexible tool can draw from anywhere, but it has to be told where everything lives, and it has to be run.
The honest comparison
Seven dimensions decide this in practice. Cost of ownership is measured in effort, because effort is what a small team actually runs out of.
| Dimension | Built-in dashboard | Flexible dashboard tool |
|---|---|---|
| Time to first dashboard | Minutes; often zero, because discovery builds it | Hours to days: install, connect sources, learn the query language, build panels |
| Data sources | One: the monitoring tool's own data | Many: monitoring, logs, tickets, databases, business systems |
| Customization | Within the tool's grid and widget set | Nearly unlimited: any layout, any panel type, any styling |
| Maintenance | Upgrades with the tool; panels follow renames automatically | Separate upgrades, plus every query must be kept true by hand |
| Access control | The monitoring tool's users and roles | Its own user model; often finer-grained, always separate |
| Cost of ownership (effort) | Bundled with running the monitoring tool | A second system's worth: server, backups, users, credentials, queries |
| Who can edit | Admins of the monitoring tool | Anyone granted access, including people outside IT |
Time to first dashboard
This dimension is more lopsided than the table can show. A built-in dashboard exists before you think to want it. A flexible tool's first dashboard requires you to install the tool and connect it to the monitoring system. Connecting usually means enabling an interface on the monitoring side and creating a service account. Then you must learn enough of the query language to fetch one metric. And then you discover that the metric names are not what you expected. None of this is hard. All of it is time, and it is time spent before the first panel appears.
Data sources and customization
These are the two dimensions where the flexible tool wins outright, and they are the only reasons to adopt one. If your question can be answered from the monitoring tool's data alone, in a layout the tool can produce, the flexible tool offers nothing but prettier fonts. If your question needs two systems on one screen, the built-in dashboard cannot answer it at all. The honest comparison is not "which is better" but "does my question cross a system boundary?"
Maintenance and cost of ownership
The built-in dashboard's maintenance cost is nearly invisible because it is folded into running the monitoring tool, which you were doing anyway. The flexible tool's cost is visible and recurring. There is a system to patch, a database to back up, a certificate to renew, and a set of source credentials to keep alive. And there is a query behind every panel that silently breaks whenever anything upstream changes shape. On a small team, "a second system" is not an abstraction. It is a specific person's Tuesday afternoon, every month, forever.
Access control and who can edit
Here the flexible tool has a quieter advantage. Giving the operations manager a login to your monitoring tool means giving them a login to the thing that can change thresholds and silence alerts. Most monitoring tools have read-only roles, but the roles are designed for IT people. And the interface is full of things a non-admin should not touch. A flexible dashboard tool can give that manager a login that shows their screen and nothing else. It can even let them rearrange it without affecting anyone. That matters most when the audience is outside IT.
The common mistake: rebuilding what you already had
Almost every team that adopts a flexible dashboard tool does this. The tool is installed. Someone connects it to the monitoring system. The first dashboard they build is the device overview: CPU, memory, interface traffic, up/down state. It looks wonderful. It is also an exact copy of the built-in device page, with the same data, from the same database, arranged slightly differently. Now there are two of it.
Nothing was gained. The new screen answers no question the old one could not. But something was lost: the copy has to be maintained by hand. It will drift the next time the monitoring tool is upgraded. From now on two screens show the same metric and will eventually disagree. At that point nobody knows which is true. That last problem is the seed of dashboard sprawl, and a rebuilt built-in is the most common way it gets planted.
The rebuild happens for understandable reasons. The flexible tool is new and the empty grid is inviting. The first thing anyone reaches for is the data they know best, which is the monitoring data. And the flexible tool's demo, which was probably what convinced the team to adopt it, showed beautiful screens built on someone else's data. So the natural first step is to recreate that beauty with your own. Resist it. Apply one test to every dashboard you build in the flexible tool: does this screen show something the built-in dashboard cannot? If the answer is no, do not build it. Link to the built-in page instead and spend the afternoon on something that needs you.
Tip: the moment you adopt a flexible dashboard tool, write down which dashboards live where, and keep the list somewhere the whole team sees it. "Device pages and the morning view: built-in. Service view and the manager's screen: flexible." A rule this simple prevents most duplication, because the question "where does this go?" now has an answer before anyone opens an editor.
When flexibility earns its keep
There are four situations where a flexible dashboard tool pays for its own upkeep. And they all have the same shape: a question that crosses a system boundary.
Multiple data sources on one screen
The classic example is a service view: one business service, say the phone system, shown as a dependency chain. The chain runs from the internet link through the firewall and the core switch to the call server. The view shows the monitoring tool's up/down state for each hop and the log server's error rate for the call software and the helpdesk's count of open phone tickets. Any one of those sources can show its own slice. Only a flexible tool can put the three slices side by side. That way, a spike in tickets lines up visually with a spike in errors and a red hop in the chain. The reasoning behind dependency chains is covered in dependency thinking; the flexible tool is just the easiest place to draw one across systems.
Non-monitoring data alongside
Some of the most persuasive dashboards ever shown to a manager put the network's health next to the business's pulse. They show calls per hour, orders per hour, scans per hour, next to WAN packet loss for the same period. When the dip in orders lines up with the spike in loss, the argument for a better circuit makes itself. The monitoring tool will never collect order counts. A flexible tool reading from the order database will. Once it does, the network stops being an abstract IT concern and becomes a visible input to the business.
Audiences outside IT
The warehouse manager, the front-desk lead, the school's office administrator: each needs one screen showing the handful of things they care about, with a login that cannot break anything. The flexible tool's separate user model was built for this. The built-in dashboard can often do it too. But the experience of handing a non-technical person a monitoring tool's read-only login is usually a ten-minute walkthrough followed by them never opening it again.
More than one monitoring tool
Consider a migration between monitoring platforms, or an organization that has accumulated several tools over the years. A flexible dashboard can be the one screen that shows both worlds while the mess is sorted out. This is a real use, with a caution: a single pane over several tools is a bandage. And the underlying problem is described in Monitoring Tool Sprawl. Use the flexible tool to keep everyone sane during the cleanup, not as a reason to skip the cleanup.
A decision flow
Walk through this once per dashboard you are thinking of building, not once per organization. The answer legitimately differs from screen to screen.
- 1. Write down the question and the audience. One sentence each. If you cannot, stop; you are not ready to build anything anywhere. The guide to what a dashboard is for walks through this.
- 2. Can the built-in dashboard answer the question? Actually check. Open the tool, find the page, squint at it. If yes, use it, and you are done. Most questions about devices and services stop here.
- 3. Is the gap purely layout? "The tiles are too small for the wall" or "I want the WAN graph on top" is a layout gap. Try harder with the built-in first: most tools allow more rearrangement than people assume. Layout alone very rarely justifies running a second system.
- 4. Is the gap a second data source? If it is one extra number from one place, ask whether the monitoring tool can ingest it. Many tools accept the result of a script as a check, which turns "ticket count" into a monitored metric with no second system. If it is several sources, or a source that changes shape often, the flexible tool has earned its place.
- 5. Is the audience outside IT? If yes, and the built-in read-only experience is not good enough for them, the flexible tool's separate login is a legitimate reason on its own.
- 6. Who will maintain it in a year? Name a person. Not a team, a person. If nobody's name fits, do not build it, because an unmaintained flexible dashboard is worse than no dashboard: it looks authoritative while being wrong.
- 7. If you adopt the flexible tool, decide which dashboards live where, and write it down. Then never build the same screen in both.
Notice how many paths end at step two. (It is also the step most often skipped, because checking is less fun than installing.) That is not a bias toward built-in dashboards; it is what most questions look like. "Is the core switch healthy?" and "what is trending wrong on the file server?" are single-source questions, and single-source questions are what built-in dashboards are for.
Both: how the two coexist without fighting
The title of this pillar includes "or both" because both is where most teams that adopt a flexible tool end up. Using both works well when the division of labor is deliberate.
The built-in dashboards keep the admin-facing views. These are the per-device pages, the morning view of what is trending, and the troubleshooting screens you open during an incident. These are single-source and right by default. They follow renames and upgrades. And they are opened by people who already have a monitoring login. Rebuilding any of them elsewhere is the mistake from earlier in this guide.
The flexible tool takes the cross-source views. That means the service view that combines monitoring state with logs and tickets, and the manager's screen with business numbers alongside network health. The flexible tool also takes the wall screen if, and only if, the wall screen needs something the monitoring tool does not have. If the wall screen only needs up/down tiles for the critical services, it stays built-in. A wall screen is the last place you want a blank panel caused by an expired credential.
Two rules keep the arrangement honest. First, every dashboard lives in exactly one place. Not "the real one is built-in and there is also a nicer copy." One place. Second, the flexible tool reads from the monitoring tool; it never replaces the monitoring tool's own state. Alerts still come from the monitoring system, thresholds still live there, and the flexible dashboard shows that state rather than recomputing it. The moment a flexible panel decides for itself that a service is "down" based on its own query, you have two opinions about the truth. The guide to dashboard sprawl describes what happens next.
At Meridian Parts the flexible tool was adopted for one screen, order volume next to WAN packet loss, and did it well. Nobody wrote down where dashboards lived, so within a year it also held forty screens the built-in tool already had. Its owner spent most of every Friday repairing panels blanked by a password rotation, a metric rename, or an upgrade on one of six sources. The order-volume screen, the one that had justified the whole thing, was among the panels that broke. Nobody mentioned it for two weeks.
Worked through this way, "both" is not a compromise. It is two tools each doing the job they are good at, with a written boundary between them. And a small team can run that arrangement for years without it getting away from them.
Where to go next
Built-in dashboards are right by default, single-source, and nearly free to run. Flexible dashboard tools can draw from anywhere and cost a second system's worth of upkeep. Decide one screen at a time, by asking whether the question crosses a system boundary, and never rebuild a built-in screen in the flexible tool. The next time someone says "these dashboards are fine, but...", ask what comes after the "but"; that is the whole decision. If you are still choosing the monitoring tool itself, the built-in dashboards it ships with are a fair thing to weigh. The guide on Choosing a Monitoring Tool covers how to evaluate those dashboards without being dazzled by a demo. Once the screens exist, the next problem is keeping them true, and the rest of Dashboards: Build, Buy, or Both is about exactly that.
Put this into practice with SysPeep Monitor
SysPeep Monitor is a monitoring tool with its dashboards, network maps, and reports built into one web console. They are drawn from the devices it discovers and polls over SNMP, WMI, and SSH. If you are weighing whether built-in screens would cover your network, the free trial installs on a Windows machine. That lets you look at them with your own data before deciding what, if anything, to build on top.
Download Free TrialLearn About SysPeep - All Rights Reserved.