
What Data Exfiltration Looks Like in Network Data
Somebody in management has asked you a question that sounds simple: "Would we know if our data was being stolen?" You run the network. You have a firewall, maybe some flow data, and a monitoring system full of graphs. You would like the answer to be yes. But if you are honest, you are not sure what theft would even look like on those graphs. Would it stand out like a fire alarm or hide inside the ordinary hum of a business day?
Here is the good news: data leaving a network leaves footprints, and those footprints show up in data you probably already collect. Data exfiltration is simply the unauthorized movement of data from inside your network to somewhere outside it. Whoever is doing it — a piece of malware, an intruder who found a way in, or a person with a badge — has to move bytes across your perimeter. Bytes crossing a perimeter are exactly what firewalls and flow collectors count. The trick is knowing which counts matter.
This guide is written from the defender's chair. You will learn the six shapes that exfiltration tends to take in network data. You will learn the five dimensions you can score any suspicious transfer against. Just as important, you will learn how to tell theft apart from the many perfectly legitimate reasons a host might push a lot of data outward. By the end, "would we know?" will have an answer you can defend.
In this guide
- What the network can and cannot see
- Six shapes exfiltration takes
- The five signal dimensions
- Theft or just a big transfer?
- Why single signals mislead and combinations convince
- A short triage sequence
- Where to go next
What the network can and cannot see
Start with a realistic picture of your vantage point. Almost everything that crosses your perimeter today is encrypted, which means the network cannot read the content of a transfer. You will not see filenames, document titles, or the text of an email. What you can see is the envelope. It shows which internal host talked to which external address, over which protocol and port. It shows when the transfer started, how long it lasted, and how many bytes went in each direction. Firewall logs record this for every allowed session. Flow records — the summaries of conversations that routers and switches export — record the same thing for every conversation they see.
That sounds like a limitation, and it is. But the envelope turns out to be enough for the job, because exfiltration is a pattern problem, not a content problem. Suppose a receptionist's laptop sent more data to a never-before-seen address at two in the morning than it normally sends in a month. You do not need to read the stolen file to notice that. The rest of this guide is about training your eye for those patterns. If you are new to flow data as a security source, the broader case for it is made in Flow Data for Security. Here we stay focused on outbound movement.
One vocabulary note before we go on. Egress means traffic leaving your network for the outside world; ingress is traffic coming in. Exfiltration is, by definition, an egress problem, so most of what follows is about watching the outbound half of every conversation.
Six shapes exfiltration takes
Real cases rarely look like a movie. They look like one of the following six shapes, sometimes two or three of them at once. Each is described as you would actually see it in flow records or firewall logs.
1. Outbound volume that does not fit the host's role
Every device on your network has a job, and the job dictates a direction. Workstations download: web pages, email, updates, files from the file server. They upload very little — a few attachments, some video-call audio, background sync. Backup targets, mail relays, and file servers are the opposite; pushing large volumes out is their whole purpose. So when a workstation starts uploading like a backup server, the volume is not the point. The mismatch between volume and role is the point. A desk PC that sends more than it receives for an hour has, in a small way, changed jobs, and nobody told you.
2. A new or rare external destination receiving a lot
Most hosts talk to a surprisingly stable set of outside addresses: your cloud email, a handful of update services, the sites the users visit daily. Suppose a destination has never appeared in this host's history — or in anyone's history on your network. If it immediately receives a large amount of data, that is one of the most reliable signals you have. Legitimate new destinations do appear all the time, but they usually arrive small. A first visit to a website is a few hundred kilobytes, not several gigabytes flowing outward. "First seen today, and already the top upload destination" is a sentence that should make you sit up.
3. Transfers at odd hours
People follow schedules. Servers follow schedulers. Both are predictable. A workstation whose user goes home at six should be nearly silent at three in the morning, apart from patch downloads and a little housekeeping chatter. A large upload at that hour is unusual by definition — nobody is sitting at the keyboard, and desktops do not normally have night jobs that push data out. Time is one of the cheapest signals you can check, which is why it gets its own guide in this pillar, Odd-Hours Transfers.
4. A protocol the host has never used before
Hosts are creatures of habit at the protocol level too. A workstation speaks web protocols, email, DNS, and whatever your business applications use. Suppose that same workstation suddenly opens a long-lived outbound session on a port it has never touched. That might be an old-fashioned file-transfer protocol, a remote-shell port, a peer-to-peer port, or an unusual high-numbered port to a bare IP address. In that case, something new is running on it. The firewall may well have allowed the session, because many perimeters allow most outbound traffic. Allowed is not the same as normal.
5. Many small transfers adding up
Not everything leaves in one dramatic burst. Some exfiltration is patient: a few megabytes every hour, to the same place, for weeks. Each individual transfer is too small to trip any per-session alarm, and only the daily or weekly total per destination reveals it. This is why per-host, per-destination totals over a day matter more than any single big flow. It also overlaps with the regular check-in behaviour covered in the Traffic Anomaly Detection guides. A beacon is small and regular, and a slow leak is a beacon that has started carrying luggage.
6. Staging: a gather, then a push
Before a large amount of data goes out, it usually has to be collected. From the network, this shows up as an unusual internal pattern followed by an unusual external one. For example, a workstation reads far more than usual from the file server or a database, sometimes for hours. Then a large outbound transfer follows shortly afterward. You never see the archive being built — that happens on the host's disk, out of your view. But the "big internal pull, then big external push" sequence is visible indirectly. It is worth looking for whenever the external half catches your eye.
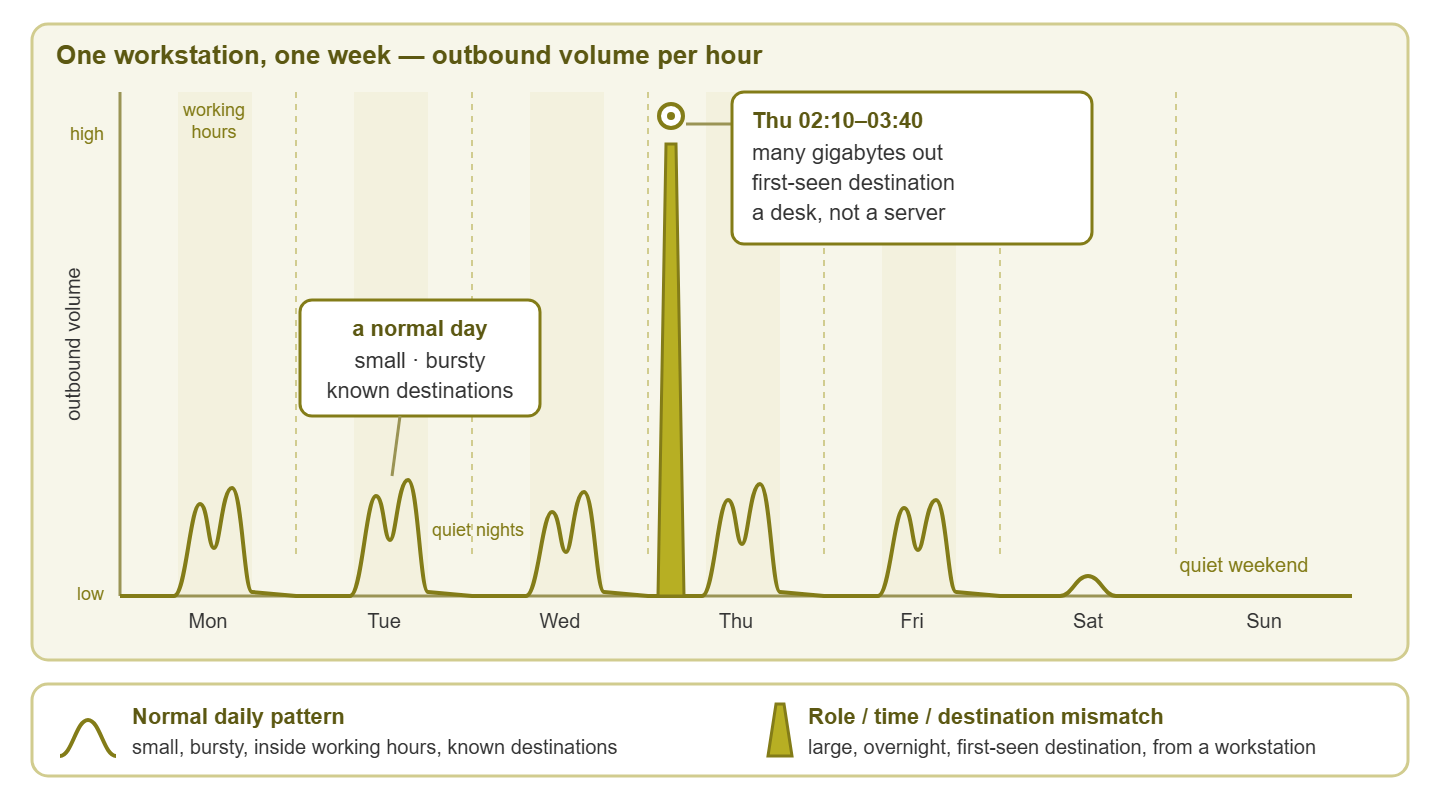
Figure 1: One workstation, one week. The daily bumps are what normal looks like; the Thursday spike combines three mismatches at once — wrong role, wrong hour, unknown destination.
The five signal dimensions
Those six shapes are easier to work with if you reduce them to five questions you can ask about any outbound transfer. Think of them as dimensions on a scorecard: each one can look boring or worrying on its own, and the interesting cases score badly on several at once. (The general theory of traffic anomalies uses a similar set of axes. What Is an Anomaly? covers that ground for all kinds of traffic. The table below is tuned specifically for data leaving the building.)
| Dimension | The question | Boring when… | Worrying when… |
|---|---|---|---|
| Volume | How much went out, compared with this host's normal? | It is within the host's usual daily range, or explained by a known job. | It is many times the host's typical day, or a slow trickle that adds up to a large total per destination. |
| Destination | Where did it go, and have we seen that place before? | A destination this host (or the whole network) talks to routinely: your cloud services, update servers, business partners. | First-seen for this host or for everyone; a bare IP address with no name; a place that received a lot on its very first appearance. |
| Time | When did it happen, relative to this host's working window? | Inside the user's working hours, or inside a scheduled maintenance or backup window. | Overnight, on a weekend or holiday, or while the assigned user is known to be away. |
| Protocol | How did it travel, and is that normal for this host? | The same web, mail, and application protocols the host uses every day. | A protocol or port this host has never used; a long-lived session on an unusual port; a direct-to-IP transfer with no DNS lookup behind it. |
| Role mismatch | Does this behaviour fit what the device is for? | A backup target uploading at night; a mail relay sending mail; a file server serving files. | A workstation, printer, or camera behaving like a server; a database server pushing data to the internet. |
Notice that every "worrying" column is written relative to the host, not in absolute numbers. There is no universal number of gigabytes that means theft. Ten gigabytes out of a video-editing workstation on a Tuesday afternoon is a normal week. Ten gigabytes out of the payroll clerk's desktop at four in the morning is an incident until proven otherwise. That is why the next guide in this pillar, Outbound Baselines, is about learning each host's normal before you try to spot its abnormal.
Theft or just a big transfer?
Now for the honest part. Most large outbound transfers are not theft. If you alert on volume alone, you will spend your days chasing the following. All are completely legitimate and all look, at first glance, like a host "uploading a lot":
- Cloud sync clients. A user drops a folder of photos into a synced directory and their laptop uploads for an hour. The destination is a well-known cloud service the whole company uses, the hour is daytime, and the user is sitting right there.
- Backups to an off-site or cloud target. Large, nightly, to the same destination every time, from a host whose job is exactly this. This is the definition of a role match, not a mismatch.
- Video and media uploads. Marketing uploads a recorded webinar; a training team publishes videos; someone attaches a screen recording to a support ticket. Big, bursty, daytime, known destination.
- Software builds and package pushes. A developer's machine or a build server publishing to a code host or artifact store.
- Operating system and application telemetry. Small, constant, to vendor addresses. Boring by design, but it will appear in any "new destination" list the day a vendor changes its infrastructure.
And then there is the case that gives everyone a headache: the departing employee. A person who has resigned copies a large amount of material to a personal cloud account in their last week. On the network it looks like a large upload to a consumer destination during working hours. Whether that is theft depends entirely on what they copied and what they were allowed to copy. The copied material might be their own drafts and personal photos, or the customer list. The network cannot tell those apart. That is not a monitoring failure; it is a boundary. Whether a transfer was authorized is a policy question, answered by managers, HR, and your acceptable-use rules. Whether a transfer happened, when, how big, and to where is the network question — and it is the only one this pillar can help you answer.
Tip: keep those two questions separate in your head and in your reports. When you escalate a suspicious transfer, describe what the data shows ("this host sent this much to this destination at this time, which it has never done before") and stop there. Deciding whether that was allowed belongs to someone with authority over people, and mixing the two makes both harder.
The practical consequence: your job is not to catch every large transfer. It is to catch the transfers that are large and out of character on more than one dimension. It is also to hand the rest to the humans who can judge intent.
Why single signals mislead and combinations convince
Each of the five dimensions, taken alone, has an innocent explanation most of the time. Volume alone is the cloud-sync problem above. A new destination alone is every vendor migration and every new website a user visits. Odd hours alone is every patch cycle and every insomniac working from home. A new protocol alone is every freshly installed application. Even role mismatch alone can be a developer testing something on their desktop. If you alert on any one of them, you will drown, and drowning defenders stop reading alerts.
Combinations are different. The innocent explanations for each dimension are mostly independent of each other, so the chance that three of them line up by accident is small. A cloud-sync burst happens during the day, to a known service, over a normal protocol, from a host whose user is present. A backup happens at night, but from the right host, to the right place, on the right schedule. Consider a desktop that uploads a large volume overnight to an address nobody has ever contacted over a port it has never used. It is very hard to build an innocent story for that. Three lined-up mismatches are not proof, but they are enough to justify an investigation, and that is all a signal needs to be.
Here is the same idea as an annotated walkthrough. Three outbound events, each scored against the five dimensions.
Event A  host: LAPTOP-MKT-12   out: ~6 GB   window: 14:05-15:10 Tue
         dest: shared cloud storage used company-wide (seen daily)
         proto: HTTPS (normal for host)
  volume: HIGH   dest: KNOWN   time: NORMAL   proto: NORMAL   role: FITS (marketing uploads media)
  -> 1 of 5.  Almost certainly a media upload. Note it, move on.

Event B  host: BACKUP-02       out: ~180 GB  window: 01:00-04:30 nightly
         dest: off-site backup target (seen nightly)
         proto: backup protocol on its usual port
  volume: HIGH   dest: KNOWN   time: NIGHT   proto: NORMAL   role: FITS (this is its job)
  -> 1 of 5 (night), and the one flag is expected for this role. Not a signal.

Event C  host: WS-FIN-04       out: ~4 GB   window: 02:40-03:25 Thu
         dest: bare IP address, first seen ever on this network
         proto: HTTPS to an address with no DNS lookup recorded
  volume: HIGH   dest: NEW      time: NIGHT   proto: ODD      role: MISMATCH (finance desktop)
  -> 5 of 5.  Investigate now; preserve the flow records first.
Event A and Event B both moved far more data than Event C. Neither is interesting. Event C moved the least and is the only one that deserves your evening. Volume got each of them onto the list; the other four dimensions decided which one mattered. If you take a single sentence from this guide, take this one: volume finds candidates; combinations find incidents.
A short triage sequence
When something outbound catches your eye, resist the urge to do anything dramatic until you have run a short, repeatable sequence. The full version — evidence preservation, containment, escalation, and who decides what — lives in the investigation playbook. The short version fits on a sticky note:
- 1. Name the host and its role. Turn the IP address into a device name and a purpose. "Workstation, finance, one assigned user" or "backup server" changes everything that follows.
- 2. Score the five dimensions. Volume against this host's normal; destination first-seen or known; time inside or outside the host's window; protocol usual or new; role fit or mismatch.
- 3. Look for the gather. Did this host pull an unusual amount from internal servers in the hours before the outbound burst? A staging pattern raises the score.
- 4. Check the calendar. Change tickets, scheduled jobs, a vendor migration notice, a user on leave. Innocent explanations are usually on a calendar somewhere.
- 5. Decide: note, watch, or escalate. One dimension: note it. Two: watch the host for a day. Three or more with no calendar explanation: preserve evidence and escalate.
Two cautions on step five. First, "watch" is an active choice with a deadline, not a polite way of forgetting; write down when you will look again. Second, if the host can reach genuinely sensitive data — the finance share, the customer database, the HR system — lower your threshold. Two lined-up mismatches on a host with that reach is worth escalating. The cost of being wrong in the quiet direction is much higher than the cost of a false alarm.
A note on what this is not
This guide is about recognizing patterns, not about hunting for one particular tool or technique. And it is deliberately silent on how data-theft tooling works. You do not need that knowledge to defend. And the shapes above stay valid no matter what is on the other end, because every method still has to move bytes across your perimeter. Nor is this the same job as finding a bandwidth hog. A hog is a capacity problem where the biggest talker is the answer, and the top-talker workflow handles it well. Exfiltration is usually not the biggest talker. It hides below the hogs, which is precisely why you score it on five dimensions instead of one.
Where to go next
You now have the defender's picture. Exfiltration is a pattern in the envelope, not a secret in the content. It takes six recognizable shapes. Each shape can be scored on volume, destination, time, protocol, and role. Combinations, not single signals, are what convince. The next step is to know your normal well enough that abnormal stands out, and that is where Outbound Baselines begins. After that, Egress Monitoring on a Budget shows how to build these reports from logs you already have. The rest of the series is collected in Spotting Data-Exfiltration Patterns.
Put this into practice with SysPeep Monitor
Every pattern in this guide is measured against a host's normal, and normal only exists if someone has been collecting it quietly for weeks. SysPeep Monitor auto-discovers your devices and graphs interface traffic over SNMP around the clock from one web console. That way, the daytime bump and the quiet night in Figure 1 are already on record when you need to compare against them. The free trial installs on any Windows machine.
Download Free TrialLearn About SysPeep - All Rights Reserved.