
The Top-Talker Workflow: From “Slow Internet” to a Name
The ticket says “the internet is slow.” Two more people say it in the corridor before you reach your desk. Somewhere on the network, something is eating the connection everyone shares. You are expected to find out what, on which machine, run by whom, and whether it should be happening at all. Without a method, that is an afternoon of guesswork: reboot the router, blame the Wi-Fi, hope it stops before the next meeting. Sometimes it does stop on its own, which is worse, because now it is a mystery with a return ticket.
With a method, it is usually a fifteen-minute job. Network people call the culprit a top talker: the device or conversation moving the most traffic through a link. Finding one takes no brilliance. It is a drill-down that follows the same steps every time, and each step asks one question your own data can answer. The answers shrink the field. A symptom that belongs to everyone (“the internet is slow”) becomes a fact that belongs to someone. “The marketing workstation is uploading raw video to a cloud sync service.” I have run it often enough to know that the steps matter more than the tools, and that the step people skip is always the first one.
This guide teaches that drill-down as a repeatable workflow. It walks a worked example from the first complaint to the closed ticket. It also covers the time-window traps that make honest data tell lies.
In this guide
- Why a workflow beats a hunch
- Step 1: Confirm the pipe is actually full
- Step 2: Open the flow data for that link and window
- Step 3: Read the top conversations
- Step 4: Turn the IP address into a device
- Step 5: Turn the device into an owner and an application
- Step 6: Decide and act
- A worked example, start to finish
- Time-window pitfalls
- The whole workflow on one page
Why a workflow beats a hunch
Bandwidth is a shared pipe. Your internet connection is one water main feeding the whole building. If someone upstairs starts filling a swimming pool, every tap in the place slows to a dribble. No amount of jiggling your own faucet will fix it. The complaints you hear (“video keeps freezing,” “the file share is crawling”) are taps dribbling. The cause is the pool. The workflow exists to walk you from the dribble to the pool without wandering the building opening random doors.
Think of it as a funnel. At the top is a symptom that implicates every one of a few hundred devices. Each step asks one question, answerable with data you already have. Each answer shrinks the suspect list. You go from “the whole network” to one link, to one conversation, to one machine, to one program run by one person. By the bottom of the funnel there is nothing left to guess about. The two disciplines that make the funnel work are the ones beginners skip. First, confirm before you hunt (step 1). Second, match your time window to the incident. Getting the window wrong is so common it gets its own section below.
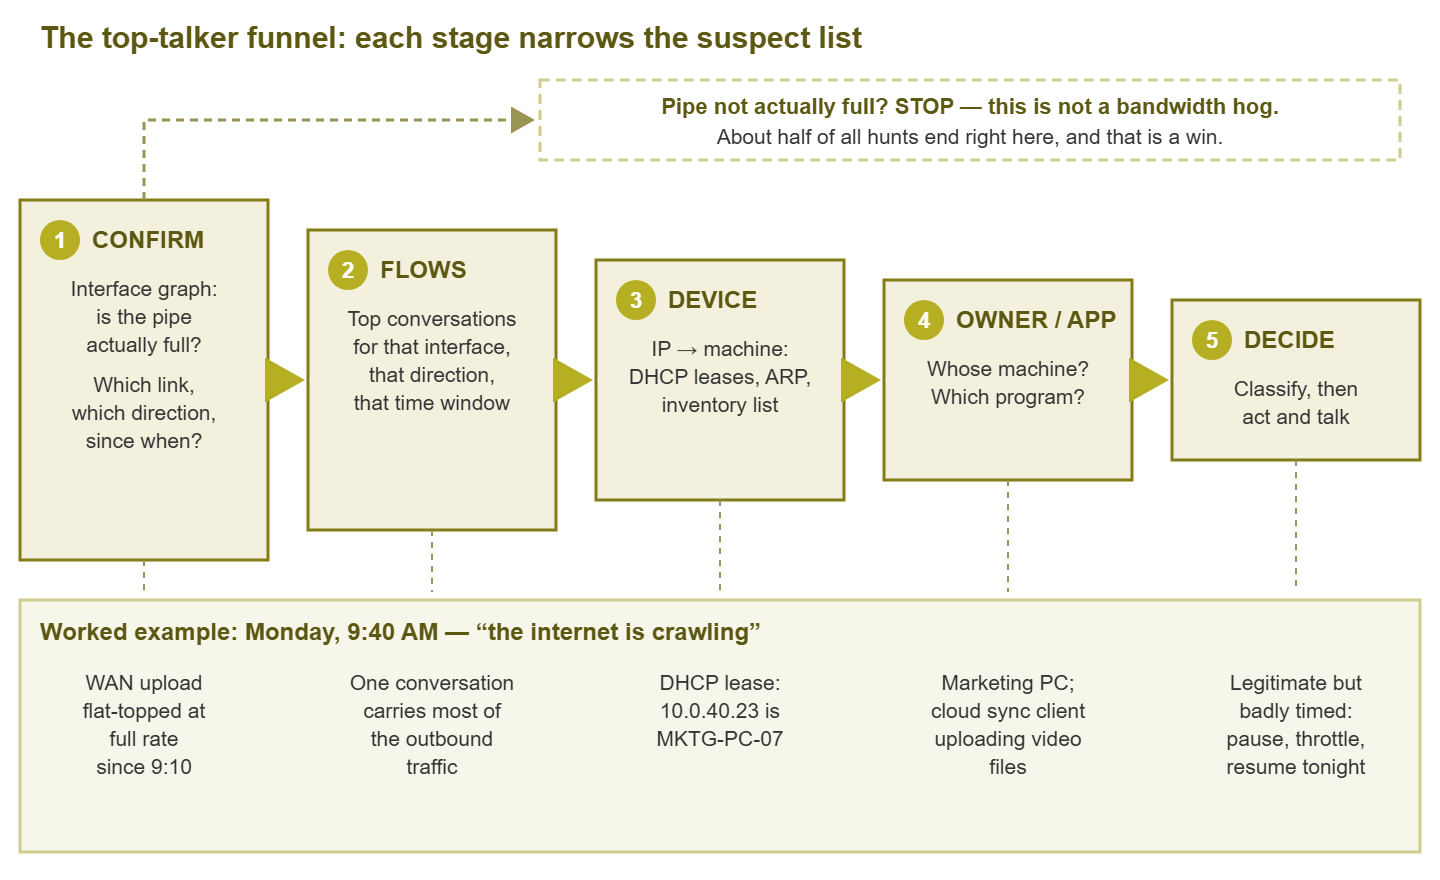
Figure 1: The funnel. Each stage narrows the suspect list, and the exit at stage 1 — “the pipe is not actually full” — ends about half of all hunts before they start.
Step 1: Confirm the pipe is actually full
Before you hunt a bandwidth hog, prove there is one. “Slow” has many causes — overloaded servers, DNS trouble, a sick application, packet loss on a bad cable — and only one of them is a full pipe. The test is the interface utilization graph: a chart of how much traffic a network port is carrying over time, compared to its capacity. Your monitoring system draws these from counters it collects off your router and switches. The one you care about first is almost always the internet link, because it is the smallest pipe everyone shares. (Site-to-site links and switch uplinks are the other usual suspects.)
Saturation — a full pipe — has a recognizable shape. The graph climbs, hits the link's capacity, and flattens into a plateau, as if someone took scissors to the peaks. A link bouncing around comfortably below its ceiling is busy. A link pinned flat against it is full, and everything trying to squeeze through is queuing and slowing. What counts as troublesome short of a dead-flat line is its own topic. See how full is too full for the longer answer. But for this workflow, the flat top is your green light.
Check both directions separately. Download and upload are independent lanes, and on many internet connections the upload lane is far smaller. A saturated upload is the classic sneaky case: downloads also collapse. Even a download requires a steady trickle of acknowledgment packets flowing back out. Those are stuck in the queue behind whatever is uploading. Users say “downloads are slow,” the download graph looks innocent, and the guilty upload graph sits one click away, pinned at its ceiling. It has been there since nine and it is not sorry.
And if the graph is not full? Stop. This is the exit about half of all hunts take. And it is a win, not a failure: in two minutes you have ruled out an entire category of problem. Do not keep hunting a hog that the data says does not exist. Go troubleshoot latency, DNS, or the application instead, and tell the complainants what you ruled out. Saying “the internet link is healthy, so it's something else — I'm on it” builds more trust than an hour of silent poking.
Tip: write down two things before you leave the graph: which direction is saturated, and when the plateau started. Those two facts are the filter settings for every step that follows, and forgetting them is how people end up staring at the wrong data insisting the network is haunted.
Step 2: Open the flow data for that link and window
The utilization graph tells you the pipe is full but not what is filling it. For that you want flow data: summary records your router or firewall can export describing every conversation that crossed it. They show which address talked to which, over which port, when, and how many bytes moved. It is the network's call-detail log: no content, just who, when, and how much, which is exactly what a top-talker hunt needs. What those records do and don't contain is covered in what flow data reveals. The mechanics of reading the reports — sorting, grouping, and the ways totals can mislead — are covered in reading flow reports. Here we only need the workflow view.
Open your flow tool and set three filters to match what you wrote down in step 1. Choose the interface that is saturated and the direction that is saturated. Then set a time window that covers the plateau, from a few minutes before it started until now. Those three filters are the difference between an answer and a haystack. The whole network over the whole day is thousands of irrelevant conversations; one interface, one direction, thirty minutes is usually one obvious answer.
No flow data to open? You can still run the hunt with switch counters, address tables, and a borrowed pair of pliers. That toolkit gets its own guide in finding bandwidth hogs without flow data.
Step 3: Read the top conversations
Sort the filtered records by bytes, largest first. A conversation is one pair of endpoints talking — internal address, external address, and the port that hints at what kind of talk it is. What you are looking for is not just the biggest number but the shape of the list. One conversation carrying a huge share of the link is a classic hog: single machine, single task, single fix. A handful of medium conversations from the same internal address is still one hog wearing several hats. Group the view by source address and it snaps into focus. And twenty modest conversations from twenty different machines, none dominant? That is not a hog at all. That is a network that has outgrown its pipe, which is a capacity conversation, not a culprit hunt.
Note the far end of the top conversation before you move on. The destination is free evidence. A well-known cloud storage range, your own backup server, or an address in a network you have never heard of each suggests a different story. You will use that evidence in step 5 and again when judging legitimacy.
Step 4: Turn the IP address into a device
Flow data ends at an IP address, and you cannot have a conversation with 10.0.40.23. The next move is resolving that address into a physical machine, and you have several phone books to try, in rough order of convenience. The first is the DHCP server (Dynamic Host Configuration Protocol). This service hands a machine an address when it joins the network and keeps a record of who was given what. Reverse DNS is on the list because asking costs nothing, and it does answer. Sometimes.
- The DHCP lease table. Your DHCP server hands out addresses and remembers who has them. The lease list maps the IP to a hostname and a MAC address, the hardware serial number burned into the network card. For workstations and laptops this answers the question in ten seconds.
- Your inventory or documentation. Servers, printers, and network gear usually carry static addresses that never appear in DHCP — they should appear in your IP documentation instead. If they don't, add them when you find them; every hunt should leave the map better than it found it.
- Reverse DNS. Asking DNS for the name behind the address sometimes returns a helpful hostname for free.
- The switch tables. When you need the machine's physical location, the router's ARP table ties the IP to a MAC address. The switch's MAC address table tells you which port — which cable, which desk — that MAC lives on. This is the long way around, and the full version of it lives in the no-flow-data guide.
One caution: DHCP addresses get reused, so check that the lease you are reading was active during your incident window. The machine holding an address now may not be the one that held it two hours ago. The lease's start time against your plateau's start time settles it.
Step 5: Turn the device into an owner and an application
A hostname is not a resolution; MKTG-PC-07 has not answered “why.” Two lookups remain. The owner comes from your asset inventory: who the machine is assigned to. You can also use the hostname's own naming convention, if you have a sane one, or the switch port's label. The application usually comes from evidence you already collected: the destination and port of the top conversation. The port number is the channel the conversation used, and well-known services keep well-known channels. A conversation to a cloud storage provider's address range on the standard web port is almost certainly a sync or backup client. A conversation to your own backup server is a backup job. A stream from a video platform is exactly what it looks like.
If the device is a server, the “owner” question becomes “what does this box do and what is scheduled on it?” The answer is very often a job somebody set up years ago and forgot. The commonest, in my experience, is a backup that was moved to nine in the morning so that someone would be around if it failed. Someone is around. So is everyone else. Either way, do not skip this step. Walking up to a user with “your machine is flooding the network” starts an argument. Try “I think your cloud sync client is uploading something enormous — did you add a big folder this morning?” That starts a conversation. Naming the application converts an accusation into a diagnosis.
Step 6: Decide and act
You now have a name, a machine, an application, and an owner. Two decisions remain. First, classify. Is this traffic legitimate business doing its job, or legitimate software doing the wrong thing at the wrong time? Or is it something that should not be on your network at all? The signals that separate those three verdicts — destination, timing, direction, pattern — are the subject of classifying bandwidth hogs. Second, choose the response: wait it out, reschedule the job, throttle it, or in rare cases block it. Have the human conversation that goes with it, which is covered honestly in you found the hog, now what?
The one thing not to do is the thing that tempts every busy admin: silently killing the traffic — yanking a patch cable, black-holing an address — and walking away. If the traffic was legitimate, you just broke something that mattered to someone, invisibly. If it was malicious, you just tipped off the one machine you needed to examine. If the network is on fire and you must mitigate immediately, prefer the polite version. Pause the job through its own software, or rate-limit the machine. And tell the owner what you did and why. Mitigation buys time; it is not the fix.
A worked example, start to finish
Monday, 9:40 AM. Three complaints in twenty minutes: video calls freezing, the web crawling. Step 1: you open the internet link's utilization graph. Download: busy, healthy, well under its ceiling. Upload: a wall. The graph climbed at 9:10 and has been flat against the link's full rate ever since. You write down: upload, since 9:10. There is a hog, and it is outbound.
Step 2: you open the flow tool, select the internet-facing interface, outbound direction, window 9:00 to now. Step 3: sorted by bytes, the report needs no interpretation:
Top conversations — WAN outbound, 9:00–9:45
#  Source          Destination       Port     Bytes     Share
1  10.0.40.23      203.0.113.50      443/tcp  21.4 GB   71%
2  10.0.10.8       198.51.100.12     443/tcp   1.9 GB    6%
3  10.0.20.31      198.51.100.77     443/tcp   0.8 GB    3%
   (everything else)                            6.1 GB   20%
One conversation is carrying most of the link. Step 4: the DHCP console shows 10.0.40.23 leased to MKTG-PC-07, lease active since last week — no address-reuse doubt. Step 5: the inventory sheet says MKTG-PC-07 is the marketing video editor's workstation. The destination address belongs to the cloud storage service the company already uses. Port and destination together say sync client. You walk over (it is one floor up, and voices work better than tickets for this) and ask the curious version of the question. The answer: a vendor delivered a drive full of raw footage this morning, and the editor copied the whole thing into a synced folder. The sync client has no sense of occasion. A folder changed, so it is uploading the folder.
Step 6: verdict: legitimate but badly timed. Together you pause the sync from the client's own menu. The upload graph on your phone drops off its plateau within the minute, which confirms you had the right machine. Then you set the client's built-in upload limit and resume. The footage still gets offsite today without flattening the office, and you agree the rest can finish overnight. You note the incident in the ticket: symptom, graph, culprit, cause, action, agreement. Elapsed time: about twenty minutes, most of it walking. The follow-up questions — should sync clients be throttled by policy? should an alert have caught this first? — belong to preventing repeat bandwidth hogs.
Time-window pitfalls
More top-talker hunts are ruined by time handling than by anything else. The data is honest; the window makes it lie. Four traps account for nearly all of it:
The hog that stopped five minutes ago
You confirm saturation, get coffee, take a phone call, and open the flow tool's “current traffic” view. It shows nothing unusual, because the transfer finished while you were on the phone. Live views only convict hogs still at the scene. Always query the historical window when the graph showed the plateau, not “now.” This is why flow data beats any live tool here: it remembers, so a hog that already left can still be named.
Averages that flatten the crime
A graph point covering five minutes shows the average of those five minutes. A transfer that hammered the link for ninety seconds averages out to an unremarkable bump, even though every user felt those ninety seconds. If complaints are real but the graph looks merely busy, zoom in — the plateau invisible at one zoom level is often obvious one level down.
Daily totals convict the wrong machine
Sorted over the whole day, the top of the list is whoever moved the most bytes since midnight. Often that is a machine trickling a large, harmless volume for hours without ever saturating anything. Meanwhile your actual twenty-minute monster barely dents the daily total. Totals answer “who uses the most”; incidents ask “who filled the pipe then.” Match the window to the plateau, always.
At Meridian Parts the help desk sorted a full day of flow records by bytes and found the monitoring server at the top. It had been there every day since it was installed. It polls every switch in the building once a minute and never goes home. They rate-limited it. The graphs went blank, and the complaints continued. The real hog, a twenty-minute upload from the scanner in goods-in, sat at number fourteen on the daily list. The incident note records that the monitoring server “was found not to be involved.”
Clocks that disagree
Your graphs come from the monitoring server's clock; flow records are stamped by the router's. If those clocks drift apart, your carefully chosen window is quietly offset and the hog sits just outside it. Keep every network device on the same time source using NTP, the Network Time Protocol. It is the standard way machines keep their clocks in step. When a window that should contain the answer comes up empty, widen it by ten minutes on each side before concluding anything.
The whole workflow on one page
- 1. Confirm. Open the utilization graph for the suspected link. Is either direction flat-topped? No — stop, it is not a bandwidth hog. Yes — note the direction and the plateau's start time.
- 2. Filter. Open flow data for that interface, that direction, that window.
- 3. Sort. Top conversations by bytes. One dominant conversation: a hog. One busy source, many destinations: still a hog — group by source. Everything modest and spread thin: a capacity problem, different playbook.
- 4. Resolve. IP to device via DHCP leases, inventory, reverse DNS — checking the lease covered your window.
- 5. Identify. Device to owner via inventory; conversation to application via destination and port.
- 6. Decide. Classify the traffic, mitigate politely if you must, talk to the owner, fix the cause, write it down.
Run this drill a few times and it compresses. The graph is open before the second complaint lands. The three filters are muscle memory. And “the internet is slow” becomes one of the better tickets you get, because it closes with a name, a cause, and a fix. Keep the six steps on a card by the keyboard until you notice you have stopped reading it.
Where to go next
The workflow finds the hog; the judgment calls come after. Learn to tell backup jobs from break-ins in classifying bandwidth hogs. Handle the human step in you found the hog, now what?. Run the hunt with no flow data at all in the no-flow toolkit. And make the next incident a routine alert with prevention. The rest of the pillar lives at Top Talkers: Who's Eating the Bandwidth. Work through it and the mystery stops buying return tickets.
Put this into practice with SysPeep Monitor
Every hunt in this guide starts with the same question: is the pipe actually full? SysPeep Monitor answers it before anyone complains. It auto-discovers your devices and graphs every interface's utilization over SNMP. It alerts you the moment a link pins at its ceiling, so you start at step 2 instead of step zero. The free trial installs on any Windows machine in minutes.
Download Free TrialLearn About SysPeep - All Rights Reserved.