
DNS Query Logging: Turning Your Resolver into a Sensor
Somewhere on your network there is a server that already knows, in advance, almost everything the rest of your machines are about to do. Before a laptop downloads an update, it asks a quiet question: "where is this name?" A server asks the same question before it talks to a cloud service. A compromised workstation asks it before contacting whoever compromised it. The machine that answers is your DNS resolver. Right now it is probably throwing that information away the instant it answers.
This guide is about keeping it. You will learn why a resolver is the cheapest security sensor you own. You will learn how to turn on query logging on whatever kind of resolver you run. You will learn which fields to record, and how to survive the volume. You will also learn how to handle the very real privacy questions, and how to close the gap that lets some clients sneak past the sensor. By the end you will have a log that answers the question every incident eventually asks: "which machine talked to that name, and when did it start?"
In this guide
- Why the resolver is the cheapest sensor you own
- Find the resolver that actually sees your clients
- What to record for every query
- Turning logging on, whatever you run
- Reading a query log
- Volume and retention: measure, then decide
- Privacy: a query log is a browsing history
- Shipping the log to a collector
- Closing the bypass: make clients use your resolvers
- Where to go next
Why the resolver is the cheapest sensor you own
A quick refresher, because it matters here. DNS (the Domain Name System) turns names like mail.example.com into addresses like 203.0.113.10. A resolver (also called a recursive resolver, or just "the DNS server") is the machine your clients ask. It either knows the answer, has it cached from a recent question, or goes and finds it on your behalf. Almost every client on your network is configured to ask one of your internal resolvers first.
That single fact is what makes the resolver so valuable. Think of it as the building's front desk. Nobody goes anywhere without stopping there and saying who they want to see. The visitor might then take the stairs or the elevator, wear a disguise, or lock the meeting-room door behind them. But the front desk still heard the name. In network terms: traffic may be encrypted end to end. It may go out through a proxy, or it may use a port your firewall barely watches. But the DNS lookup that preceded it was a plain question to your own server. The query log is the network's intention log.
Compare the cost with the alternatives. Full packet capture on a busy link needs serious storage and hardware. Flow records are cheaper but show addresses, not names, and an address rented from a cloud provider tells you very little. A query log is a text line per lookup, written by a server you already own. It contains the one thing humans and attackers both work in: names.
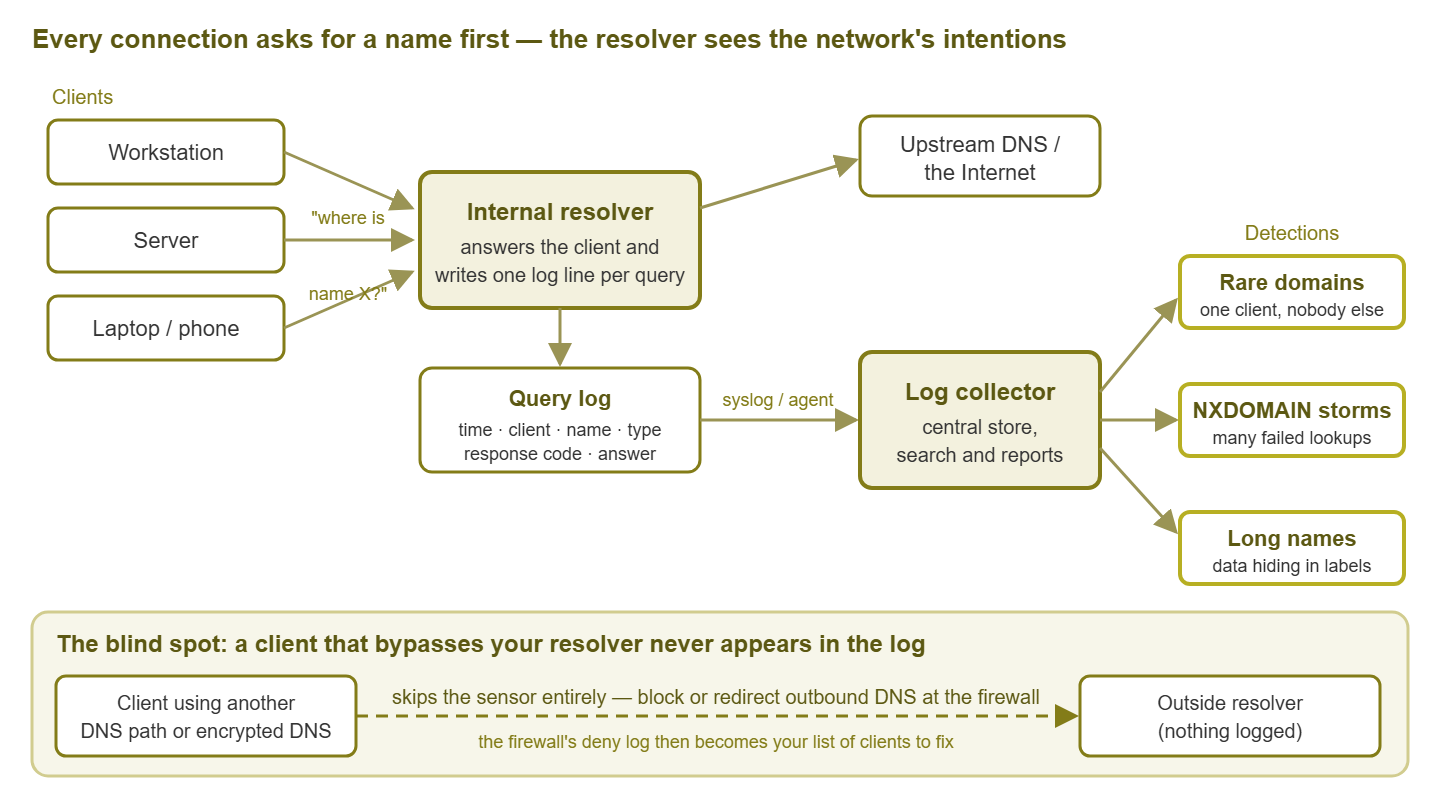
Figure 1: The resolver as a sensor. Every lookup becomes one log line, shipped to a collector where a handful of simple questions become detections. The lower panel is the catch: a client that resolves names somewhere else never appears in the log.
One honest caveat. The log tells you what was asked, not necessarily what was done. Browsers prefetch names for links a user never clicks. Security software resolves names it is checking. A lookup is not proof of a connection. The log is an excellent place to start an investigation and a poor place to end one.
Find the resolver that actually sees your clients
Before you enable anything, work out which server your clients really talk to. It is not always obvious, and logging on the wrong one produces a log that is technically complete and practically useless. Most networks use one of three arrangements:
- Directory-integrated DNS. The DNS service runs on your domain controllers and holds your internal zones. Clients point at it because the directory requires it. This is the most common setup and the resolver most people forget is also a sensor.
- Dedicated resolvers. One or two servers or appliances that do nothing but resolve names for clients, usually forwarding to the outside world. Common where the network team owns DNS separately from the directory team.
- Forwarders and chains. A client asks a local server, which asks a central one, which asks the Internet. Firewalls and proxies sometimes sit in this chain with DNS features of their own.
The rule is simple: log at the first hop that sees the client's own address. Suppose a workstation asks a branch server, which forwards to head office. If you only log at head office, every line will show the branch server as the client. You will know that "someone at the branch" asked for a suspicious name, and then you will have to enable logging at the branch anyway. Where a chain exists, log at the edge closest to the clients, or at every layer if storage permits. If you are not sure where the first hop even is, the resolver architecture guide walks through the reference layout for a small organization.
What to record for every query
A query log line is only as useful as the fields in it. Some resolvers default to a minimal format that leaves out exactly the parts you will want at three in the morning during an incident. Here is what to capture and why.
| Field | Why it matters |
|---|---|
| Timestamp (with time zone, synced by NTP) | Lets you line the lookup up with firewall, proxy, and endpoint logs. Unsynced clocks turn correlation into guesswork. |
| Client address (and port if offered) | The whole point. Which machine asked. Combine with DHCP leases or your inventory to get a hostname and a person. |
| Query name | What was asked for, in full. The subdomain structure, the length, and the "have we ever seen this before" question all come from here. |
| Record type (A, AAAA, TXT, MX, and so on) | Normal clients mostly ask for addresses. Odd types in bulk from an odd client are an early signal. |
| Response code (NOERROR, NXDOMAIN, SERVFAIL, REFUSED) | Failed lookups are a detection signal on their own; a storm of NXDOMAIN from one client is worth a look. |
| Answer (the returned addresses or data) | Turns "who asked for the name" into "who was told to go to this address." Essential when a bad name later changes where it points. |
| Cached or recursed, response size, duration | Nice to have. Cache hits show repeated interest; large responses and slow answers help the ops side and some tunneling checks. |
| Which resolver wrote the line | Trivial today, vital the day you have five resolvers and need to know which one answered. |
If your resolver forces a choice, prioritize in this order: client, name, timestamp, response code, record type, answer. Everything else is a bonus. A log of questions alone still catches a lot, but answers are what let you say "this workstation was directed to that address" with confidence.
Turning logging on, whatever you run
The exact clicks depend on your product, so this section describes what to look for rather than pretending every menu looks the same.
Directory-integrated DNS
Most directory-integrated DNS servers offer two kinds of logging. The older one is a "debug log" that writes a verbose text file including packet details. It is designed for troubleshooting and infamous for filling disks and slowing the server. The newer one is an event-based query log, sometimes called analytical or diagnostic logging, that writes one structured event per query with far less overhead. Prefer the event-based option. Point it at a volume other than the system drive. Set a size cap so a busy day cannot take down a domain controller. Have your log agent read and forward those events.
Dedicated resolver software
Dedicated resolver software almost always has a query-log switch and a choice of destination. That could be a local file, the system log, or a syslog channel directly to a collector. Sending straight to syslog avoids managing file rotation. But keep a short local buffer if the software supports it. That way, a collector outage does not mean lost lines. Check the default format; some write a terse line without the answer or response code, and a single option usually enables the full version.
Firewalls, proxies, and appliances that do DNS
If your firewall or a network appliance is the resolver for some segment (a guest network is the classic case), it will usually log DNS as one category among many. This is often off by default because of volume. Enable it explicitly and confirm the log line shows the real client address, not the firewall's own interface.
Tip: after enabling logging, run a lookup from a workstation for a name you invent on the spot, such as sensor-test-yourname.example. Then find it in the log. If your test line is there with your own client address on it, the sensor is live. If the client address is a server's, you are logging at the wrong hop.
Reading a query log
Formats vary, but once you can read one you can read them all. An illustrative excerpt in a generic layout, a few seconds from one resolver:
Mar 04 09:14:02.113 resolver=dns01 client=10.20.4.55 qname=updates.vendor.example qtype=A rcode=NOERROR answer=198.51.100.7 cached=yes
Mar 04 09:14:02.140 resolver=dns01 client=10.20.4.55 qname=updates.vendor.example qtype=AAAA rcode=NOERROR answer=- cached=yes
Mar 04 09:14:03.502 resolver=dns01 client=10.20.7.19 qname=printer-3f.corp.example qtype=A rcode=NOERROR answer=10.20.1.40 cached=no
Mar 04 09:14:04.017 resolver=dns01 client=10.20.4.88 qname=intranet.corp.exmaple qtype=A rcode=NXDOMAIN answer=- cached=no
Mar 04 09:14:04.911 resolver=dns01 client=10.20.9.203 qname=k3j9a0sd2mfa8c1lq7r5t9vb.cdn-static.example qtype=A rcode=NOERROR answer=192.0.2.44 cached=no
Mar 04 09:14:05.330 resolver=dns01 client=10.20.9.203 qname=q8ml2z0x1w9p4n6d7f5g3h.cdn-static.example qtype=A rcode=NOERROR answer=192.0.2.44 cached=no
Walk through it as an investigator would. The first two lines are a workstation checking for updates, asking for both an IPv4 (A) and an IPv6 (AAAA) address, both answered from cache. That means someone else asked recently: ordinary. Line three is a client finding a printer by name inside your own zone: ordinary. Line four is a typo, exmaple instead of example, producing NXDOMAIN, the response code meaning "that name does not exist." One typo is nothing; a thousand failures from one client in an hour is a story. The last two lines are the interesting ones: one client, two long random-looking subdomains of the same domain in under a second. That could be a content delivery network doing its normal thing, or it could deserve a closer look. The sibling guides on tunneling patterns and beaconing and domain-generation patterns teach you to tell the difference. You could not have asked any of these questions without the log.
Volume and retention: measure, then decide
Query logs are big. How big depends on how many clients you have, what they run, and how chatty modern software is (very). Do not plan from a guess or from a number you read somewhere; networks differ by orders of magnitude. Instead, enable logging and measure one full day, ideally a normal weekday. Count the lines and the bytes. Multiply by the days you want to keep. Add room for growth and for the bad day when volume spikes. Now you have a storage plan grounded in your own reality. Repeat the measurement a few months later; software changes and so does your network.
Three practices keep the volume manageable without losing the value:
- Tier the retention. Keep a searchable "hot" window of raw lines on fast storage, then compress older days into cheap archive storage. Raw lines compress very well because they repeat so much.
- Keep summaries longer than raw lines. A daily table of "client, domain, query count, first seen, last seen" is a tiny fraction of the raw size. It answers most historical questions. Build it before the raw log ages out.
- Do not filter at the source. It is tempting to drop "boring" names like your internal zone or a cloud provider's update service. Resist. Boring names are the baseline that makes odd ones stand out, and today's boring name is tomorrow's compromised service.
How far back should you be able to look? Think about how long a quiet compromise might sit unnoticed, then imagine being asked "when did this start?" If your raw log only reaches back a few days, your honest answer will be "at least a few days ago," which nobody enjoys saying. Summaries soften this: even when raw lines are gone, a first-seen table can still tell you the date a client began resolving a particular name.
Privacy: a query log is a browsing history
This is the part many technical guides skip, and the part that can get you into real trouble. A DNS query log is, in effect, a browsing history for every person on your network. It shows which news sites someone reads and which job boards they visit at lunch. It shows which medical or support services they look up. It also shows which dating, religious, or political sites they open on a break. You did not enable logging to learn any of that, but you now hold it, and holding it carries obligations.
Treat the log the way you would treat HR data:
- Restrict access. Only the people who investigate security events should be able to search raw lines by client address. Nobody should browse it out of curiosity, and "nobody" includes you.
- Retain sensibly. Keep raw lines for as long as investigation genuinely requires and no longer. A defensible retention period is one you chose for a reason and wrote down.
- Aggregate for reports. Management does not need to know that a particular person visited a particular site. "Top failed lookups" and "clients resolving new domains" are aggregate figures that carry no personal detail.
- Document the policy. Write down what is logged, why, who can see it, how long it is kept, and how access requests are handled. Get it approved by whoever owns HR and legal questions, and tell staff it exists in whatever form your workplace rules require.
Rules on workplace monitoring differ enormously between countries and industries, and this guide cannot tell you what applies to you. What it can say is that "we log DNS for security and here is the policy" is defensible almost everywhere. In contrast, "we log everything and anyone in IT can search it" is not. Do the paperwork early; it takes an afternoon and protects the sensor from being switched off the first time someone notices it.
Shipping the log to a collector
A log that lives only on the resolver has two problems. You cannot search across resolvers, so "which clients anywhere asked for this name?" means logging into each server in turn. And if a resolver is compromised or simply fails, its log goes with it. The fix is to forward every line to a central collector as soon as it is written. If you do not have one yet, the guide on building a central syslog server covers that project from scratch. A DNS query log is a perfect first tenant.
A few details that matter specifically for DNS logs:
- Time synchronization. Every resolver and the collector must use NTP and agree on the time zone in log lines. The first thing you will do with the log is compare it against another log, and clock skew of a few minutes ruins that.
- Parse into fields at the collector. Client, name, type, response code, and answer should become separate searchable fields, not a blob of text. Every detection in this topic is a query over those fields.
- Prefer a reliable transport. Plain UDP syslog silently drops lines under load, and DNS logs are exactly that sort of load. Use TCP or a buffering agent where your resolver supports it.
- Watch the pipeline. Alert when a resolver's line rate drops to zero. A silent sensor looks like a quiet network until you need it.
Closing the bypass: make clients use your resolvers
Here is the uncomfortable truth in the bottom panel of the diagram: your sensor only sees clients that use it. Anything that resolves names somewhere else is invisible, and there are more of those than you might think. A user who "fixed" their slow Internet by hard-coding a public resolver. A device that ships with its own DNS settings baked in. An application may use encrypted DNS (DNS over HTTPS or DNS over TLS). That wraps the lookup in a normal-looking encrypted connection to a resolver on the Internet. And, of course, malicious software, which has no interest in using your carefully logged server.
Completing the sensor means making your resolvers the only path that works:
- Hand out only your resolvers through DHCP and directory policy, and check the settings on the few devices that are configured by hand.
- Block outbound DNS from everything except your resolvers at the firewall: TCP and UDP port 53 from client subnets to the Internet, denied and logged. Some firewalls can instead transparently redirect stray port-53 traffic to your resolver, which is gentler on misconfigured devices. Either approach closes the gap.
- Turn off or redirect encrypted DNS in browsers and operating systems through central policy where you manage the devices. Consider blocking well-known public encrypted-DNS endpoints at the firewall for the devices you do not.
- Read the deny log. The firewall's list of blocked outbound DNS attempts is itself a sensor: every entry is a device that tried to go around you. Most are misconfigurations. The rest are worth a visit.
Do this in stages: log-only first so you can see what would break, fix the legitimate stragglers, then enforce. Expect a small grumble from whoever hard-coded that public resolver. That grumble is the sound of the sensor becoming complete.
Where to go next
You now have the foundation for everything else in this topic. You have a resolver that writes one honest line per lookup, and a collector that keeps those lines searchable. You have a policy you can defend, and a firewall rule that makes the sensor complete. That log is the raw material for recognizing data smuggled inside query names and for spotting beaconing and domain-generation patterns. It is also raw material for turning the resolver into a checkpoint with sinkholes and blocklists, and for the weekly hunting workflow that ties it all together. The full set of guides lives at DNS as a Threat Sensor.
Put this into practice with SysPeep Monitor
A query log is only useful while the resolver writing it is healthy and the pipeline carrying it is flowing. SysPeep Monitor watches your DNS servers and collectors the way it watches everything else, from one web console. It watches availability, resource use, and thresholds that alert you when a server goes quiet. The free trial installs on a Windows machine in minutes.
Download Free TrialLearn About SysPeep - All Rights Reserved.