
The Exoneration File: Evidence That Clears Your Network
The accusation usually arrives politely. "We think the network was dropping packets yesterday afternoon. Can you check?" You already know the answer is no. Nothing paged you, and the graphs you glance at every morning were boring. But knowing and proving are different jobs. Your confidence convinces nobody, and it should not, because you are the accused. What convinces people is an artifact: a specific, dated, checkable piece of evidence that a skeptic can examine without taking your word for anything.
This guide is about those artifacts. Five of them do most of the work: latency and loss graphs, path tests, interface counters, flow data, and synthetic checks. A sixth, the packet capture, is the heavyweight you keep in reserve. For each one you will learn what it proves, what it cannot prove, and what a skeptic needs to see before it lands.
What you do with them matters just as much. A pile of raw data is not an argument; a short, readable story built on that data is. And none of it works unless the collecting started before the accusation did. That is why the last part of this guide covers the standing evidence you keep running all the time. When the email arrives, you should be assembling a file, not starting an investigation.
In this guide
- What makes evidence convincing
- Artifact 1: latency and loss graphs
- Artifact 2: path tests
- Artifact 3: interface counters
- Artifact 4: flow data
- Artifact 5: synthetic checks from the user's seat
- The reserve: packet captures
- Assembling the one-page verdict
- The fifteen-minute assembly drill
- Standing evidence: never start from zero
- Where to go next
What makes evidence convincing
Four properties separate evidence that ends an argument from evidence that starts a new one. First, it must span the incident window. A test you ran after the complaint proves the network is fine now; the skeptic's whole theory is that it was broken then. Only data recorded continuously through the window answers the actual question. Second, it needs a baseline — a picture of normal to compare against. "Latency was 2 ms" means nothing to an application owner until you show it is 2 ms every other afternoon too.
Third, it must cover the accused path specifically. "The core was fine" does not clear the branch-office link the complaining users actually sit behind. Evidence about the wrong stretch of road is the fastest way to lose a skeptic, because it looks like misdirection even when it is just sloppiness. Fourth, it must be readable by a non-network person. Your audience is an application owner or a manager, not another network engineer. A graph with a clear title, a marked incident window, and a one-sentence caption beats a wall of counters every time. The evidence convicts or acquits; the presentation decides whether anyone reads it.
At Harbourview Clinic the patient-records system was reported as unusable from the outpatient wing between nine and ten one morning. The network team answered with a latency graph from the core switch to the records server, flat and clean. They were asked, politely, what the core switch had to do with the outpatient wing. Nobody had been probing from the wing, so a ping test was started that afternoon. It was clean too, which proved that the network was fine that afternoon. The argument ran for two weeks and ended in a draw. The probe from the wing has been running ever since, and the next complaint took twelve minutes to answer.
Artifact 1: latency and loss graphs spanning the incident
The foundation of every exoneration file is a continuous measurement of latency (how long a round trip takes). It also measures packet loss (what fraction of probes never came back). These measurements cover the paths people complain about — user segment to server, site to site, LAN to internet. In practice this is a monitoring system pinging each target every minute or so and recording every answer, forever. It is the closest thing networking has to a security camera: unblinking, timestamped, and running whether or not anything interesting is happening.
What it proves: that packets crossing the accused path during the window were arriving, and arriving on time. A flat latency line with zero loss across the exact hours of the complaint is devastating to a "the network was dropping things" theory. That is especially true when you can scroll back a week and show the line looks identical. What it cannot prove: anything about the path it does not cover. That is why the probes must run from where the users are, not just from the comfort of the data center. Presentation matters here more than anywhere: crop to the window, overlay or reference the baseline, and label the endpoints in words ("sales floor to CRM server"), not just addresses. The craft of getting these numbers honestly — probe frequency, what averages hide, why the worst round trips matter more than the mean — is covered in measuring latency.
Artifact 2: path tests
A path test — traceroute and its friends — lists the routers a packet passes through on its way to a destination, with a response time for each hop. On its own, a single traceroute is weak evidence. Paired with a saved reference, it becomes strong. Run the test during the incident and set it beside the reference you captured on a calm day. You can show the path itself did not change — same hops, same order, similar times. That kills a whole family of theories about mysterious reroutes and failovers. It exposes the opposite case too: when the path did change, you want to be the one who says so first.
One honesty note, because a skeptic who knows a little networking will raise it: routers treat "answer this trace probe" as their lowest-priority job. A hop showing a scary time or a dropped probe, while everything after it looks fine, usually means that router was busy answering, not busy failing. In that case, the packets passing through it were fine. A busy router forwards your packets and ignores your questions, which is the right priority. Volunteer this caveat yourself before someone else does; explaining your own evidence's limits is one of the fastest ways to be believed about the rest of it. Keep reference traces for each important destination in the file, refreshed whenever the network legitimately changes.
Artifact 3: interface counters
Every switch and router port keeps score: how many packets it carried, how many arrived damaged (errors), and how many it had to throw away, usually because a queue overflowed (discards). Your monitoring system reads these counters over SNMP — the standard question-and-answer protocol for network gear — and turns them into per-port history. This is the artifact that speaks to the physical layer. A failing cable, a dying transceiver, a saturated uplink all leave fingerprints here that no amount of arguing can put there or wipe away.
For the file, pull the counters for every port along the accused path and present them as a simple table — something like this, which a non-network reader can follow:
Port                     In-errors  Out-discards  Peak util
sw-floor2 port 14        0          0             11%
sw-floor2 uplink 48      0          0             34%
sw-core   port 3         0          0             34%
sw-core   port 21 (CRM)  0          0             18%
Zeros across the board, with utilization far from the ceiling, is the network equivalent of a clean drug test. And when the numbers are not zero, you have just found a genuine problem. A rising error count on one port in the path turns your exoneration file into a confession file. That is the system working exactly as intended.
Artifact 4: flow data
Counters tell you how much a port carried; flow data tells you who it was and where it went. Most business-grade routers and switches can export flow records — small summaries of each conversation: source, destination, port, byte count. They use standards commonly known as NetFlow, sFlow, or IPFIX depending on the vendor. Collected and graphed, flow data answers the congestion question with names attached: was there a surge of traffic during the window, and if so, whose was it?
In an exoneration, flow data works two ways. A flat, ordinary traffic profile across the window rules out the "the link was slammed" theory outright. A spike, meanwhile, does something even more useful: it identifies the talker. That might be the backup job that ran long, the workstation uploading who-knows-what, or the server replicating at noon instead of midnight. Identifying the talker converts a vague argument about the network into a specific conversation about one machine and one behavior, which is a conversation that actually ends. What flow data cannot show is why an application was slow when volumes were normal; it sees envelopes and postmarks, not the letters inside.
Artifact 5: synthetic checks from the user's seat
Every artifact so far measures the road. A synthetic check measures the journey. It is a monitoring robot that performs a real user action — fetch the login page, sign in, open a record — every few minutes. It runs from the network segment where the complaining users actually sit, recording how long each step took and whether it worked. When someone says "it was unusable from the sales floor at nine," the synthetic check is the witness. It was sitting on the sales floor at nine, doing the exact thing, with a stopwatch.
This artifact earns its place because it is the only one that speaks the accuser's language. Latency graphs exonerate the path; the synthetic check explains the experience. The killer combination is both together: the path delivered packets in two milliseconds. And the robot's login took nine seconds — therefore the missing time was spent inside the application, not on the wire. That one-two is the heart of most successful exonerations. Synthetic results double as your availability record — the long-term log of up, down, and degraded that answers "how often does this actually happen?" That discipline has its own guide in the uptime evidence file.
The reserve: packet captures
When the stakes are high or the skeptic is technical, the court of last resort is a packet capture. That is a recording of the actual traffic, taken at the switch, showing every request and response with microsecond timestamps. Captures settle arguments because they are not a summary of what happened — they are what happened. The signature move is timing the conversation's opening handshake against the first byte of the server's answer. The handshake reveals pure network round-trip time with no application involved. The gap before the reply reveals pure server think time. When the handshake takes two milliseconds and the answer takes nine seconds, the case is closed. Walking through exactly how to read that story is the subject of reading TCP conversations.
Treat captures as a reserve, not a routine. They are heavy to collect, awkward to store, and unreadable to non-specialists without your narration. The file's job is usually done by the five lighter artifacts. The capture is what you bring out when someone says "I still think the network ate our packets" after seeing all five — or when you offer, generously, to run one together.
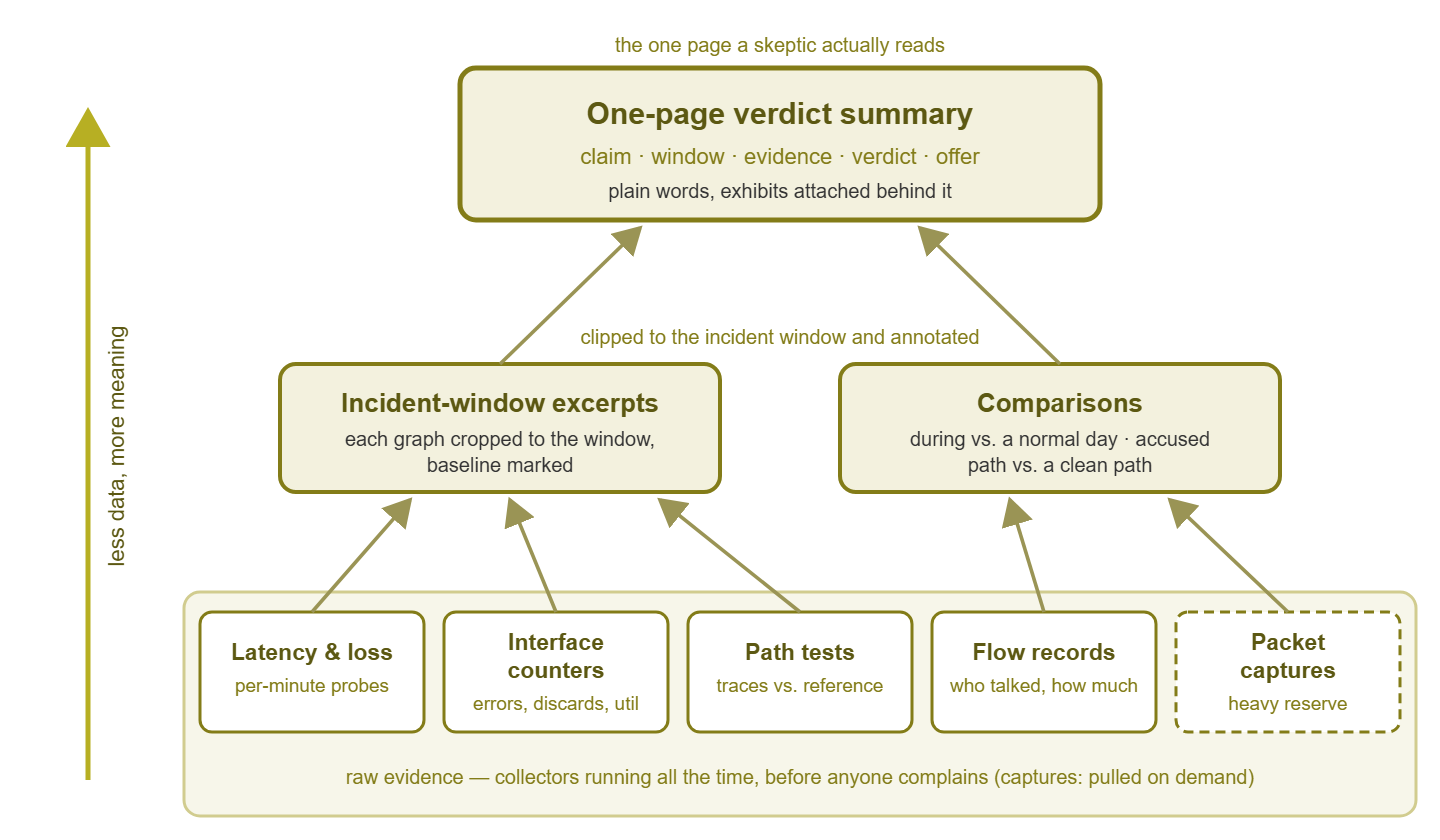
Figure 1: The exoneration file is a stack. Always-on raw data sits at the bottom, clipped and annotated excerpts in the middle, and a one-page verdict on top. Skeptics read the top; the bottom exists so nobody has to take your word for it.
Assembling the one-page verdict
Raw evidence acquits; narrative persuades. The deliverable that actually circulates is one page, written in plain words, with the artifacts attached behind it. That is the thing forwarded to the manager who asked "so was it the network?" A structure that works:
- The claim, stated fairly. Write down what is actually being alleged, in one sentence, without sarcasm. If you cannot state their theory fairly, nothing after it will be trusted.
- The window. Exact times, including when reports started — agreeing on when prevents the "you checked the wrong hours" rebuttal.
- The evidence, one line per artifact. Each line names the artifact, the path it covers, and the finding, with the graph or table attached.
- The verdict, scoped honestly. Say what the data supports — no more. "The path was healthy" is provable; "your application is broken" is not yours to declare.
- An offer. One concrete next step you are volunteering. It converts the document from a defense into a contribution.
Here is what that looks like filled in:
INCIDENT  CRM slowness reported from the sales floor
WINDOW    Monday 08:40-09:55 (first report 08:52)

CLAIM     "The network between the sales floor and the
          CRM server was dropping or delaying traffic."

EVIDENCE
 1. Latency, sales segment -> CRM server: steady 1-2 ms
    across the window; matches baseline. (Graph A)
 2. Packet loss, same path: 0% — 600 of 600 probes
    answered. (Graph A)
 3. Interface counters, all 4 ports on the path: zero
    errors and discards; peak utilization 34%. (Table B)
 4. Path test at 09:10 identical to saved reference:
    same hops, same order. (Trace C)
 5. Synthetic CRM login from the sales segment: pages
    delivered, but server responses took 8-11 s against
    a ~1 s baseline. (Graph D)

VERDICT   The network path was healthy for the entire
          window. The delay occurred after requests
          reached the CRM server.

OFFER     Happy to capture traffic on the server's switch
          port during a retest, and to sit in on the
          application-side review.
Tip: write the verdict page as if it will be read by someone who likes you, three months from now, with no memory of the incident. That is exactly who reads these. Plain nouns, spelled-out times, no acronym left undefined. The two minutes you spend translating are what make the document forwardable, and forwardable is the whole point.
The fifteen-minute assembly drill
With standing collection in place, building the file during a live dispute is a drill, not a project. The first time I ran it took forty minutes, twenty-five of them spent looking for the button that exports a graph. It goes like this:
- Minute 1-2: pin down the window and the endpoints with the reporter. "Which application, from where, starting when?" Everything else depends on getting this right, and asking first signals you are investigating, not deflecting.
- Minute 3-6: open the latency and loss graphs for that path, crop to the window plus an hour on each side, and snapshot them. Note the baseline comparison in one sentence each.
- Minute 7-9: pull the counter table for every port on the path; snapshot utilization for the same window.
- Minute 10-11: run a live path test and set it beside the saved reference; note "identical" or describe the difference.
- Minute 12-13: pull the synthetic check's step timings across the window — the "what users felt" exhibit.
- Minute 14-15: write the verdict page from the template, attach the exhibits, and send it with a concrete offer.
Your first time through will take longer too, mostly in finding where things live in your monitoring console. That is why it is worth rehearsing once on a fake incident. The drill turns "can you check?" from a half-day interruption into a coffee-length task. The speed itself becomes part of your reputation. Answers that arrive in fifteen minutes, with exhibits, get believed.
Standing evidence: never start from zero
Everything above assumes the data existed before the accusation. That is the real discipline of the exoneration file: it is mostly built in peacetime. The habit has two halves. The first is always-on collection — the five artifact sources running continuously against the paths and services people depend on, with enough history retained to show a believable baseline. The second is incident-time preservation: the moment a dispute starts, snapshot the relevant graphs and counters into a folder for that incident. So the evidence is frozen even after the live dashboards roll forward. A quick reference:
| Artifact | Keep running always | Grab when a dispute starts |
|---|---|---|
| Latency & loss graphs | Per-minute probes on key paths | Window + same period on a normal day |
| Path tests | Reference traces, refreshed on change | A live trace to set beside the reference |
| Interface counters | SNMP polling of every port on key paths | Error/discard/utilization table for the window |
| Flow data | Export from core and WAN devices | Top talkers during the window |
| Synthetic checks | One real transaction per key app, per segment | Step timings across the window |
| Packet capture | Nothing (too heavy) | Only if the lighter five don't settle it |
Two closing habits keep the file trustworthy. Date and label every saved artifact at capture time — an unlabeled screenshot is a rumor with pixels. And review the standing collection whenever the network changes, because evidence covering last year's topology exonerates last year's network. If you inherit an environment with none of this running, start small. The latency, loss, and counter collection for your two most-complained-about paths is an afternoon of work. It is the afternoon that ends the next argument.
Where to go next
That is the whole file: five light artifacts collected all the time, plus one heavy reserve. It includes a one-page verdict that a non-network reader can follow and a peacetime habit of keeping the file warm. The next skills are social. Presenting the evidence to application teams so it lands as help rather than as a verdict read from the bench is covered in sharing data with app teams. Pointing the same techniques outward when the data implicates your provider is covered in testing and escalating with your ISP. For the wider campaign against reflexive blame, start at the pillar: Proving It's Not the Network. The next "can you check?" will arrive just as politely as the last one. The difference is that you will already have checked.
Put this into practice with SysPeep Monitor
An exoneration file needs collectors that were already running when the trouble started. SysPeep Monitor keeps the standing evidence for you — latency and loss history, interface error counters, and traffic data. It gathers that data over SNMP and WMI from one Windows console. Its dashboards and reports can go straight into a verdict page. The free trial takes minutes to set up.
Download Free TrialLearn About SysPeep - All Rights Reserved.