
What Monitoring Spend Actually Buys (and How to Say So to Leadership)
Somewhere on a spreadsheet, between the printer contract and the coffee, there is a line called "monitoring". Once a year somebody with a budget to balance looks at that line and asks what it did. The honest answer, in a good year, is that it sat there, watched everything, and nothing happened. That is exactly what you paid it to do. It is also the worst possible answer to give a finance director.
I have been on the wrong side of that conversation. I once described our monitoring as "the thing that tells us when stuff breaks". That was true, and it made monitoring sound like a smoke alarm we could do without because the building had not burned down recently. The line was cut the following year. The building, as it turned out, had opinions about that.
By the end of this guide you will be able to say what monitoring spend buys. You will be able to use plain sentences a non-technical leader can repeat to their own boss. Monitoring spend buys four concrete things, each tied to an outcome the business already measures, plus the one it buys you personally. You will have a translation table to fill in from your own network, and a query to fill it with. You will also have an honest statement of what monitoring does not do. That is because the honest version is the one that survives questions.
In this guide
- The problem with a good day
- The honest limits first
- The four things monitoring buys
- What it buys the administrator
- The insurance analogy, and where it breaks
- The translation table
- Saying it out loud
- A war story
- The "what it buys" checklist
- Where to go next
The problem with a good day
Monitoring is the easiest line in the budget to cut because its success is invisible. A backup that worked produces a restored file. A firewall that worked produces a log of blocked connections. Monitoring that worked produces a quiet month, and a quiet month looks identical whether you were watching or not. The tool did its job, and the evidence is the absence of something.
An absence is real, but proving one is harder than pointing at a thing. If you cannot point at a thing, the person holding the budget cannot either. A line nobody can point at gets moved to next year "for now". (Next year is when it gets moved to the year after.)
This guide is about giving them something to point at. It covers four specific things the monitoring spend bought this year, in words the business already uses. They are backed by numbers from your own logs. Once you can say those four things, the line stops being a cost that did nothing and becomes a purchase with a receipt.
The honest limits first
Start with what monitoring does not do, because a leader who was sold monitoring as a cure will feel cheated at the first outage. Monitoring does not prevent hardware from dying. It does not stop the internet provider's contractor from putting a digger through the fibre. It does not patch the server, replace the failing disk, or talk the switch out of rebooting. A monitored network breaks exactly as often as an unmonitored one.
What monitoring changes is how fast you know and how well you respond. A fault on an unmonitored network is discovered by a user, reported by a phone call, and diagnosed by walking around. The same fault on a monitored network is discovered by a poll. That means the monitoring server asking the device a question every minute or so and noticing when the answer changes. The fault is announced by an alert. That is a message sent when a measured value crosses a threshold, the line you drew in advance. The fault is diagnosed from a graph that shows what changed and when. The fault is identical. The next hour is not.
Say this to leadership before they ask, in roughly these words: "Monitoring does not stop things breaking. It changes how long they stay broken and how much we know while we fix them." A leader who hears that up front will not hold the next outage against the spend. One who was told monitoring "prevents downtime" will, and will be right to.
Tip: keep a short written list of what your monitoring cannot see. Examples are the site without a probe, the cloud service you only ping, the application nobody built a check for. Hand it over with the case. A known gap presented by you is a plan; the same gap discovered by a leader after an outage is a scandal.
The four things monitoring buys
Monitoring spend buys four things, and each maps to an outcome the business already measures. Learn the four and the plain sentence for each. The diagram below shows the first two in the only form a leader needs: the same fault, twice, with a shorter bar the second time.
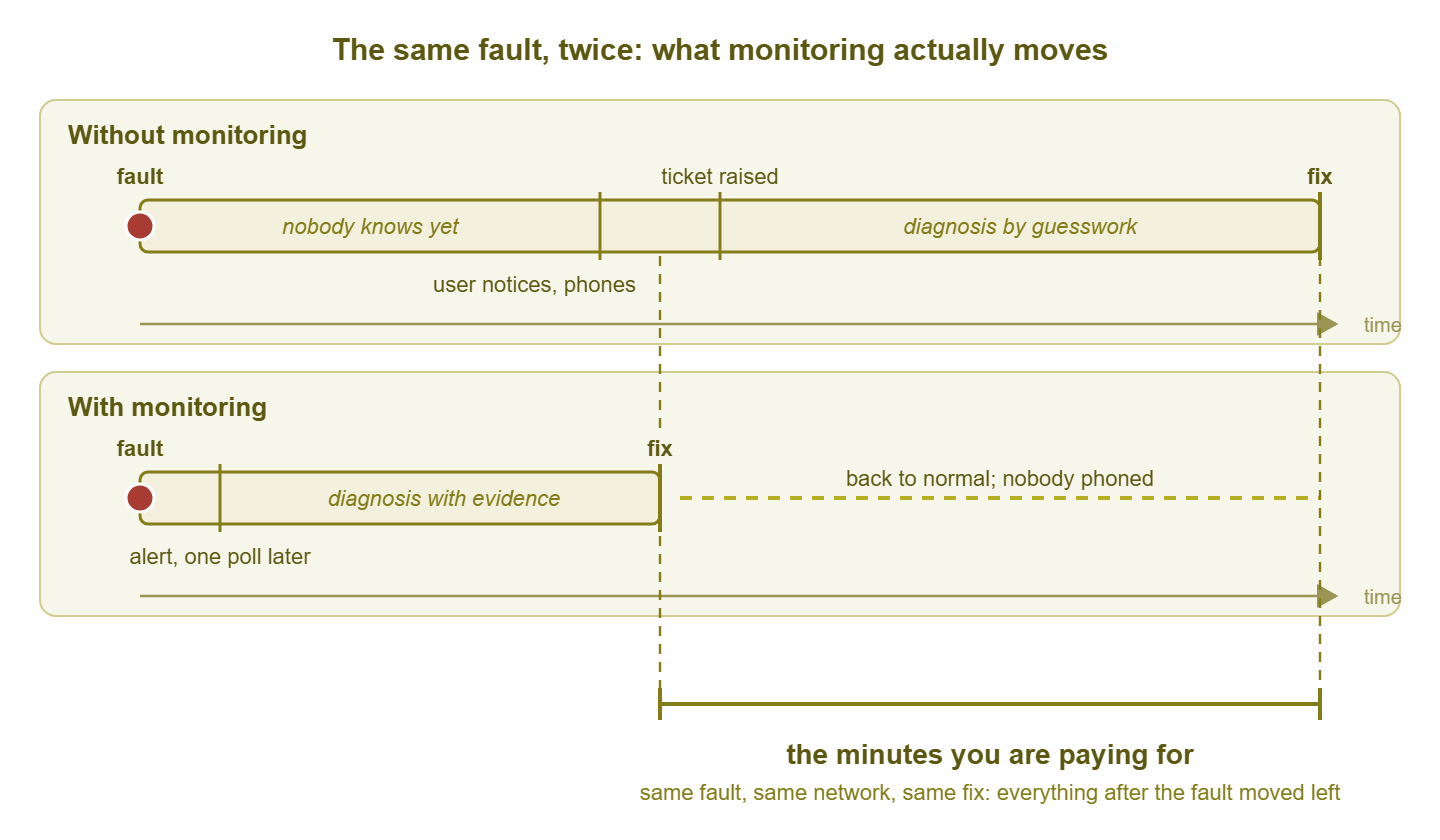
Figure 1: The same fault on the same network. Monitoring does not move the fault; it moves everything after it to the left. The distance between the two fix points is what the spend buys.
1. Earlier detection: shorter outages
Earlier detection means the clock on an outage starts when the fault happens, not when a user gets annoyed enough to call. On an unmonitored network the gap between those two moments can be minutes, or, at night and at weekends, hours. Monitoring closes it to one polling interval plus however long the alert takes to reach a person. The business outcome is a shorter outage: fewer people idle, fewer orders lost, fewer customers who noticed.
The plain sentence: "Monitoring tells us about a fault before the users do, so every outage is shorter by however long it would have taken someone to notice and complain." The guide on reducing detection time covers shrinking that gap further; for the budget case, measuring it is enough.
2. Shorter repair: evidence instead of guesses
Shorter repair means the person fixing the fault starts with facts. An alert that reads "core switch uplink down since 09:14" sends the admin to one port and one cable. A phone call that says "the internet is slow" sends the admin to a whiteboard. Monitoring supplies the timestamp, the device, the metric that changed, and the graph of the hour before. That is most of the diagnosis before anyone has logged in. The business outcome is again fewer minutes down, but the mechanism is worth naming separately, because leaders understand "we knew where to look".
The plain sentence: "When something breaks, monitoring tells us what changed and when, so we spend the first ten minutes fixing instead of guessing."
3. Fewer surprises: capacity and creep caught early
Fewer surprises means the slow failures are caught while they are still cheap. A disk that fills at two per cent a week will fill. The only question is whether you find out from a graph in spring or from a crashed database at month-end. Creep is the slow drift of a measurement towards a limit. Examples are a link filling, a certificate ageing towards expiry, a device count nudging a licence tier. And creep is invisible without a history to draw a line through. Monitoring keeps the history. The business outcome is an upgrade bought on a normal purchase order with a normal lead time, instead of an emergency purchase at an emergency price.
The plain sentence: "Monitoring shows us what is running out before it runs out, so we replace things on our schedule rather than the failure's." Much of this work goes unnoticed precisely because it worked; the pillar on making invisible work visible is about getting credit for it.
4. Evidence: for the ISP, the auditor, the vendor, and the review
Evidence means that when there is a dispute, you have a record and the other side has an opinion. The internet service provider says the line was fine; your latency graph says otherwise, with timestamps. The auditor asks whether the backup server was available all quarter; the availability report says yes, with two maintenance windows marked. The vendor says the storage array has never dropped a path; the alert log lists the four times it did. A post-incident review is the meeting after an outage where the team works out what happened and what to change. It has a timeline when you have monitoring and memories when you do not. The business outcome is service credits actually claimed, audits passed with less staff time, and reviews that produce fixes rather than arguments.
The plain sentence: "Monitoring gives us a written record, so when we argue with a supplier or answer an auditor we bring evidence instead of recollections."
What it buys the administrator
Monitoring also buys the administrator two things that never appear on a budget line: sleep, and not being blamed. Sleep, because an alert at two in the morning is unpleasant, but the alternative is finding out at eight from thirty people at once. Not being blamed, because "the switch failed at 03:12 and we were on it by 03:20" is a different sentence from "we are not sure when it went down". The second sentence is where blame lives.
These are business benefits too, and you should say so, carefully. An administrator who is not woken by surprises stays. An administrator who can show a timeline after an outage is trusted with the next project. Losing a member of a small IT team is expensive in a way every leader has felt. And "the tools that let the team sleep" is a legitimate line in a case for spend. Do not lead with it; on its own it sounds like personal comfort. Put it after the four business outcomes, where it reads as retention.
Answering "what happened?" with a graph rather than a shrug is the difference between an IT team the business trusts and one it tolerates. Nobody budgets for trust. Everybody notices when it is missing.
The insurance analogy, and where it breaks
The usual analogy for monitoring spend is insurance. You pay every year. Most years nothing happens. And in the one year something does you are glad you paid. It is a good analogy for one purpose, which is explaining why a quiet year is not wasted money. Use it once, for that purpose, and then put it away.
The analogy breaks because monitoring also pays out on good days, and insurance does not. Insurance does nothing until the fire. Monitoring caught the disk at eighty per cent in a month with no outages. It produced the graph that got the link upgrade approved. And it supplied the availability figure for the quarterly report. Those are payouts. They happened on the good days. And if you sell monitoring as insurance you have taught your leader to expect nothing from it until a disaster. That is precisely the year they will cut it.
The better framing is a service the team uses every week, one feature of which is that it is also there for the fire. The evidence for the weekly use is in your logs, and the next section turns it into words.
The translation table
A translation table is a three-column list that turns each technical benefit into what the business gets and how you would prove it. The second column is what the leader hears; the third is what stops it being an opinion. Fill it from your own monitoring: the alert log, the availability report, the capacity graphs, and the ticket system if you have one.
| Technical benefit | What the business gets | How you would show it with data |
|---|---|---|
| Alert fires within one polling interval of a fault | Outages end sooner; fewer people idle for less time | Minutes from alert to first user ticket, per incident, from the alert log and ticket system |
| Alert names the device and the metric that changed | Repairs start with facts; less time spent searching | Incidents this quarter where the alert text matched the eventual cause, counted |
| Thresholds on disk, link, and certificate trends | Upgrades bought on normal lead time, not as emergencies | List of capacity catches with the date caught and the projected date of failure |
| Latency and interface history for the provider link | Service credits claimed; disputes settled with a graph | Outage evidence file entries with provider ticket numbers and credit outcomes |
| Availability report per service | Audit questions answered in minutes, not days | Report export with maintenance windows marked, and the date the auditor accepted it |
| Alert log with timestamps | Post-incident reviews produce fixes, not arguments | Review timelines built from the log, with action items closed |
| Dependency-aware alert rules | On-call staff are woken once, for the real fault | Alerts per incident, before and after dependency rules were set |
Two rules for filling it in. First, every entry in the third column must name a source you can open in the meeting, not one you "could look at". Second, leave out any row you cannot evidence this year; five proven rows beat nine hopeful ones. Every claim in column two has a receipt in column three. And a leader who checks one receipt and finds it real will usually stop checking.
The third column is easier to produce than it looks if your monitoring database can be queried. That includes SQLite for small installs, MySQL or MariaDB or SQL Server for larger ones. Table and column names differ between products, so treat this as the shape of the query and check the documentation for yours:
-- Minutes between the alert firing and the first user-raised ticket,
-- per incident this quarter. Negative means the users beat the alert.
SELECT i.incident_id,
       a.fired_at                                        AS alert_time,
       t.opened_at                                       AS first_ticket_time,
       (JULIANDAY(t.opened_at) - JULIANDAY(a.fired_at)) * 1440 AS lead_minutes
FROM incidents i
JOIN alerts  a ON a.incident_id = i.incident_id
JOIN tickets t ON t.incident_id = i.incident_id
WHERE i.opened_at >= DATE('now', '-3 months')
ORDER BY lead_minutes DESC;
A positive number in the last column is minutes of outage the users did not have to report. That is the raw material for the arithmetic in the next guide. A negative number is an incident where the users beat the alert. Keep those rows too. They tell you where the coverage gap is, and the leader will find them anyway; better that you found them first.
Saying it out loud
The sentences matter as much as the table, because leaders remember the sentence and not the row. Say the outcome first and the mechanism second. "Outages were shorter this year because we knew about them before the users did" lands. "Our polling interval is sixty seconds" does not, even though it is the same fact. Practise the four sentences until you can say them without notes; the moment to say them is usually a corridor, not a meeting.
Attach one number to each sentence, from your own records, and no more than one. "Outages were shorter" becomes "we found eleven of this year's fourteen faults before anyone reported them". "We replace things on our schedule" becomes "three disks and one uplink upgraded before they failed". Two numbers, and the leader starts adding them up instead of listening.
Never use an industry figure for what a minute of downtime costs. If a leader asks what the outages would have cost, the honest answer comes from your own organisation's numbers. And the guide on framing findings as risk and cost shows how to build that figure from staff numbers and loaded hourly costs without inventing anything. The full structure of a budget request, from evidence through options to a decision, is in building a budget case. This pillar is about the content of the case for monitoring itself. That case is harder than most because the thing you are buying is a shorter bar on a chart nobody will ever see.
A war story
Northgate Retail ran what I think of as a control year and an experiment year. In the first, the monitoring licence had lapsed during a reorganisation and nobody had noticed, because the good days looked the same. That year the warehouse wireless controller failed on a Saturday and was found on Monday by a forklift driver. The finance database's disk filled during month-end close. And the provider disputed a six-hour outage for which the only evidence was an email thread beginning "is it just me?". The year-end review described the network as "reliable apart from the incidents".
In the second year, with the licence restored, the same controller failed again, on a Sunday this time, because hardware has a sense of occasion. The alert reached the on-call phone at 06:40, the spare was in place by 08:15, and the first shift never knew. The finance disk was caught at eighty-two per cent in a routine Tuesday review and extended on an ordinary purchase order. The provider's line dropped twice, both times the latency graph went to them with the ticket, and both times a credit came back. Nothing about the network had improved. The organisation simply knew what it was doing.
The "what it buys" checklist
Use this before any conversation about the monitoring line. Every item is a yes or no, and every yes should have evidence you can produce from your own system.
- You have stated, in writing, what monitoring does not do, and the known gaps in coverage.
- You can say the four plain sentences (detection, repair, surprises, evidence) without notes.
- Each sentence has one number attached, from your own records, with a source you can open.
- The translation table is filled in with only the rows you can evidence this year.
- The insurance analogy appears once, to explain a quiet year, and nowhere else.
- The benefits to the team (sleep, trust, retention) come after the business outcomes.
- No industry statistic or vendor figure appears anywhere in the case.
- The incidents where users beat the alert are listed, with what you will do about each.
- You have one before-and-after story ready, with a timestamp and a ticket number.
Where to go next
Monitoring looks like it did nothing on a good day. The whole case for the spend is showing that it did four things while looking like that. It found faults first, shortened repairs, caught the slow failures early, and kept the record. Say the limits before anyone asks, say the four outcomes in the business's words, and attach one real number to each. The rest is receipts.
The next guide, downtime math and the monitoring dividend, turns the translation table's third column into minutes and money from your own incident log. Before-and-after stories covers the human version of the same evidence. And the monitoring budget line shows how to state the full cost you are asking leadership to approve. And when leadership says no is for the year the answer is not yes. All of them are part of Justifying Monitoring Spend to Leadership.
Put this into practice with SysPeep Monitor
The receipts in this guide come from one place: the alert log, the availability report, and the capacity graphs. SysPeep Monitor keeps them alongside its dashboards and reports in a single web console. So the evidence for the budget line is a screen you can open in the meeting. The free trial at /download/ installs on one Windows machine if you want to fill in the translation table against your own network first.
Download Free TrialLearn About SysPeep - All Rights Reserved.