
Building a Budget Case From Monitoring Data
You know the core switch needs replacing. The error counters have been climbing for eight months, it has rebooted twice, and the vendor stopped supporting it a while ago. You put "core switch replacement" and a figure on the budget request form. Finance asked one question, "what happens if we don't?", and the honest answer, "it might fail," was not enough. Request declined. The switch has not read the decision.
A budget case is not a description of a problem with a price attached. It is an argument, with a shape, that leads a person who signs from what the monitoring shows to a decision they can make and defend. Most cases that fail have the right problem and the right fix. They fail because the evidence is not on the page and the consequence is not stated. They also fail because "do nothing" is not costed and there is no date by which anything has to happen.
This guide gives you the shape. You will learn the five parts of an ask and the order they go in. You will learn which monitoring evidence carries weight and how to present it. You will learn why "do nothing" has to be an honest option. You will also learn how to cost options without inventing numbers, and what to do when the answer is no. There is an options table and a one-page budget case template to copy.
In this guide
- The shape of an ask
- Evidence from monitoring
- Why "do nothing" must be an honest option
- Three options, each with a cost and a consequence
- Costing an option without inventing numbers
- The options table template
- The one-page budget case template
- When the answer is no
- A war story
- The budget case checklist
- Where to go next
The shape of an ask
An ask has five parts in a fixed order. First are the problem shown in evidence and the consequence if nothing is done. Next are the options with their costs and consequences, and the recommendation. Last is the decision needed and by when. The order matters because each part answers the question the reader has after the one before it. Evidence answers "is this real?" Consequence answers "so what?" Options answer "what could we do?" The recommendation answers "what do you think?" and the decision line answers "what do you need from me?"
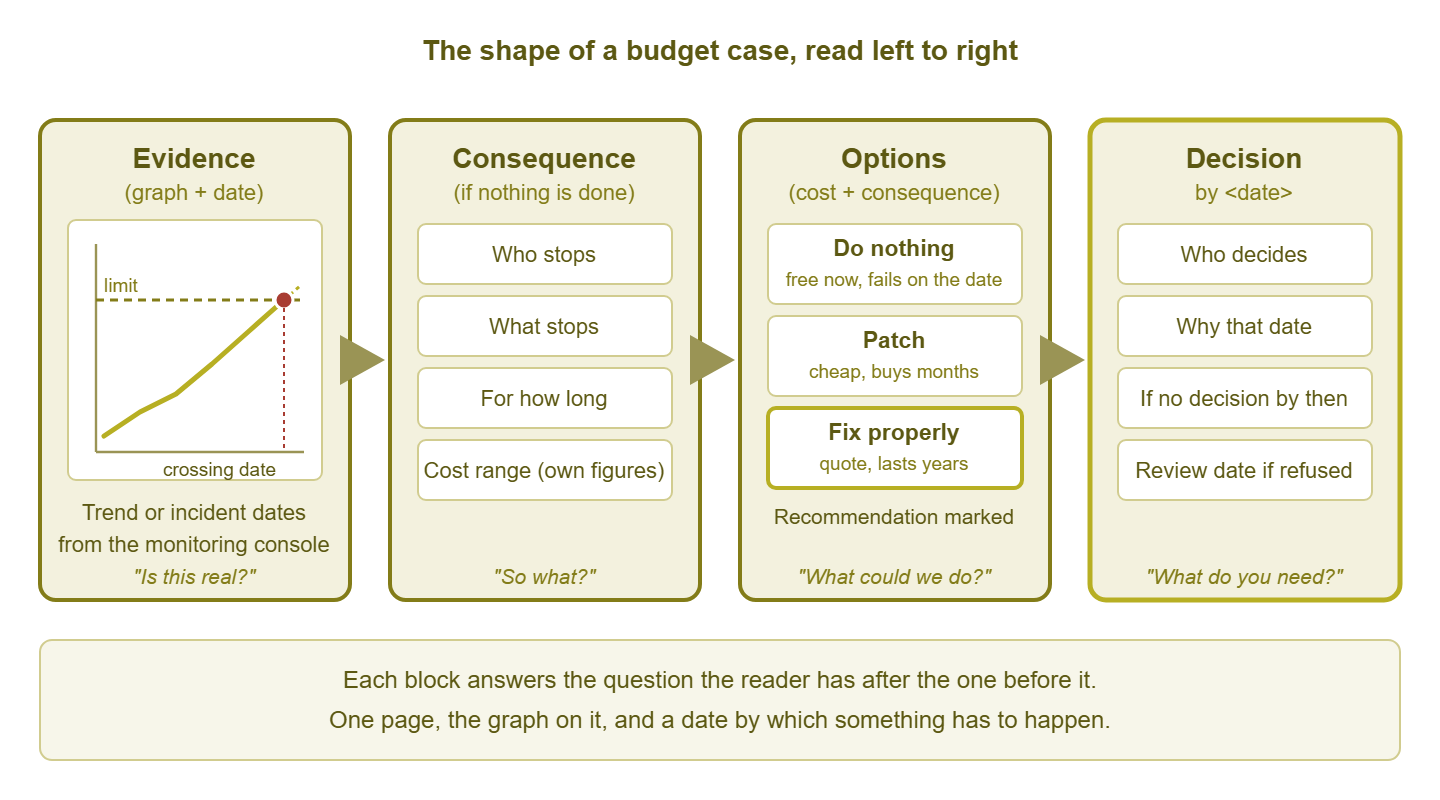
Figure 1: The shape of a budget case. Each block answers the question the reader has after the one before it. The whole thing fits on one page with the graph on it.
The evidence comes first because a reader who doubts the problem will not read the rest. It is a graph with a date on it. And Speaking Business, Not Packets is how you write the sentence above the graph. The consequence comes second because a reader who accepts the problem still needs to know why it is theirs. Options come third, because a single proposal is a demand and three is a choice, and people sign choices. The recommendation is where you commit. The decision line is where you tell them the clock is running.
Keep the case to a page, with the graph on it. Anything longer goes in an appendix that you offer and they decline. (They will decline. That is what appendices are for.) The Monthly One-Pager is the same discipline applied to a month; the budget case is the same discipline applied to one decision.
Evidence from monitoring
The strongest evidence is the kind you can put a date on, and monitoring data is nothing but dated evidence. Four kinds carry weight with a person who signs, and each comes from a report you already have.
A trend graph with a projection
A trend graph shows a line heading for a limit, with the limit drawn on and the crossing date marked. Disk use, link utilisation at peak, error counts, the number of devices on a switch that is running out of ports. The date is the persuasive part, because a date turns "eventually" into "before the summer," and the reader can put it beside the budget cycle. Draw the line through at least a year so that a quiet quarter does not flatter it, and write "at the current rate" beside the date.
Fit the line in a spreadsheet rather than by eye, so the date is one you can defend. With dates in column A and the measured value in column B, two functions give you the growth rate and the crossing date:
growth per day   =SLOPE(B2:B366, A2:A366)

crossing date    =(LIMIT - INTERCEPT(B2:B366, A2:A366))
                  / SLOPE(B2:B366, A2:A366)

A2:A366   a year of dates
B2:B366   the value on each date (GB used, peak percent,
          errors per day)
LIMIT     the number you call full: the volume size, 85 percent
          of the link, the port count

Format the crossing-date cell as a date.
The formula fits a straight line, and growth is not always straight; a business that doubles a team grows in steps. Check the fitted line against the graph before you quote the date. If they disagree, the graph is right and the date needs a wider range: "between March and June at the current rate."
Incident history
Incident history is a list of dates on which the thing failed, with how long it was down and who was affected. It comes from the alert history and the availability report. It is the "has happened" likelihood from Framing Monitoring Findings as Risk and Cost. Three dated outages beat any projection, because they are not a forecast. Put them in a short table with the duration and the impact in the organisation's own units: "the depot stopped shipping for 2 hours 50 minutes."
Capacity approaching full
Capacity approaching full is a single number against a limit: 92 percent of the disk, 46 of 48 ports, 18 of 20 minutes of battery. It is a fuel gauge, and it needs no arithmetic, only the limit stated in words: "when it reaches the limit, people cannot save files." The guide to utilisation to purchase timing covers the lead-time arithmetic for a link upgrade, which is the part most cases underestimate. The order takes longer than the graph.
Time lost
Time lost is the evidence a finance director understands without translation: hours of staff time spent waiting, retrying, or working around the problem. It is the hardest to get from monitoring alone, so build it from monitoring plus one honest input. Take the hours above the limit from the graph, times the number of people affected. Multiply by a fraction the team leader gives you for how much of that time was actually lost. Label the fraction as theirs. A number with a named source survives a meeting; a number without one does not.
Tip: keep the graph running after the case goes in. It will be read in three weeks, and the reader will ask "is it still doing that?" A graph that has moved in the direction you predicted since the case was written is the strongest evidence you will ever have. It costs nothing.
Why "do nothing" must be an honest option
"Do nothing" is always an option, and the case has to cost it honestly. That is because it is the option the reader will choose if you do not. It is free this quarter, and finance directors are paid to notice things that are free this quarter. If you present it as unthinkable, you have left the reader to work out its cost alone. In that case, they will work it out as zero.
Costing "do nothing" means stating what happens, when, and what it costs when it does. The disk fills in eleven weeks. When it does, nobody can save files until IT clears space. Clearing space took about four hours each of the last two times, with the office idle. The switch fails at an unknown date. When it does, the depot stops for as long as it takes to get a replacement. That is two days on standard delivery or one on expedited, at the higher price. That is the price of doing nothing, and once it is on the page beside the others it is rarely the cheapest.
Sometimes "do nothing" wins, and you should say so. If the projection says the disk fills in two years and the volume is due for replacement in eighteen months, doing nothing is the right call. In that case, writing that down buys you credibility for the next case. A person who has watched you recommend nothing believes you when you recommend something. The guide to where spending actually helps is a good check on whether the thing you are asking for is where the money should go at all.
Three options, each with a cost and a consequence
Three options is the right number: do nothing, patch, and fix properly. Two is an ultimatum. Four is a menu, and menus get sent back with a request for a recommendation. Each option gets the same three lines: what it costs now, what it buys, and how long it lasts. The reader compares like with like, and the decision becomes arithmetic.
"Patch" is the cheap thing that buys time. Archive old data instead of buying disk. Move the busiest server to a different switch instead of replacing the core. Slow the overnight backup instead of upgrading the link. A patch is honest when you say how long it buys and what it costs in your hours, and dishonest when it is presented as a fix. Most patches buy somewhere between a quarter and a year, and the case should say which.
"Fix properly" is the thing that removes the problem for the life of the equipment. It usually costs most now and least over time, and the case makes that visible by putting "how long it lasts" beside the price. A fix that costs three times the patch and lasts six times as long is the cheaper option. The table is where a reader sees that without being told.
Costing an option without inventing numbers
Every cost in the case comes from someone who can be asked about it. The purchase price comes from a quote through procurement, not from a website. That is because the quote is the number that will appear on the purchase order. A case built on a different number gets rebuilt. Your own effort is in hours, with the rate left to finance: "about twelve hours of IT time to install and test." Running costs come from the vendor's quote or the current bill.
What you do not know, you say you do not know. "Electrical work required; quote requested from facilities, expected next week" is a stronger line than a guess. It tells the reader the case is honest where it is incomplete. A case with one invented number is a case with one number the reader will find, and having found it, they will look for another.
The recurring costs belong on the page beside the one-off ones. A patch that needs four hours of your time every month is not free. A cheap switch with no support contract has a price that arrives later. The guide to the hidden costs of cheap lists the usual places it hides. Put "recurring" next to "now" and "how long it lasts" next to both, and the cheap option stops looking cheap on its own.
The options table template
The table is the heart of the case and the part the reader will actually study. One row per option, the same columns for each, and the recommendation marked. The entries shown are the shape; replace them with your own figures.
| Option | Cost now | Recurring cost | What it buys | How long it lasts | What happens when it runs out | Recommended |
|---|---|---|---|---|---|---|
| 1. Do nothing | None | None | Nothing | Until the crossing date from the graph | Outage: who stops, for how long, cost range | No |
| 2. Patch: (describe) | IT hours | IT hours per month | Time | Months (state how many) | The same outage, later | No |
| 3. Fix properly: (describe) | Quote attached | Support contract, if any | Removes the problem | Life of the equipment (years) | Covered by support or a spare | Yes |
Read across the rows and the argument makes itself. Doing nothing costs nothing now and an outage later. Patching costs hours now and the same outage later. Fixing costs a quote now and removes the outage. A reader who can see all three at once does not need to be persuaded; they need to be given the pen.
The one-page budget case template
The whole case fits on the page below, with the graph attached and referenced. Keep the headings, fill the blanks, and resist adding a section. If it will not fit, the case has two problems in it, and two problems are two cases.
BUDGET CASE                                Date: ________   From: ________

THE PROBLEM, IN ONE SENTENCE
   ______________________________________________________________

EVIDENCE (graph attached, dated)
   What the monitoring shows: ____________________________________
   Since when: ________
   At the current rate, the limit is reached: ________
   Has it happened already? Dates and durations: _________________

CONSEQUENCE IF NOTHING IS DONE
   Who stops: ______________     What stops: ______________
   For how long: ______________
   Cost range (own figures, inputs attached): ________ to ________

OPTIONS (table attached)
   1. Do nothing     cost now: ______   lasts until: ______
   2. Patch: ______  cost now: ______   lasts: ______
   3. Fix: ________  cost now: ______   lasts: ______

RECOMMENDATION
   Option ___ because ____________________________________________

DECISION NEEDED
   From: ________     By: ________
   Why that date: ________________________________________________
   If no decision by then: _______________________________________

Attachments: trend graph (dated), incident list, quotes, cost inputs.
The "why that date" line is the one people leave blank. It is the one that gets the case read this month rather than next. "Because the scanner project starts in the autumn and the link must be in before it" is a reason. "Because the lead time on the switch is six weeks and the busy season starts in twelve" is a reason. A date without a reason is a preference, and preferences go to the bottom of the pile.
When the answer is no
Sometimes the answer is no, and what you do next decides whether the next case is easier or harder. First, find out which "no" it is. "No, not this budget cycle" is a date. "No, not at that price" is a specification. "No, I do not believe the problem" is a request for better evidence. Ask, politely, which one you have, because they need three different responses and only one of them is "come back with more."
Document the decision. Who decided, when, what they saw, and what they said. One paragraph, in the same folder as the case. This is not for blame. It is so that when the thing fails, the conversation is "here is the case from March, updated" rather than an argument about who knew what. A dated "no" is part of the evidence for the next "yes."
Set a review date and put it in the calendar, on the decider's calendar if you can. "We agreed to look again in the autumn, or sooner if it fails" turns a refusal into a postponement, and a postponement has a date attached. Most refused cases are eventually approved, and the ones approved fastest are the ones that came back on the day they said they would.
Keep the graph. The line does not stop because the budget did. The graph with the refusal date marked on it is the most persuasive slide you will ever show, provided you show it without satisfaction. "This is where we were in March; this is where we are now; the crossing date has moved from June to May" is a sentence that gets money. "I told you so" is a sentence that gets remembered, and not in the way you want.
A war story
The administrator at Acme Engineering submitted a budget request for a replacement core switch. The request consisted of the words "core switch replacement, end of support" and a price from a reseller's website. The finance director asked what would happen if they did not replace it, was told "it might fail," and declined. That was because nothing was visibly broken and the price was not one procurement would have paid. The switch's error counters had been climbing in the monitoring console for eight months and it had rebooted twice, on dates the alert history recorded. None of that was on the form. The switch failed on a Monday morning in the busiest week of the quarter. The replacement came by expedited delivery at a premium with a weekend engineer to fit it. The depot lost most of a day. The review found that the original request had been "insufficiently evidenced," which was true. The review also found that the graph had been available the whole time, which was truer.
The same request could have included the error graph, the two reboot dates, a costed "do nothing," and a decision date before the busy quarter. With those, it would have been a page long and hard to refuse. Not impossible; finance directors refuse well-evidenced cases too. But a refused case with a graph in it becomes an approved case the day the graph moves. A refused case without one becomes a story.
The budget case checklist
Run the case through this list before it goes to anyone who signs.
- The problem is one sentence in business words, at the top of the page.
- The evidence is a dated graph or a dated list of incidents, attached and referenced.
- The trend line is fitted rather than eyeballed, drawn through at least a year, and the crossing date says "at the current rate."
- The consequence names who stops, what stops, for how long, and a cost range built from the organisation's own figures.
- "Do nothing" is an option with an honest cost and a date.
- There are three options, each with cost now, recurring cost, what it buys, and how long it lasts.
- Every price is a quote through procurement, every effort figure is in hours, and unknowns are named as unknown.
- The recommendation is stated, with its reason in one line.
- The decision line says who, by when, why that date, and what happens after it.
- The whole case fits on one page with the graph on it; everything else is an attachment.
- If refused, the decision is documented, a review date is set, and the graph keeps running.
Where to go next
The sentence at the top of the case is built the way Speaking Business, Not Packets builds it. The consequence section is a risk statement from Framing Monitoring Findings as Risk and Cost with the arithmetic shown. Box four of The Monthly One-Pager is where a case is first mentioned. And Presenting Monitoring Data in a Meeting is the five-slide form for the day you present it. All of them live under Translating Monitoring Data for Management.
Put this into practice with SysPeep Monitor
The graph at the top of the case is the one the monitoring has been drawing all along. SysPeep Monitor keeps trend history, alert history, and reports in one web console over what it collects by SNMP, WMI, and SSH. Scheduled email reports keep the evidence arriving while the case waits for a decision. Check the product documentation for the report types available. The free trial installs on any Windows machine in minutes.
Download Free TrialLearn About SysPeep - All Rights Reserved.