
From Utilization Graphs to Purchase Timing
Most IT problems ambush you. A disk dies, a certificate expires, a switch decides today is the day. Bandwidth exhaustion is the polite exception: it announces itself months in advance, in writing, on a graph anyone can read. The link that will be painfully full next summer is visibly filling right now, at a measurable rate. And yet capacity upgrades still happen the panicked way — after weeks of complaints, ordered as an emergency, delivered on the ISP's schedule while everyone suffers.
The difference between those two worlds is not fancy forecasting software. It is one number recorded monthly, subtraction, division, and an honest look at how long an upgrade actually takes to arrive. This guide walks you through the whole path. It covers which number to track, the straight-line math that turns it into a date, and how to pick the trigger threshold. It also covers how to plan backward through the lead time, and how to present the result so a non-technical decision maker approves it. A worked example runs through every step. By the end, "the link keeps hitting 80%" becomes "we order in month 9, and here is why."
In this guide
- The most predictable problem in IT
- The one number to track each month
- The straight-line method: all the math you need
- Choosing the trigger threshold
- Lead time: why the order date is earlier than you think
- One bad week is not a trend
- The one-page pitch to a decision maker
- Worked mini-case: from graph to approved order
The most predictable problem in IT
Why does bandwidth grow so steadily? The causes are structural, not accidental. They include a few more employees, one more cloud application, and meetings that used to be phone calls becoming video. They also include files and web pages quietly getting heavier every year. None of these arrive as an event. They arrive as a slope — and a slope is exactly the thing a monthly measurement catches.
The failure mode is just as structural. Nobody owns "watching the trend," so the first official notice of a capacity problem is human: complaints, sluggish calls, a bad demo in the boardroom. By then the fix is urgent, and urgency is expensive in every currency. You accept the first quote, you skip the option analysis, and you wait out the delivery period under fire. The entire practice in this guide exists to move the conversation from that moment back to a calm Tuesday months earlier.
The one number to track each month
Trend math needs a consistent input: one value per link per month, produced the same way every time. Choosing it well matters more than any later step, because two of the obvious candidates lie to you.
The monthly average lies low. It blends 128 quiet nighttime and weekend hours into every busy week, so a link that crawls every afternoon can still average a serene 30%. Nobody experiences the average; your users live in the busy hour.
The absolute peak lies high. The single highest sample of the month is usually one burst — a big download filling the link for a minute, which is normal and harmless. Order circuits on peaks and you will buy capacity for accidents.
The value that behaves is the 95th percentile. Take the month's utilization samples, sort them, discard the top 5%, and read the highest value that remains. In plain words, "the level the link is at or below 95% of the time" — high enough to represent real busy-hour pressure, immune to one-off bursts. It is the same measure many ISPs bill on, which is a happy coincidence: the 95th percentile explained covers the mechanics and the fine print. Most monitoring tools can report it per interface per month. If yours cannot, the peak of the average business day is a workable substitute. Just pick one definition and never change it mid-series.
Record it in the world's least glamorous capacity-planning system: a table with one row per month. Track your internet link and any uplink you worry about. And record both directions — download and upload trend independently, and on business circuits the upload is often the first to run out.
Tip: tie the recording to a recurring calendar slot — first Friday of the month, five minutes, copy two numbers per link into the table. If you already run a monthly bandwidth review, it is the same five minutes. The log is the whole system, and it only works if the rows keep appearing.
The straight-line method: all the math you need
Suppose your internet circuit is rated 200 megabits per second, and eight months of the download log look like this:
| Month | 95th percentile (Mbit/s) | % of 200 Mbit/s |
|---|---|---|
| 1 | 116 | 58% |
| 2 | 122 | 61% |
| 3 | 124 | 62% |
| 4 | 126 | 63% |
| 5 | 132 | 66% |
| 6 | 136 | 68% |
| 7 | 140 | 70% |
| 8 | 144 | 72% |
Three lines of arithmetic turn that table into a forecast:
growth per month  = (newest - oldest) / (months between them)
                  = (144 - 116) / 7          =  4 Mbit/s per month

months to go      = (threshold - newest) / growth per month
                  = (160 - 144) / 4          =  4 months  (crosses in month 12)

order-by month    = crossing month - lead time
                  = month 12 - 3 months      =  month 9
That is the entire method: subtract, divide, subtract again. The 160 in the middle is the trigger threshold (80% of 200 — chosen in the next section). And the 3-month lead time comes from the section after that. No regression, no statistics package, nothing a decision maker cannot re-check on a sticky note — which is precisely why it is persuasive.
Two sanity checks keep the simple math honest. First, look at the middle of the table, not just the ends. The endpoints define the line, so confirm the in-between months rise at roughly the same rhythm. If the last three months are climbing noticeably faster than the first three, growth is accelerating and your straight line is optimistic. In that case, recompute using only the recent half, and trust whichever estimate says sooner. Second, projections expire. Redo the arithmetic each month when the new row lands; the forecast is a living number that firms up as the crossing approaches.
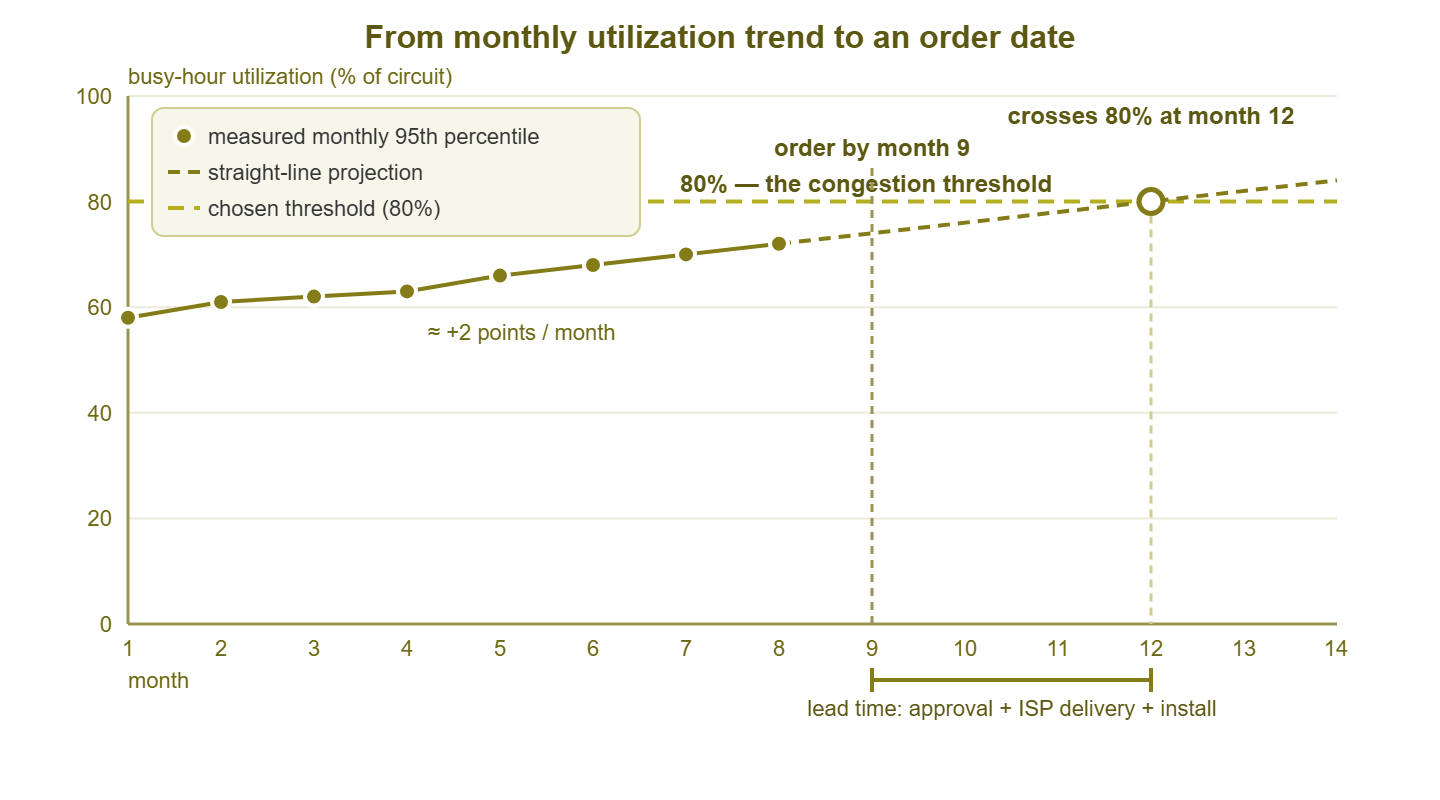
Figure 1: The whole method on one chart — measured monthly dots, a straight-line projection, the chosen threshold, and the order date placed one lead time before the projected crossing.
Warning: straight lines only survive in a stable business. A new office, a VoIP rollout, a migration to cloud file storage, twenty new hires — each is a step change that breaks the old trend. When one happens (or is announced), start a fresh baseline from that point and let a few months accumulate before projecting again. And fold known plans into the forecast by hand, because the graph cannot see the sales team doubling next quarter, but you can.
Choosing the trigger threshold
Why 80% and not 100%? Because links hurt long before they are technically full. As the busy-hour level climbs, traffic bursts increasingly collide with a link that has no headroom. Packets queue up behind each other, and delay and jitter rise — first intermittently, then chronically. Video and voice degrade first, cloud apps feel sticky next, and by the time the graph touches its ceiling users have been complaining for months. The mechanics of queuing, and why short bursts make a "60% average" link feel saturated, are the subject of how full is too full. Here, the practical takeaway is that every link has a pain point below 100%. And your trigger threshold is that pain point.
A reasonable starting rule for an internet circuit: treat a sustained busy-hour 95th percentile around 70–80% as the pain point. Aim toward 70% if the link carries a lot of real-time traffic (voice, video, remote desktops). Aim toward 80% if the traffic is mostly bulk and browsing and users are tolerant. Tune the threshold with evidence from your own network. If complaint tickets and choppy-call reports already cluster in the months where the log reads 75%, congratulations, you have measured your own pain point. No industry rule of thumb outranks that measured point.
Write the chosen trigger into the log's header as a sentence — "order the upgrade when the trend says download 95th percentile will cross 80% within one lead time". That way, the decision is pre-made. When the condition fires, you execute a plan instead of opening a debate.
Lead time: why the order date is earlier than you think
Here is the step that turns good analysis into on-time capacity: an upgrade is not delivered when you decide to buy it. Between "we should upgrade" and "users are on the new circuit" sit several queues, and only the first one is yours:
| Stage | What happens | What tends to stretch it |
|---|---|---|
| Internal approval | Budget request, sign-off, possibly a committee | Budget cycles — miss the window and wait for the next one |
| Quotes & contract | Options from the ISP (or several), legal review, signing | Multi-vendor comparison; contract-term negotiation |
| ISP delivery | The provider provisions the service | A speed bump on an existing fiber can be quick; new fiber, construction, or permits can take months — ask early, in writing |
| Install & cutover | New hardware or handoff, a maintenance window, testing | Edge firewall that cannot pass the new rate; scheduling the window |
Ask your ISP for a delivery estimate for the specific upgrade path before you need it. It is a free question, and the answer is the biggest variable in the whole plan. Then add your own approval and install stages and call the total your lead time. For many organizations the honest total lands around three to six months. Yours may be shorter or longer, but it should be a number you looked up rather than a hope. Then plan backward: order-by date = projected pain date − lead time. That subtraction is the entire point of this article. The trend gives you the pain date; the lead time converts it into the last responsible moment to start the paperwork. And a projection that says the crossing is five months away while your lead time is four is not "a future problem." It is this month's task with a one-month safety margin.
While the order works its way through the queues, you are not helpless on the hot link. Trimming waste and shaping what remains can buy back months of headroom. The guides finding bandwidth waste and upgrade or shape are the companion guides for exactly that.
One bad week is not a trend
The opposite failure of the too-late upgrade is the panic buy. After one awful week — the link pinned, calls dropping, executives cc'ing each other — suddenly there is appetite to sign anything. Sometimes the awful week really is the trend arriving early. But often it is an incident wearing the trend's clothes: a runaway backup, an update storm, a compromised host, a one-off event that will never recur. Buying a bigger circuit to contain a misbehaving backup job is how networks end up overprovisioned and still broken. The job misbehaves on the new circuit too.
The monthly log is your panic filter. Before endorsing an emergency purchase, check three things. Does the 95th percentile for the month confirm sustained pressure, or did one bad stretch barely move it? (A true trend shows up there; a two-day incident mostly does not — the percentile guide shows why.) Does the bad week have an identifiable cause with a cheaper fix — a job to reschedule, a device to cap, a host to clean? And does the trend line, with the incident excluded, still cross your threshold on roughly the same date as before? If the answers are "barely moved," "yes," and "no," then what you had was a fire, not growth. In that case, put it out, credit the monitoring, and keep the original order date. Distinguishing sustained saturation from spiky incidents is exactly the skill how full is too full teaches.
The one-page pitch to a decision maker
Your projection now needs money attached, which means persuading someone who does not read utilization graphs for a living. The good news: a trend-based capacity request is the easiest pitch in IT, because it is a prediction with receipts. Keep it to one page, structured like this:
- One chart. The monthly dots, the projection, the threshold — essentially Figure 1 with your numbers. One picture of dots marching toward a line needs no translation.
- One sentence of meaning. "At the current growth rate, our internet connection reaches the congestion point in about four months; delivery of an upgrade takes about three."
- The cost of waiting, in business terms. Describe symptoms, not megabits: customer calls that stutter and cloud apps that crawl every afternoon. Include video meetings that fail during the busiest (most billable) hours, and an IT team firefighting instead of working. Congestion arrives as a productivity tax on the whole company; say so plainly and skip the invented dollar figures. A specific, checkable claim beats a dramatic one.
- Two options with real quotes. A recommended option and a credible alternative — typically the straightforward capacity upgrade versus a smaller step combined with traffic shaping (the tradeoffs live in upgrade or shape). Attach the ISP's actual prices; two options show judgment, five show homework avoidance.
- The order-by date, and what slipping costs. "Approve by the end of the month and users never notice; approve two months late and we spend those months over the threshold". The deadline is the ISP's lead time, not your impatience, and saying so removes the suspicion of urgency theater.
Bring the raw log as backup, not as the opener. And afterward, whatever was decided, keep logging. A decision maker who deferred once will meet the same chart next quarter with three more dots on it, exactly where the line said they would be. Few things build credibility like a prediction that came true on schedule.
Worked mini-case: from graph to approved order
Putting every step together, here is the whole arc as it plays out on the 200-megabit circuit from the table above.
Months 1–7: the admin logs the 95th percentile on the first Friday of each month. In month 5 there is a scare: the link pins for two days and complaints spike. The flow data traces it to a backup job that lost its rate cap in an upgrade. The cap is restored, the monthly value barely moves, and no one panic-buys anything. The incident goes in the log as a footnote — and as quiet proof the filter works.
Month 8: the newest value is 144 Mbit/s — 72%. The arithmetic says: growth 4 Mbit/s per month, threshold 160 Mbit/s (80%), crossing in month 12. The ISP, asked back in month 6, quoted roughly eight weeks to deliver the upgrade on existing fiber. With internal approval and an install window, the admin budgets three months of lead time. Order-by: month 9. The trigger sentence in the log fires.
Month 9, week 1: the one-pager goes to the operations director. It includes the chart, the sentence "we cross the congestion line in month 12; delivery takes about three months," and the symptoms of waiting. It also includes two quoted options: the recommended step up to the next circuit tier, and a cheaper half-measure pairing a smaller bump with traffic shaping. The recommendation is honest about the alternative: shaping buys time but adds ongoing tuning, and the trend says the time it buys is short.
Month 9, week 2: one clarifying question comes back: "why can't we just block video?" It is answered with the streaming-policy tradeoffs. The answer also notes that the biggest growth is the CRM and video meetings, which are the business. Approved. The order is signed before the month ends.
Month 11: the circuit is delivered — a week late, absorbed by the safety margin. The admin validates the new rate with a proper throughput test before cutover (circuit throughput testing is the methodology). The admin then moves traffic in a scheduled window.
Month 12: the old trend line crosses 80% on schedule — harmlessly, because the denominator changed. The log continues uninterrupted on the new circuit, where the same traffic now reads comfortably low. The next projection says the successor upgrade is years out. Users noticed nothing, which is the entire victory: the best capacity upgrade is the one nobody experiences.
Where to go next
The whole discipline takes five moves. Log one honest number per link per month, and project it with subtraction and division. Pre-commit a trigger threshold below the pain. Subtract the real lead time to get the order date, and pitch it on one page with the chart doing the talking. It is fifteen minutes of bookkeeping a month in exchange for never meeting a bandwidth emergency again — a trade every admin should take.
To round out the skill set, read the 95th percentile explained for the measure this method rides on. Read how full is too full for choosing the threshold with confidence. Read upgrade or shape for building the options page of the pitch. The full series lives at Bandwidth & Utilization Monitoring.
Put this into practice with SysPeep Monitor
The monthly log at the heart of this method needs a monitoring system that keeps history. SysPeep Monitor discovers your devices and records interface utilization over SNMP. It turns that data into the graphs and reports your trend table — and your one-page pitch — are built from. It also provides threshold alerts for the month the line gets crossed. The free trial installs on a single Windows machine.
Download Free TrialLearn About SysPeep - All Rights Reserved.