
A Field Guide to Monitoring Anti-Patterns
Every monitoring system I have ever inherited had the same problems, and so did every one I built. The names were different. The devices were different. The mistakes were the same nine or ten, arriving in roughly the same order, each put there by a sensible person for a sensible reason. That is the uncomfortable thing about monitoring mistakes: almost none of them look like mistakes at the time.
An anti-pattern is the word for that kind of mistake, and this is a field guide to the ones that live in monitoring. It is organised the way a birdwatcher's book is: by family, then by specimen, with a description of what each looks like when you meet it. You will not need the anatomy of a wing. You will need to know what a stale threshold looks like from across the room.
By the end you will be able to say what an anti-pattern is and why monitoring grows so many. You will be able to name the five families and their commonest members, and spot each one in your own system with a single tell. You will also be able to run a self-audit that produces a short, honest list of which ones you have. The list is the point. Every team has some. The teams that do well know which.
In this guide
- What an anti-pattern is
- Why monitoring breeds them
- Family one: scope
- Family two: alerting
- Family three: visualisation
- Family four: upkeep
- Family five: process
- The self-audit table
- Fewer, not zero
- The audit that found eleven
- The field guide checklist
- Where to go next
What an anti-pattern is
An anti-pattern is a common solution that looks reasonable, is adopted for good reasons, and reliably makes things worse. All four parts matter. It is common, so you will meet it. It looks reasonable, so nobody objects when it arrives. It is adopted for good reasons, so the person who adopted it was not careless. And it reliably makes things worse, which is what separates it from a judgement call that happened not to work out.
The word comes from software design, where it was coined for the recurring bad shapes that programs fall into. But it fits monitoring better than most fields because monitoring mistakes are unusually repeatable. A pattern is a good shape that recurs. An anti-pattern is a bad shape that recurs just as reliably. Your monitoring system has a few of them right now. So does mine.
A mistake is a wrong threshold on one disk. An anti-pattern is the habit of setting every threshold to the same number because that is what the template does. The first is fixed in a minute. The second keeps producing the first until someone names it.
Naming is the whole game. Once a team can say "that is severity inflation" instead of "the alerts are a bit much", the thing has edges. It can be counted and assigned to someone. The monitoring myths guide covers the beliefs that lead people astray; this one covers the practices. Myths are what people think. Anti-patterns are what they do.
Why monitoring breeds them
Monitoring grows anti-patterns faster than most systems because of three properties of every monitoring tool ever built, and none of them is the tool's fault.
First, it is easy to add and hard to remove. Adding a check is a few clicks and feels like progress. Removing one requires you to be sure it is not needed, and nobody is ever sure. So checks, thresholds, alerts, dashboards, and notification recipients accumulate. Left alone, a monitoring system only ever grows.
Second, nobody is punished for too much. If you monitor a thing that did not need monitoring, nothing happens. If you fail to monitor a thing that then breaks, there is a meeting, and your name is in it. Every admin learns this asymmetry in their first year. The rational response to "you will be blamed for gaps and never for excess" is excess. That is not a character flaw. It is arithmetic.
Third, the cost lands somewhere else. The person who adds the four-hundredth alert does not carry the on-call phone. The person who sets a threshold and forgets it has moved on by the time it fires wrongly. Because the cost is displaced in time and in person, the feedback that would correct the mistake never reaches the one person who could.
Put those three together and you have a system that grows in one direction, rewards growth, and hides the bill. Anti-patterns are not what happens when monitoring goes wrong. They are what happens when it is left to go right on its own. (It will not.)
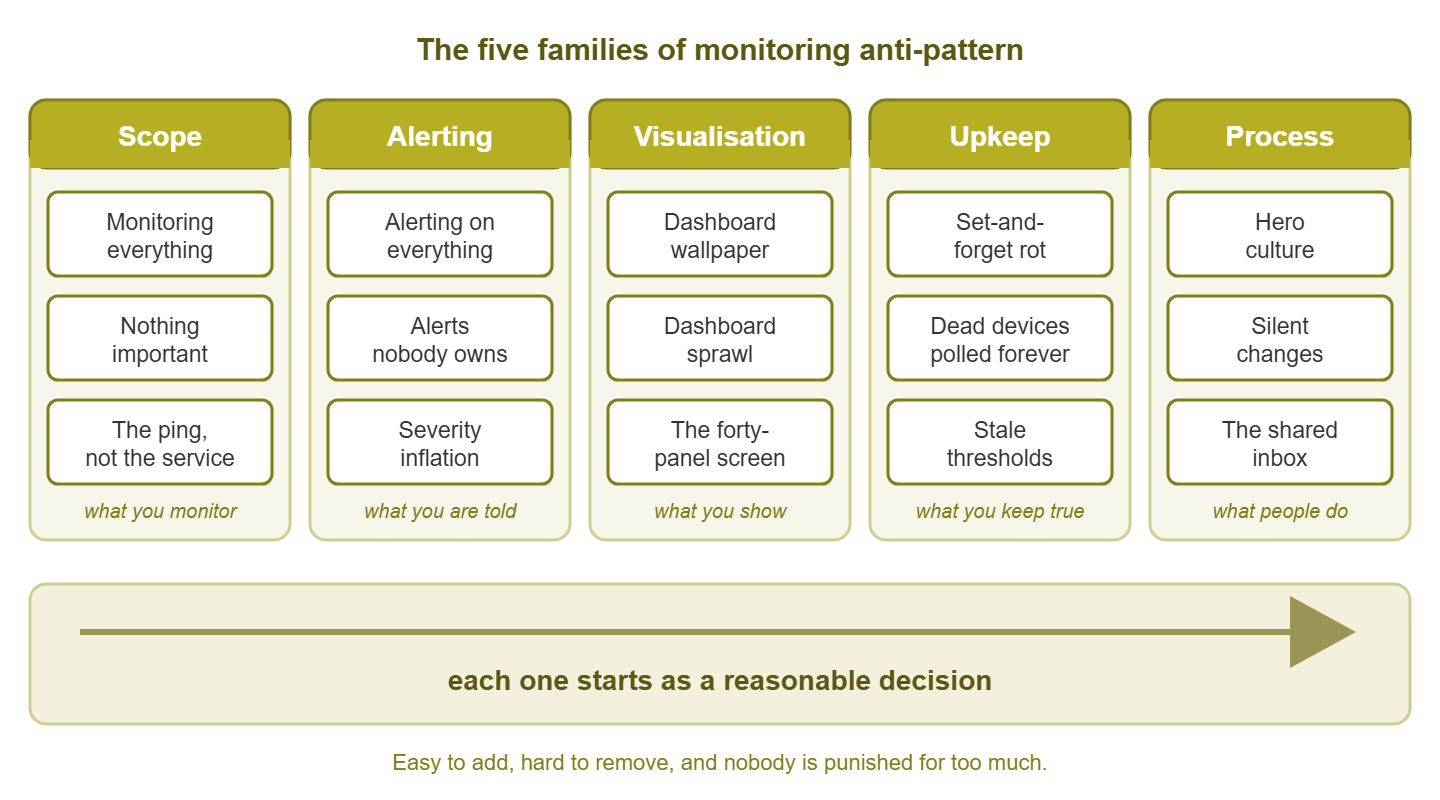
Figure 1: The five families of monitoring anti-pattern and their commonest specimens. Every tile began as a sensible choice.
I sort monitoring anti-patterns into five families. They are scope (what you monitor), alerting (what you are told about), and visualisation (what you show). Then come upkeep (what you keep true) and process (what the people do). Each specimen below has a one-line tell: the thing you can see or ask that confirms you have it. Tells are quicker than a review and harder to argue with.
Family one: scope
The scope family is about what gets monitored in the first place. And it has a specimen at each end of the scale and one in the middle.
Monitoring everything
Auto-discovery found four thousand things and the answer to each was "why not". Every interface, every counter, every virtual adapter, all polled, all stored, none of it chosen. The tell: you cannot say, without looking it up, roughly how many checks you have, and the number surprises you when you do. Monitoring everything is the first anti-pattern this pillar takes on in full; the anti-hoarding guide describes the collector's instinct behind it.
Monitoring nothing important
The opposite error, and it often coexists with the first, because monitoring everything is a reliable way to lose the important things among the rest. The switches are monitored in detail and the service the business actually sells is not. The tell: the last outage users reported was not on any dashboard when they reported it.
Monitoring the ping, not the service
The host answers ping, so the host is "up", while the application on it has been returning errors since lunch. The tell: your availability report says a service was up during an incident that everyone in the building remembers. Ping up versus service up covers the distinction in full; reachable is not the same as working.
Family two: alerting
The alerting family is about which conditions become interruptions, and it is the family most likely to be hurting someone tonight.
Alerting on everything
Every metric has a threshold, every threshold has a notification, and every notification goes to everyone. It arrives one alert at a time, each added after an incident, and none is ever removed. The tell: more alerts arrive in a week than anyone could read, so nobody does. Alerting on everything traces the road there and back; diagnosing alert fatigue covers the condition it produces in people.
Alerts nobody owns
The alert fires, arrives in a shared mailbox or a group chat, and every reader assumes another reader has it. The tell: ask who acts on one specific alert and get a team name rather than a person's.
Severity inflation
Every alert is marked critical, because whoever created it wanted it noticed and nobody wanted to argue that their thing was merely a warning. The tell: count your alert rules by severity; if more than half sit at the top level, the top level means nothing. Anatomy of a good alert explains what a severity is supposed to encode: what the reader does next, not how much the author cared.
The permanent amber
A warning condition that is real but not urgent, left in the warning state for months, teaching every eye that amber is a colour the screen simply is. The tell: an amber tile on the wall that nobody can date.
Family three: visualisation
The visualisation family is about what is shown on screens. The full treatment of each specimen lives in the dashboard pillars, so this section gives the tells and gets out of the way.
Wallpaper
A dashboard that is switched on but not read; nobody's behaviour changes because of anything it shows. The tell: a tile goes red and the first person to act does so because of an email. Dashboard wallpaper covers the drift and the rescue.
Sprawl
Nine dashboards, built by five people, showing overlapping slices of the same network, and nobody sure which is true. The tell: two screens disagree about one service and nobody knows which to believe. Dashboard sprawl is the portfolio version of the problem.
The forty-panel screen
One dashboard that tries to show everything, so that each panel is too small to read from anywhere a person stands. The tell: from the door, you can see that there are graphs, and nothing else. The dashboard design review redesigns exactly that screen. (It ends up with eleven panels. It always ends up with about eleven.)
Family four: upkeep
The upkeep family is about whether the monitoring still describes the network. These are the slowest to arrive and the hardest to notice, because a rotting monitoring system looks exactly like a healthy one until somebody checks.
Set-and-forget rot
The system was configured well, once, by someone who cared, and has not been revisited since. The network moved on; the monitoring did not. The tell: the person who set it up has left and nobody has changed anything substantial since. Set-and-forget rot is the full guide, with a maintenance calendar you can copy.
Dead devices polled forever
A device retired a year ago is still polled every minute, still fails, and still has its alert suppressed so that the failure bothers nobody. The tell: your "down" list has entries older than your newest colleague. Keeping inventory current is the upstream fix.
Stale thresholds
The disk warning was set at eighty per cent when the disk was small and the growth was gentle. Three upgrades later, eighty per cent is either far too early or far too late, and nobody has looked. The tell: nobody can say when a threshold was last reviewed, or why it is the number it is. The threshold review ritual is the cure.
Family five: process
The process family is the one no product can fix, because its specimens live in people and habits rather than in configuration. It is also, in my experience, the family that causes the other four. Fix only the others and they are back within the year.
Hero culture
The admin who fixes everything at two in the morning is praised; the one who quietly prevented the outage is invisible. The organisation learns to reward firefighting and, without meaning to, produces fires. The tell: the same name is thanked in every incident review.
Silent changes
The network changed and monitoring was not told. A new site, a moved server, a re-addressed subnet: all real, none monitored. The tell: discovery finds devices nobody in the room can name.
The shared inbox
Alerts go to it-alerts@example.com and everyone assumes someone else saw it. The tell: the inbox has thousands of unread messages and nobody is embarrassed.
The review that never happens
The threshold review, the coverage review, the alert review: all agreed to, all important, none on the calendar. The tell: ask when the last one was and watch people look at each other. Process anti-patterns covers this family in full, including the cures, which are cheap and unpopular.
The self-audit table
The self-audit is a table with one row per specimen. Each row records the family, the specimen, the sign you have it, a yes or a no, and the first fix if the answer is yes. Fill it in honestly, in an hour, with one colleague. Alone, you will be kind to yourself in the places where you should not be and hard on yourself in the places that do not matter. A colleague corrects both.
| Family | Specimen | Sign you have it | Yes / no | First fix |
|---|---|---|---|---|
| Scope | Monitoring everything | Check count unknown; surprising when found | Pruning worksheet on one class of check | |
| Scope | Monitoring nothing important | Last reported outage on no dashboard | Service-level check on the five services users notice first | |
| Scope | Ping, not service | Availability report contradicts users | One service check per top-tier service | |
| Alerting | Alerting on everything | Weekly alert count exceeds what anyone reads | Freeze new alerts for a quarter | |
| Alerting | Alerts nobody owns | "Who acts on this?" gets a team name | Named owner on the ten noisiest alerts | |
| Alerting | Severity inflation | Over half of rules at top severity | Demote rules that never needed a night response | |
| Alerting | Permanent amber | Amber tile with no known start date | Fix, re-threshold, or move with a date | |
| Visualisation | Wallpaper | Red tile noticed by email first | Run the would-anyone-notice test | |
| Visualisation | Sprawl | Two screens disagree; nobody knows which is right | Inventory every dashboard; name an owner | |
| Visualisation | Forty-panel screen | Nothing readable from the door | Cut to panels that answer "is anything broken?" | |
| Upkeep | Set-and-forget rot | Builder gone; nothing changed since | Maintenance calendar on a real calendar | |
| Upkeep | Dead devices polled | "Down" entries older than your newest colleague | Ninety-day down report; retire or repair each | |
| Upkeep | Stale thresholds | No review date on any threshold | One threshold review this quarter | |
| Process | Hero culture | Same name thanked in every review | Record prevention work beside incidents | |
| Process | Silent changes | Discovery finds devices nobody can name | Add "tell monitoring" to the change form | |
| Process | Shared inbox | Thousands unread; nobody embarrassed | Route each severity to a person | |
| Process | Review that never happens | Nobody knows when the last one was | Calendar it with an owner and an invitee |
The "first fix" column is deliberately small. It is not the cure; it is the thing to do on a Tuesday afternoon that makes the cure possible. And most take under an hour. The cure itself is in the guide linked from each specimen.
Some signs can be pulled from the monitoring database rather than from memory, which makes the audit harder to argue with. Severity inflation is the easiest. Table and column names vary between products, so treat this as the shape of the query and check the documentation for yours:
-- Illustrative: share of enabled alert rules at each severity.
-- Table and column names differ between products.
SELECT severity,
       COUNT(*) AS rules,
       ROUND(100.0 * COUNT(*) /
             (SELECT COUNT(*) FROM alert_rules WHERE enabled = 1), 1) AS pct
FROM alert_rules
WHERE enabled = 1
GROUP BY severity
ORDER BY rules DESC;
If the top row is your highest severity and its percentage is over fifty, write "yes" in the severity inflation row and move on. You do not need a meeting to confirm it.
Tip: keep the completed audit. Date it, store it with the monitoring documentation, and run it again in six months. The second audit is worth more than the first, because "we found eleven, now we have six" is a sentence a manager can act on.
Fewer, not zero
Every monitoring team has some of these. I have never audited a system, including my own, that came back clean, and I would not trust one that did. The goal is not zero. The goal is fewer than last time, and a list that says which. Three named anti-patterns and a plan beats none named and eleven present.
Some are worth carrying deliberately. A team of two may reasonably decide that a shared inbox is fine for low-severity alerts as long as critical ones go to a named person. A permanent amber with a purchase order and a date written on the tile is a known condition. An anti-pattern you chose, with the reason written down, has stopped being one. It is now a decision, and decisions can be revisited.
What the audit must not become is a stick. If the list is used to find out who set things up badly, the next audit will find nothing, because nobody will write "yes" in any row. Audit the system, not the person.
The audit that found eleven
Meridian Parts ran the self-audit after a new operations manager asked, in her first week, why the on-call phone rang so much. The two admins expected to find three or four specimens and found eleven. Among them were a dashboard nobody could log into and an alert emailing a distribution list with one remaining member. They also found forty-one devices that had been "down" for longer than the newer admin had worked there. The previous review had described the monitoring as "comprehensive". It had been. It was also describing a warehouse that had since moved.
They took the three cheapest first fixes from the table and did them in a week. They put the other eight on a list with dates. The second audit, six months later, found five. Nobody was blamed for the eleven, which is the main reason there was a second audit.
The field guide checklist
Use this once a quarter, or whenever a new colleague asks a question you cannot answer.
- The self-audit table has been filled in with a colleague, not alone, within the last six months.
- Every "yes" row has a first fix assigned to a named person with a date.
- The severity query has been run and its result recorded on the audit.
- You can say roughly how many checks and alert rules you have without looking them up.
- Every alert rule has a named owner, not a team name.
- No wall tile has been amber for longer than thirty days without a written reason and a date.
- No device has been in the "down" state for longer than ninety days.
- The threshold, coverage, and alert reviews are on the calendar with owners.
- Any anti-pattern you are carrying on purpose has its reason written down next to it.
- The completed audit is dated and stored, and the next one is scheduled.
Where to go next
A field guide does not cure anything. It lets you say what you are looking at, which is the step everyone skips. Once the specimens in your system have names, the four remaining guides in this pillar take them one family at a time. They cover monitoring everything for scope and alerting on everything for alerting. They cover set-and-forget rot for upkeep, and process anti-patterns for the people. The visualisation family is covered in the dashboard pillars linked above.
To see how far along a practice is once its anti-patterns are under control, the monitoring maturity model gives the stages. All of these guides are part of Common Monitoring Mistakes and Anti-Patterns.
Put this into practice with SysPeep Monitor
Anti-patterns are easier to catch when you can see what is actually configured. SysPeep Monitor auto-discovers devices and interfaces and leaves the choice of what to monitor to you. It keeps thresholds, dependencies, and alert rules in one place, and reports on alert history from a single web console. That covers most of the evidence the self-audit asks for. The free trial installs on a Windows machine if you want to run the audit against your own network.
Download Free TrialLearn About SysPeep - All Rights Reserved.