
Ping-Up vs. Service-Up: Layered Availability Checks That Don't Lie
Every admin lives this morning eventually. The phone is ringing, email has been down for an hour, and the monitoring dashboard is a serene wall of green. The dashboard is not broken. It is answering the question it was asked, "does the mail server respond to ping?", and the answer is honestly yes. The server is powered on, the network path works, and the mail software on top of it has been dead since before breakfast.
You asked the machine whether it was alive. The users are asking whether it works. Those are different questions, and the gap between them is where monitoring systems learn to lie without meaning to. I once spent a quarter defending a mail server's "100% uptime" to a room of people who had each been without mail for an afternoon. It took me longer than it should have to notice that my number had been measured entirely by ping.
The fix is to check in layers. This guide gives you the five-rung check ladder, from the humble ping up to a scripted real transaction. For each rung you will learn exactly what a passing check proves, the failure it still cannot see, and the classic story where that rung swore everything was fine. Then we build sensible check stacks for real services: file server, mail, intranet app, DNS, printing. We wire up alerting so the ladder produces one useful alert instead of five noisy ones.
In this guide
- Why "up" needs layers
- The ladder, rung by rung
- Building the right stack per service
- Alerting across rungs without the noise
- What this does to your uptime number
- Where to go next
Why "up" needs layers
A service is a stack of layers, and every layer can fail on its own. At the bottom there is hardware with power. On top of that sits a running operating system, then a process that has opened a network port. Above that sits software speaking a protocol correctly. At the very top sits application logic returning correct answers from real data. A user only cares about the top layer. A check, meanwhile, can only vouch for the layers at and below the height where it tests — everything above its rung is a guess.
That is the whole theory: a check proves the stack up to its own rung and nothing higher. Ping tests the bottom; a scripted login tests the top. The craft is choosing, per service, how high up the ladder you need to climb before a green light actually means what your users mean by "working." Climb too low and your monitoring lies reassuringly. Climb to the top everywhere and you drown in fragile, expensive checks. The ladder below is how you climb exactly as high as each service deserves.
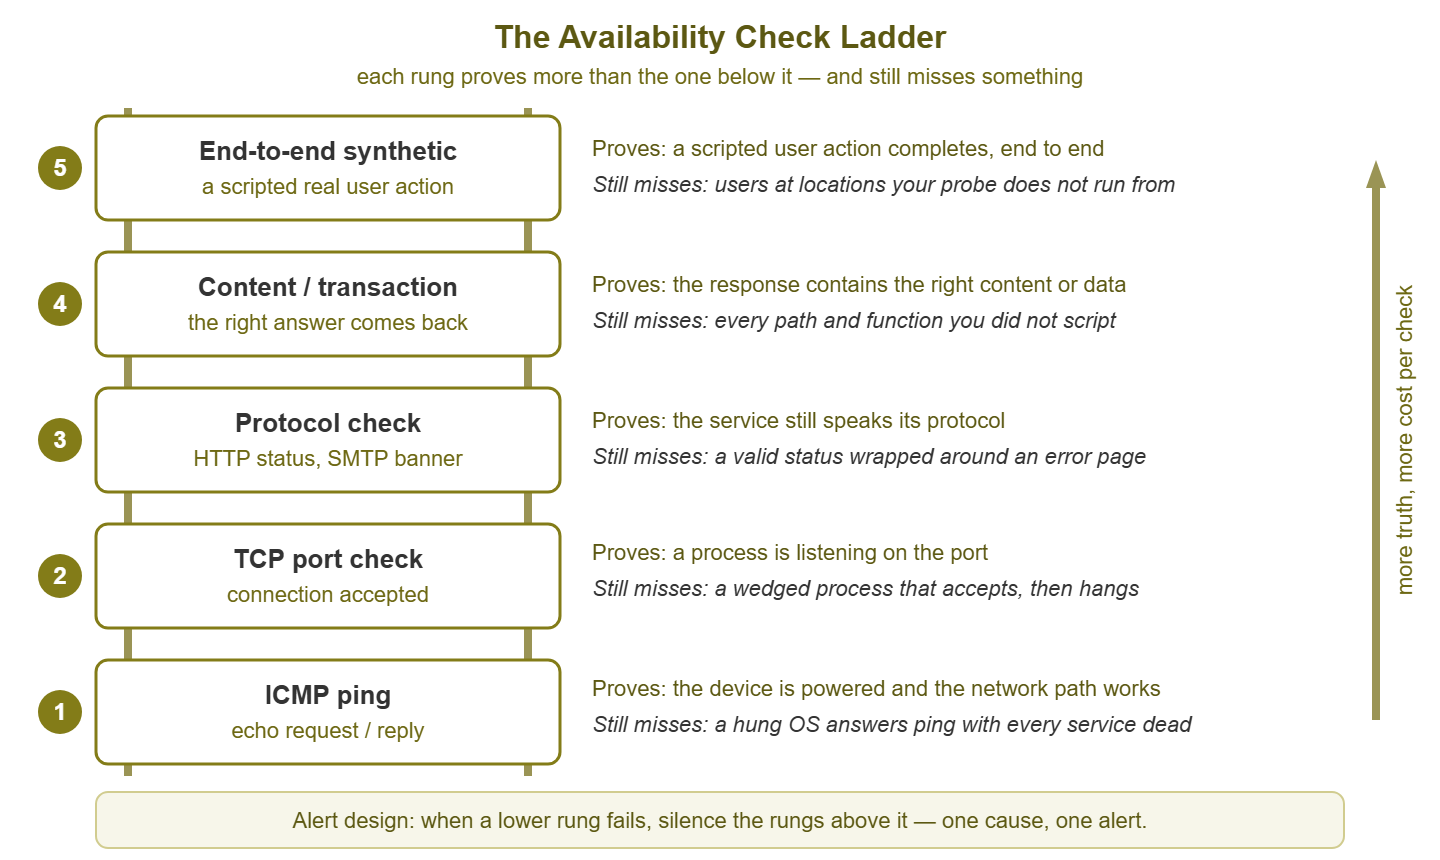
Figure 1: The check ladder. Each rung proves more than the one below it — and each still misses something.
The ladder, rung by rung
Rung 1: ICMP ping — the device is alive
What it is: ping sends a tiny "are you there?" message, an ICMP echo request, and waits for the echo back. ICMP is the Internet Control Message Protocol, the network's built-in signaling language. Ping is the cheapest check in existence and every monitoring tool starts here.
What passing proves: the device has power, its network card works, and the network path between you and it is intact. That is genuinely useful — when ping fails, you know to grab a console cable or check a switch, not to debug application settings.
What it still misses: everything above the network card. Ping replies are handled deep in the operating system's network plumbing, which keeps answering even when the machine is otherwise catatonic. A server with exhausted memory, a hung disk controller, or every service crashed will cheerfully return pings all night. The classic story: a file server locks up hard at 11 PM — console frozen, shares dead, nothing responding. The ping check stays green until the first user arrives at 8 AM. The one thing still working was the part that answers pings. There is also the inverted lie: a perfectly healthy device with a firewall rule blocking ICMP looks "down" forever. Ping is a fine heartbeat and a terrible witness.
Rung 2: TCP port check — something is listening
What it is: instead of knocking on the whole machine, you knock on one door. A port is the numbered door a service listens at, and TCP (Transmission Control Protocol) is the connection method most services use behind that door. A TCP port check opens a connection to the specific port a service uses. That is 445 for Windows file sharing, 25 for mail, 443 for a secure website. The check reports whether the connection was accepted. On Windows you can do it by hand:
# Rung 1: does the box answer at all?
ping -n 4 fileserver01

# Rung 2: is anything listening on the file-sharing port?
Test-NetConnection fileserver01 -Port 445
What passing proves: the operating system is up enough to accept connections, and a process has that port open. You have climbed past "the box is powered" to "the service's front door opens." A port check also catches the things ping is blind to: crashed services, firewall rules eating traffic, a service that never started after a reboot.
What it still misses: whether anyone competent is behind the door. Accepting a TCP connection is handled partly by the operating system on the process's behalf. So a program can be utterly wedged — deadlocked, waiting forever on a dead disk or database. Its port can still accept connections that then go nowhere. The classic story: the database server's port accepts instantly all morning, so monitoring is green. The database engine behind it is stalled on storage, and every application query hangs until timeout. The door opens; the room is empty.
Rung 3: protocol check — it speaks the language
What it is: connect and actually converse. Ask a web server for a page and read the HTTP status code it returns. HTTP is the language browsers and web servers speak. The status code is the three-digit verdict at the top of every reply. Connect to a mail server and confirm it sends its SMTP greeting banner. SMTP is the protocol mail servers use to hand messages to each other, and the banner is the hello. Send a DNS server a real query for a real name (DNS is the service that turns names into addresses). The check now speaks the service's protocol and judges the reply.
What passing proves: the service software is alive enough to hold a conversation — it parsed a request and produced a well-formed answer. This rung catches the wedged-process cases: a hung web server stops producing status codes even when its port still opens, and a frozen mail server stops sending banners.
What it still misses: convincing wrongness. A protocol check reads the envelope, not the letter. A web server can return a beautifully valid 200 OK status for a page whose entire content is "Service temporarily unavailable." A mail server can greet you politely with its banner and then defer or bounce every actual message because its queue disk is full. The classic story: an intranet application loses its database connection. Its error handler — trying to be graceful — renders a friendly "something went wrong" page with a 200 status code. The HTTP check reads "200" and reports green for three days while every user sees the apology page. The service spoke fluent HTTP the whole time. It just had nothing true to say.
Rung 4: content and transaction checks — the right answer comes back
What it is: read the letter, not the envelope. A content check fetches the page and verifies the body contains what a working service would show — does the login page actually contain the login form fields? A transaction check goes one step further and exercises the data path. Run a harmless test query and confirm it returns rows; look up a known record and confirm the expected value comes back.
What passing proves: the application logic and its data path produced a correct result for the thing you tested. This is the truth tier — the first rung where "green" approximates what a user means by "working." The friendly-error-page trick from rung 3 dies here, because the apology page does not contain the login form.
What it still misses: every path you did not test. A content check on the login page proves the login page; it says nothing about whether searching, saving, or printing works. The classic story: an application's search index quietly corrupts, and every search returns zero results. The content check on the home page passes — the page renders perfectly, and the search box is right there looking helpful. Meanwhile, the feature everyone actually uses returns nothing. The rung told the truth about what it checked. It just was not checking the thing that broke.
Rung 5: end-to-end synthetic — a scripted real action
What it is: a robot user. A synthetic check performs a scripted version of a real task on a schedule: log in with a test account, open a document, run a report. Or — the gold standard for mail — it sends a message through the full path and confirms it arrives in a mailbox. It times the round trip.
What passing proves: a user doing that task, from where the probe runs, would have succeeded. Nothing else you can automate says more.
What it still misses: everyone who is not the robot. A synthetic check sees the world from one vantage point with one account. The classic story: the synthetic login runs from the monitoring server in the data center and passes all day. Meanwhile, an entire branch office is cut off by a broken WAN link (the wide-area connection between sites) that the probe never crosses. Synthetics are also the most expensive rung to keep honest: scripts break when the application changes. A brittle synthetic generates false alarms until people stop believing it — which is worse than not having it. Use this rung sparingly, on the services that earn it, and run it from where users actually sit when you can.
Tip: the ladder is also a built-in diagnosis. When a service breaks, the highest green rung points at the failing layer. Ping green but port dead means the process crashed. Port green but protocol dead means the service is wedged. Protocol green but content wrong means the application or its data is sick. Reading your checks top-down is the first minute of troubleshooting, done for you.
Building the right stack per service
You do not run all five rungs on everything. Each rung costs something — setup time, maintenance, and load on the service — and the higher rungs cost the most. The pattern that works: run the cheap bottom rungs broadly, and climb only as high as the service's importance justifies, which usually means two or three rungs per service. The right question for each service is: "what is the cheapest check that would have caught our last real outage of this thing?"
Northgate Retail had the answer to that question handed to them by their own store staff. Their stock-lookup web application lost its database connection at six in the morning, and from then on every page it served was an error page. The monitoring on that server was a ping check, which stayed green for the entire trading day. The server was perfectly healthy, and the application on it was not. Head office found out at four in the afternoon from a branch manager who had been phoning other branches to ask whether their screens were broken too. The fix was a forty-second service restart. The cheapest check that would have caught it was a content match on the search page. It took ten minutes to set up the next morning. The ratio between those two numbers is one I have stopped finding surprising.
Worked examples for the services most small networks run:
| Service | Check stack (bottom to top) | The rung that tells the truth |
|---|---|---|
| File server | Ping + TCP 445 + read a small test file from a share | The file read — it proves shares, permissions, and disk in one shot |
| Mail flow | SMTP banner + round-trip test message with timing | The round trip — mail's only honest check is a delivered message |
| Intranet app | HTTP status + content match on the login form; add a synthetic login if it is business-critical | The content match — it kills the friendly-500-as-200 lie |
| DNS | Resolve one internal and one external name against each server, with a response-time threshold | The query itself — DNS's protocol check is cheap, so skip the lower rungs and start here |
| Printing | Ping the printer + TCP 9100 + watch the print queue length on the server | The queue length — a growing queue is the first sign that the server side of printing has failed |
Notice the pattern in the middle column: nobody gets all five rungs, and two services skip rungs entirely. DNS goes straight to the protocol rung because a real query costs the same as a port check and proves strictly more. Mail keeps only two rungs because the round-trip message makes the middle rungs nearly redundant. If a delivered test message arrives on time, an enormous amount of infrastructure just testified at once. And printing gets modest checks with modest expectations, because printers treat monitoring as a challenge to find new and unmonitorable ways to disappoint you. The queue check catches the failures that are actually the server's fault, which is the part you can fix. A growing queue is how print death actually announces itself.
One more design rule: every rung you add should carry its own threshold for slow, not just dead. A DNS answer in four seconds or a login page that takes thirty are outages in slow motion for the people waiting. Where you draw the slow-is-down line is a policy question — defining "down" covers it — but the checks have to measure response time, or the policy has nothing to enforce with.
Alerting across rungs without the noise
A ladder of checks without alert design produces a fireworks show. The file server loses power and you get four alerts at once: Ping, port, file read — and while we are at it, the backup job that used the share. They all share one root cause. Do that a few times and alert fatigue sets in, which is how monitoring systems die of being ignored.
The cure is rung-aware dependencies: teach the system that the rungs stand on each other. If ping is down, the higher rungs on that host cannot pass, so their alerts add nothing. Suppress them and page once for the lowest failed rung. Most monitoring tools express this as a dependency or parent-child relationship between checks. Three rules cover nearly everything:
- Suppress upward on the same host. Ping down silences the port, protocol, and content checks for that machine. One cause, one alert, and the alert that fires names the lowest broken layer — which is exactly where troubleshooting should start.
- Alert by user impact, not by rung drama. A failed content check on the order system during business hours is a page-someone-now event even though every lower rung is green. A lobby-TV ping failure at 2 AM is a ticket for the morning. Severity belongs to the service and the moment, not to how technical the check sounds.
- Confirm before declaring. Higher rungs flap more — one slow database query or a garbage-collection pause can fail a single transaction check. Require two or three consecutive failures before alerting on the upper rungs, and set each rung's timeout deliberately. The confirmation delay costs you a few minutes of detection time and buys back your team's trust in every alert that does fire.
Dependencies also work sideways, between devices: if the branch-office switch dies, everything behind it becomes unreachable, and a good dependency tree turns forty ghost alerts into one. That topology game is its own topic in the fundamentals pillar, but the principle is identical: alert on causes, silence the echoes.
Frequency follows the same economy as the rungs themselves. Run the cheap bottom rungs often — every minute is fine for ping and port checks. Run the expensive top rungs less often. Every five to fifteen minutes for content checks and synthetics is plenty for most services. The interval you choose also quietly limits what your availability numbers can claim, because a check every five minutes cannot see a three-minute outage. That resolution question matters more than it looks, and it gets a full treatment in the math guide linked below.
What this does to your uptime number
Here is the consequence nobody warns you about: the day you add truth-tier checks, your measured availability goes down. Not because the service got worse — because your measurement stopped being flattering. Ping-measured uptime is always the highest number on the ladder; every rung you climb can only find failures the rung below missed. The mail server that "never went down" all year was answering pings during three separate multi-hour queue outages that nobody measured. Your old number was not availability. It was ping availability, which is a statistic about network cards.
Expect the drop, and brief whoever reads your reports before it happens. One sentence will do: "we started measuring whether the service actually works, not whether the hardware answers, so the number is lower and true now." Resist the quiet temptation to game it back by measuring only the rungs that flatter. The number that goes to management should be built from the highest rung you run for that service. That is the number your users would recognize as their experience. How to fold rung results, partial failures, and degraded-but-limping states into one defensible percentage is exactly the business of honest availability math. How to decide in advance what severity each rung failure represents is covered in defining "down". The short version: smaller and honest beats bigger and fictional, every time someone checks.
Where to go next
You now have the ladder: five rungs, each proving more and costing more. Assemble them two or three at a time per service, with dependencies so one failure pages one human once. Build it and the morning from the top of this guide changes shape. The phone still rings, but the dashboard rings first, and it names the layer that broke. If you are still assembling the basic device-level monitoring underneath all this, the first ten checks is the place to start. The rest of the Uptime & Availability guides carry on from here: what "down" means, how to compute the number, and how to keep the evidence. A wall of green is only serene when it has earned it.
Put this into practice with SysPeep Monitor
Whatever your top rung is, the bottom rungs should not be hand-built. SysPeep Monitor auto-discovers the devices on your network and runs health and service checks over SNMP, WMI, and SSH. Its dependency rules mean one root cause produces one alert, not five. Dashboards and alerting from a single web console; the free trial installs on any Windows machine in minutes.
Download Free TrialLearn About SysPeep - All Rights Reserved.