
One Dataset, Two Lenses: How Ops Data Becomes Security Data
You already run monitoring. Somewhere on your network a system polls the switches, watches the DHCP scopes, checks that DNS answers, and emails you when a disk fills up. It exists to keep things running. Then one day a manager, an auditor, or an insurance form asks a different question: "how would you know if someone hostile were on the network?" The honest first reaction is a small sinking feeling. That is because the answer sounds like "buy a second set of tools, and hire someone to watch them." The first form I was handed had a two-line box for the answer.
The more useful answer is that the data you already collect answers that question too. The same flow records that tell you the WAN link is busy can tell you a workstation is quietly phoning home at two in the morning. The same DHCP log that warns a scope is nearly full can reveal a second, unauthorized DHCP server. Nothing about the data changes. What changes is the question you ask of it. A lens does not alter the scene in front of you; it only changes what is in focus.
This guide walks through six kinds of data almost every small network already produces. Those are flow records, interface counters, DHCP logs, DNS logs, authentication logs, and the device inventory. For each it gives you the health question you already ask and the security question you could be asking. By the end you will know what the second lens looks like source by source, what it costs, and what it gives back.
In this guide
- The mindset shift: you already own the sensors
- Six data sources, two questions each
- The quick-reference table
- A worked example: one alert, both lenses
- What the second lens costs, and what it gives back
- Where to go next
The mindset shift: you already own the sensors
A sensor, in monitoring language, is anything that observes something and reports what it saw. Your core switch's interface counters are a sensor. Your DHCP server's lease log is a sensor. Your domain controller's security event log is a very chatty sensor. Large organizations bolt on specialized security sensors and analysts, and those are valuable. But in a small shop, the ordinary sensors are the ones you have, and they see more than you might expect.
The reason is simple. Anyone hostile on your network has to use the network to accomplish anything. That applies to an outside intruder, a piece of malware, or an insider with a bad idea. They need an address, so they touch DHCP. They need to find things, so they resolve names. They need to log in, so they leave authentication events. They need to move data, so they generate flows. Every step leaves a mark in data you already collect for entirely boring reasons.
The doorbell camera you bought to catch package deliveries also records who tried the door handle at three in the morning. Nobody sold it as a security system, but it saw the thing, and it saw it first. The operations lens asks "is it healthy?" The security lens asks "is it hostile?" Same camera, same footage, different question.
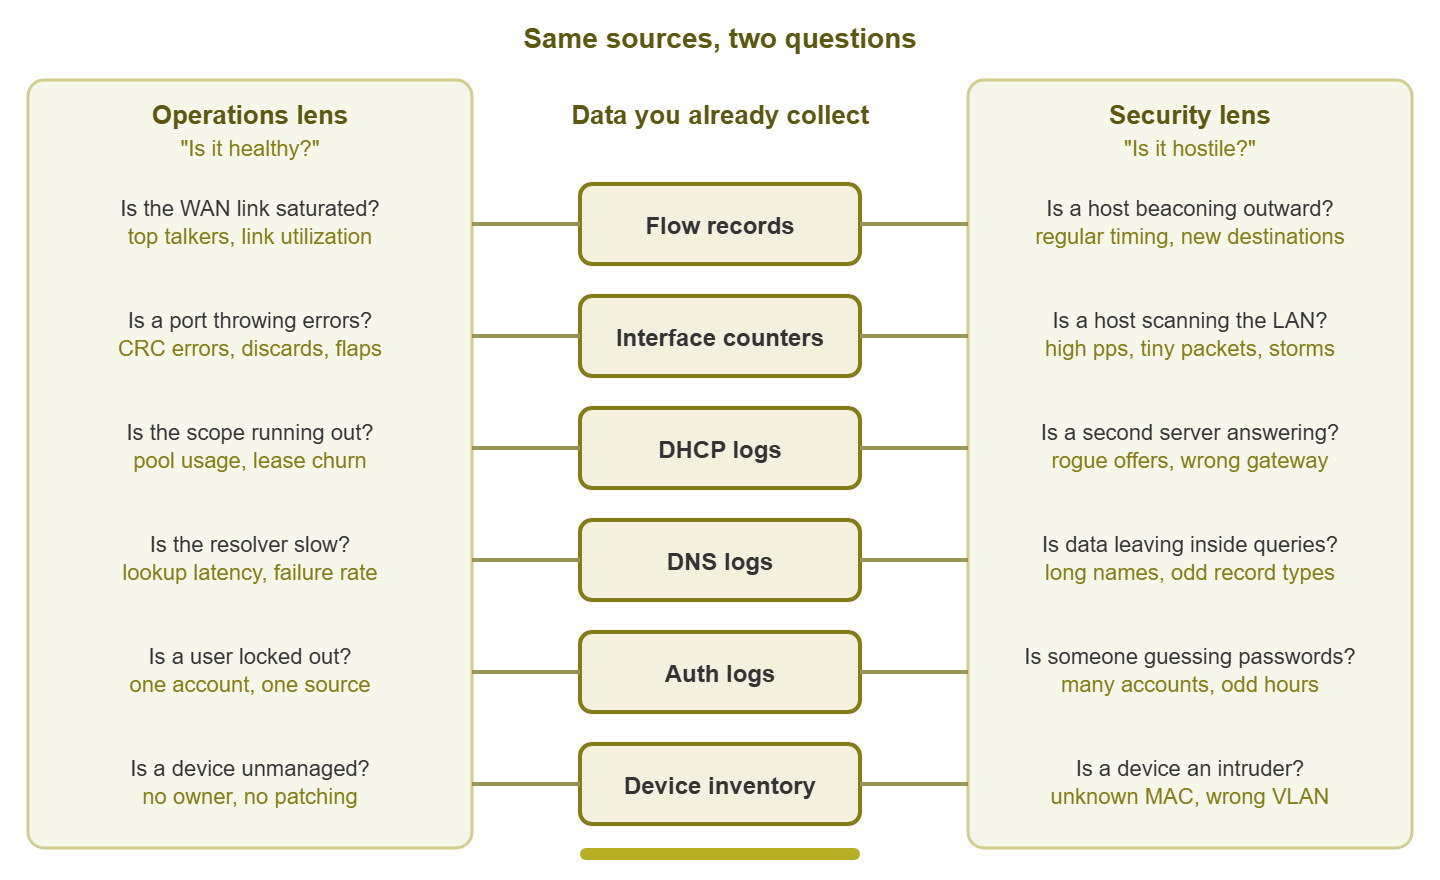
Figure 1: The same six data sources feed both lenses. The operations lens asks whether something is broken; the security lens asks whether something is hostile.
Six data sources, two questions each
Each source gets the same treatment: what it is, the health question, the security question, and the first check.
Flow data: saturation vs. beaconing
What it is: flow data is a summary record of each conversation that crossed a router, firewall, or switch. It records source and destination addresses, ports, protocol, byte and packet counts, and start and end times. NetFlow, sFlow, and IPFIX all carry this kind of record. A flow is a phone bill, not a recording: it tells you who talked to whom, when, and for how long — not what they said.
The health question: is the WAN link saturated, and who is using it? This is the classic top-talkers view: sort flows by bytes and find the workstation streaming video or the backup job running at noon. (The backup job was scheduled for two in the morning.)
The security question: is any host beaconing? Beaconing is the habit of compromised machines checking in with a controller. It uses a small connection to the same external address at regular intervals, around the clock, including nights and weekends. The payloads are tiny and suspiciously similar in size. Nothing about a single beacon looks wrong. The pattern is the signal. A related question is whether a host that normally receives most of its traffic has suddenly started sending a lot, especially to an address nobody has heard of.
First check: filter the flows for the suspect host over the last day or two, list its external destinations, and look at the timing. Regularity that continues at three in the morning deserves a closer look. Legitimate software checks in on schedules too, so expect to whitelist update servers and backup targets. There is a dedicated guide on using flow data for security if you want to go deeper.
Interface counters: errors vs. storms and scans
What it is: every switch and router port keeps running tallies. You read them over SNMP (Simple Network Management Protocol, the standard question-and-answer language for network gear). Those tallies include bytes and packets in and out, errors, discards, and broadcast packets.
The health question: is a port throwing errors? A rising CRC error count usually means a bad cable or a failing transceiver. Growing discards mean a port is carrying more than it can. Link flaps mean something physical is loose. All of these are Tuesday-afternoon maintenance.
The security question: is a host scanning the network, or is something generating a storm? A scan is a host methodically knocking on many doors. It sends a great many very small packets to a great many addresses or ports in a short time. On a port counter, that shows up as packets per second jumping while bytes per second barely moves. A broadcast storm (a loop or a misbehaving device flooding the segment) also spikes packet rates, but the broadcast counter climbs with it. Telling the two apart is the whole job: a storm is sick, a scan is suspicious.
First check: identify the port, compare packets per second to bytes per second, and check whether the broadcast counter moved. If it did not, look at the flows from that port and count distinct destinations. A workstation that talked to three hundred addresses in a minute is not doing anything a workstation normally does. The exception is your own authorized scanner or discovery tool, which looks exactly like this by design and should be whitelisted before you go looking. I learned that from my own discovery scan, which once raised a scan alert on itself. The Traffic Anomaly Detection pillar covers the pattern side.
DHCP logs: scope exhaustion vs. a rogue server
What it is: DHCP (Dynamic Host Configuration Protocol) is the service that hands every joining device an IP address, a default gateway, and a DNS server to use. Its log records each lease issued, renewed, and released, with the requesting device's MAC address (the hardware address of its network card).
The health question: is a scope running out of addresses, and is the service up? Scope exhaustion is a slow-motion outage — new devices simply cannot join. Lease churn (a burst of new leases) usually means a visitor event, a batch of new phones, or a device with a broken network stack asking over and over.
The security question: is a second, unauthorized DHCP server answering requests? Any device on a segment can answer a DHCP request, and clients accept the first offer that arrives. A rogue DHCP server can hand out its own gateway and DNS addresses, quietly routing a client's traffic through a device it controls. Sometimes it is malicious. Often it is a home router someone plugged into a conference-room port to "get more Wi-Fi," which has the same effect.
First check: from a client that is behaving strangely, look at which server issued its lease. On Windows, ipconfig /all shows a "DHCP Server" line; if that address is not your DHCP server, you have your answer. On the server side, an unexplained drop in lease activity can mean someone else is answering first. Many managed switches offer a feature generically called DHCP snooping that logs or blocks offers arriving on ports that should never host a server. If yours have it, that log is a security sensor you already own. The Rogue Device Detection pillar goes further.
DNS logs: resolver latency vs. tunneling
What it is: your DNS resolver is the server that turns names like mail.example.com into addresses. Its query log records every name every client asked for, when, what record type, and whether the answer succeeded or came back "no such name" (an NXDOMAIN response).
The health question: is the resolver slow or failing? Lookup latency and failure rate are the two numbers. When either climbs, users report "the internet is down" even though the link is fine.
The security question: is data leaving the network inside DNS queries? DNS is almost always allowed out through a firewall, which makes it a tempting smuggling channel. DNS tunneling encodes data into the query names themselves. So from the defender's chair it looks like one host sending a steady stream of queries for very long, random-looking subdomains of one unfamiliar domain. Those queries often use record types ordinary software rarely asks for. A second pattern is the failure storm: one host generating a burst of NXDOMAIN responses for gibberish names. That is what some malware does while hunting for a controller through algorithmically generated names.
A simplified excerpt of both patterns next to normal traffic, with made-up names:
time      client       type  name                                           result
09:14:02  10.0.5.21    A     www.example.com                                OK
09:14:03  10.0.5.88    TXT   a8f3k2m9x1q7r4t6y0p2s5d8.unknown-zone.example  OK
09:14:04  10.0.5.88    TXT   b9g4l3n0y2r8s5u7z1q3t6e9.unknown-zone.example  OK
09:14:05  10.0.5.88    TXT   c0h5m4o1z3s9t6v8a2r4u7f0.unknown-zone.example  OK
09:14:05  10.0.5.140   A     qwpxlmvz.example                               NXDOMAIN
09:14:05  10.0.5.140   A     rtlkpnbc.example                               NXDOMAIN
09:14:06  10.0.5.140   A     zmqvwlxa.example                               NXDOMAIN
First check: rank clients and domains by query count and look for one that towers over the rest. Sort by query name length while you are at it. Do this on a schedule. Not when something feels off; on a day of the week you have written down. The DNS as a Threat Sensor pillar is entirely about this source.
Authentication logs: a locked-out user vs. brute force
What it is: every place a person or a machine logs in writes a record. Those places include the domain controller's security event log, the VPN concentrator, the RADIUS server behind your Wi-Fi, and every appliance's web console. Each record has an account name, a source address, a timestamp, and a result.
The health question: is a user locked out, and why? The classic case is one account, one source, a cluster of failures within a couple of minutes, then silence. Someone changed their password and forgot the phone still has the old one. That is a help-desk ticket.
The security question: is someone guessing passwords? Brute force is many failures against one account. Its quieter cousin, password spraying, tries one common password against many accounts, a few attempts each, slowly enough that nobody locks out. The tells are shape and timing. One is failures spread across dozens of accounts from one source. Another is attempts against accounts that do not exist or belong to people who left. Another is activity when nobody should be logging in.
First check: group the failures by source address and by account name, and look at the timestamps. One source hitting twenty accounts is a very different animal from one account failing twenty times, even though the raw count is identical.
Device inventory: unmanaged vs. rogue
What it is: the list of things on your network, assembled from discovery scans, switch MAC address tables, ARP tables, and DHCP leases. Most monitoring systems build one automatically and raise a "new device" event when something appears that was not there yesterday.
The health question: is a device unmanaged? Examples are the printer nobody told you about, the lab machine never joined to the domain, and the smart TV in the boardroom. Unowned devices do not get patched or monitored, and eventually break anyway.
The security question: is a device an intruder? A rogue device is one that should not be there at all. Examples are something plugged into a port that should be empty, or a non-server appearing in the server VLAN. Another is a MAC address whose vendor prefix does not match what it claims to be. Or it could be a device that appeared at an odd hour on a port in an unlocked area. The overlap with the health question is large — a device is unmanaged until proven rogue — and the first step is the same.
First check: find the switch port it lives on, note when it first appeared, look up the vendor prefix of its MAC address, and ask around. "Does anyone claim this?" resolves most new-device events. The usual answers are "that's mine", "that's the new printer", and silence. The ones nobody claims are the ones that matter; the Shadow IT Discovery pillar covers that grey zone.
The quick-reference table
| Data source | Health question | Security question | First check |
|---|---|---|---|
| Flow records | Is the link saturated? | Is a host beaconing outward? | Destinations and timing regularity for one host over a day |
| Interface counters | Is a port throwing errors? | Is a host scanning, or is there a storm? | pps vs. bps; broadcast counter; distinct destinations |
| DHCP logs | Is a scope nearly full? | Is a second server handing out leases? | Which server issued the lease on an affected client |
| DNS logs | Is the resolver slow or failing? | Is one host tunneling or hunting gibberish names? | Top clients, top domains, longest names, NXDOMAIN bursts |
| Auth logs | Is a user locked out? | Is someone spraying or brute-forcing? | Failures by source and by account; timestamps |
| Device inventory | Is a device unmanaged? | Is a device a rogue? | Switch port, first seen, MAC vendor, does anyone claim it |
Tip: every "first check" in the table is something an operations person already knows how to do. You are pointing a familiar skill at a different question, and the hardest part is remembering to ask it.
A worked example: one alert, both lenses
Here is how the two lenses play out on an ordinary afternoon. Your monitoring system raises a warning: packets per second on switch port 14 have jumped to ten times normal. Through the operations lens, the obvious suspect is a broadcast storm, so you check the broadcast counter on that port. It has barely moved. Bytes per second are up only slightly. That rules out a storm and a big file transfer: this is a large number of very small packets.
Now the security lens. You pull the flows for the host on port 14 for the last fifteen minutes. It has attempted connections to more than two hundred internal addresses, most on the port that file sharing uses. The inventory says the host is an ordinary staff workstation, and workstations do not do that by themselves. You check the authentication log on a couple of the servers it touched. There they are: failed logons from that workstation, spaced a fraction of a second apart.
Each fact on its own has an innocent explanation. Together, they are a workstation methodically looking for other machines it can reach. It is not sick; it is suspicious. It is time to stop investigating and start containing. Disable the port, and leave the machine powered on for whoever will examine it. Escalate along the path you agreed in advance. What happens next belongs to where monitoring ends and detection begins. The point here is that you got there using nothing but counters, flows, an inventory, and a log.
What the second lens costs, and what it gives back
This is not free, but the bill is smaller than a second tool set, and it is paid in a currency you already spend.
The costs
Time. The security questions do not answer themselves. Someone has to look at the top-domains report, the new-device list, and the failed-logon summary. In a small shop that someone is you. Budget a fixed block — half an hour a week is a realistic start. That is because a view that nobody is scheduled to read is a view that nobody reads.
Tuning. The security lens produces false positives at first. Your backup agent "beacons" to its cloud target every few minutes. Your authorized discovery scan looks exactly like a hostile one. The new developer's second laptop is a "rogue device." Each needs to be understood once and then excluded, and until then the security view will shout about nothing. Expect a noisy month, not a noisy week.
Retention. Operations questions live in the present: is it slow now? Security questions live in the past: when did this host first talk to that address? Intrusions unfold over weeks, so flows, DNS logs, and authentication records you keep for a day or two need to be kept considerably longer. That means disk space and a deliberate decision.
What you get back
Earlier notice. Scanning, spraying, beaconing, and gibberish DNS are what hostile activity looks like in its early stages, before data leaves and before anything gets encrypted. Seeing them a day earlier is the difference between a contained incident and a very long weekend.
At Meridian Parts the weekly top-talkers report went to the network administrator every Monday. Every Monday he read it for the one question it was built for: who ate the WAN link. For four weeks a workstation in accounts sat in eleventh place. It was sending a small, steady amount of traffic to one external address, day and night, weekends included. Eleventh place is not interesting when the question is bandwidth. An audit question sent him back through the same four reports with the other lens on. The pattern was in every one of them, in a column he had never had a reason to read. The review recorded that the data had been "available throughout". The report now has a second page sorted by regularity, and he reads that page first.
Evidence. If something does go wrong, the first thing an incident responder asks for is history. That includes which hosts talked to which addresses, when the new device appeared, and which accounts failed to log in. Retained ops data is that history. And as a side effect, learning what normal looks like makes you better at the day job too.
A starter checklist for adding the second lens
- Confirm you actually collect each of the six sources, and where each is stored. Missing sources are a to-do list, not a failure.
- Decide how long each source is retained, and lengthen it where security questions need history.
- Build one saved view per source that answers the security question directly (top domains, new devices, failures by source).
- Whitelist the known noisy legitimate sources: backup targets, update servers, your own scanner, your own monitoring system.
- Put a recurring half-hour on the calendar to look at the six views. Agree in advance who you will call when a view shows something you cannot explain.
Where to go next
You already own the sensors. The second lens is a question, not a purchase, and that one idea is the foundation for everything else in this pillar. It also fits in a two-line box. The next step is understanding the boundary — what monitoring can honestly claim to do about security and where it hands off — in Where Monitoring Ends and Detection Begins. From there, Security Signals Hiding in Your Ops Monitoring turns the six sources into a catalog of specific signals. The rest of Network Monitoring as a Security Layer covers who owns the work and how to build the view.
Put this into practice with SysPeep Monitor
Every source in this guide starts with collection you probably already run. SysPeep Monitor auto-discovers the devices and interfaces on your network. It gathers interface counters and health metrics over SNMP, WMI, and SSH. It keeps the history on dashboards and reports in one web console — the raw material for both lenses. The security question is yours to ask; the free trial installs on any Windows machine.
Download Free TrialLearn About SysPeep - All Rights Reserved.