
How Monitoring Tool Sprawl Happens (and Why It Hurts)
Nobody sets out to own seven monitoring tools. I have never met anyone who chose seven. What happens is that you inherit a network, and the network arrives with company. There is a login to the switch vendor's management console and a server-monitoring tool the previous admin liked. There is a web-page checker somebody set up during a website project and a log platform that came with a merger. There is a little script that pings the internet link and sends an email. And there is a spreadsheet that claims to be the list of what is being watched. Each of these sends alerts. None of them agrees with the others about what is currently broken.
This condition has a name: monitoring tool sprawl. It means having more tools watching overlapping parts of the same estate than anyone deliberately chose. The estate is everything you are responsible for, from the core switch to the printer in reception. With sprawl, there is no clear answer to the question "which one is the truth?" Sprawl is one of the most common situations in IT and one of the least talked about. That is because every tool in the pile arrived for a perfectly sensible reason. I know this because two of the tools in my last pile were mine, and I can still defend both purchases. That is what makes sprawl hard to see. There is no bad decision to point at, only a long run of sensible Tuesdays.
This guide explains how the pile forms, one reasonable decision at a time. It explains what the pile costs you, which is far more than the renewals. It shows how to tell genuine sprawl from healthy specialization, because not every extra tool is a problem. And it ends with a short self-assessment you can fill in at your desk. By the end you will know whether you have a sprawl problem, roughly how bad it is, and what the rest of this series can do about it.
In this guide
- What "sprawl" actually means
- Six ways the pile forms
- What sprawl costs you
- Sprawl versus healthy specialization
- The self-assessment table
- Where to go next
What "sprawl" actually means
First, a working definition of the thing being sprawled. A monitoring tool is anything that watches part of your infrastructure and tells you about it. That includes a full monitoring platform, yes, but also the vendor's own management console for your switches. It includes the dashboard built into your backup software, a flow collector, a log platform, and an external uptime checker. It also includes the script that emails you when the internet link goes down. If it watches and it tells, it counts. Most admins undercount their tools, because they only count the ones with "monitor" in the name.
Sprawl is when two or more of these tools do the same job for overlapping parts of your estate, and the overlap was never chosen. The word "chosen" does a lot of work in that sentence. Deliberately running a second, independent check on your monitoring server is redundancy. That lets you find out when the watcher itself dies, and it is good. Discovering that three tools poll the same core switch because three different people set them up in three different years is sprawl, and it is not.
A useful mental picture is a records office with several filing cabinets. One cabinet holds the personnel files. A second cabinet also holds personnel files, but only for people hired after a certain date, filed by a different system. A third cabinet holds copies of some of both, and nobody has the key. (Its rental is renewed every year, promptly.) When someone asks "do we have a file on this person?", the honest answer is "probably, somewhere." That is what sprawl does to the question "is this device monitored?"
Six ways the pile forms
Sprawl is almost never the result of a bad decision. It is the result of many good, small, local decisions that nobody ever looked at together. These six stories account for nearly every tool in nearly every pile; you will recognize most of them.
1. Every hardware purchase brings a console
Switches, firewalls, wireless access points, and storage arrays each ship with the vendor's own management console. So do hypervisors (the software that runs your virtual machines). So do UPS units (uninterruptible power supplies, the battery boxes that carry a rack through a power blip). Each vendor's console is often genuinely good at watching that one kind of device. It also feels free, because it came in the box. Nobody chose to add a monitoring tool; they chose to buy switches. But five hardware vendors means five consoles. Each has its own login, its own idea of what an alert is, and its own email settings that somebody configured once and forgot.
2. Every team adopts its own
The server team wants operating-system metrics and service checks. The network team wants SNMP (Simple Network Management Protocol, the standard way of asking network devices about themselves) and interface graphs. The developers want application traces. The help desk wants a status page they can read to users on the phone. Each group picks a tool that speaks its language, and each pick is reasonable in isolation. Nobody is wrong. Nobody looked sideways, either. So the server tool and the network tool both end up pinging the same hosts and disagreeing about whether they are up.
3. A project buys something and leaves
It might be a website launch, a phone-system rollout, or an ERP migration (enterprise resource planning, the big business system that runs finance and stock). The project budget includes "monitoring" as a line item. So a tool gets bought, configured by the project's consultants, and pointed at the project's servers. Then the project ends. The consultants leave. The tool stays, faithfully sending alerts to a distribution list of people who have since changed roles or employers. Two years later it is still watching a server that was decommissioned, and it alerts about that every single night. It has never been thanked, and it has never missed a night.
4. A free trial becomes permanent
Someone installs a trial to diagnose one stubborn problem. It helps. The problem gets solved and the trial period ends. Either the tool keeps working in some reduced mode or a small license gets bought on a credit card to keep it going. It never gets a formal owner, a formal purpose, or a formal place in the documentation. It simply exists, and because it was useful once, nobody wants to be the person who turns it off.
5. A merger doubles everything
Two organizations join. Each has a complete monitoring stack: its own network console, server tool, log platform, and uptime checker. The integration plan handles email, directories, and file shares, because users notice those. Monitoring is filed under "later." Later never gets scheduled, and the combined organization now runs two of everything. Often, each organization's tools watch the other organization's servers by accident once the networks are joined.
6. "Just for now" tools
A shell script that pings the WAN (the wide area network, meaning the link to the outside world) and emails on failure. A phone app someone uses to check the website from home. A spreadsheet of certificate expiry dates with a reminder set. A scheduled task that checks disk space. Each was built "just for now," which is the longest-lived phrase in IT. They are the hardest tools to inventory because nobody thinks of them as tools. And they are the ones most likely to be the only thing watching something important.
Notice the common thread. In none of these stories did anyone ask "what do we already have that does this?" That question is not asked because there is no moment when it naturally comes up. The hardware purchase is about hardware, the project is about the project, and the merger is about everything except monitoring. Sprawl is what happens when a decision that should be made once, centrally, is instead made many times, locally. The people making it each had a good reason and no view of the whole. The fix, later in this series, is mostly about creating that missing moment and giving the whole pile a single owner.
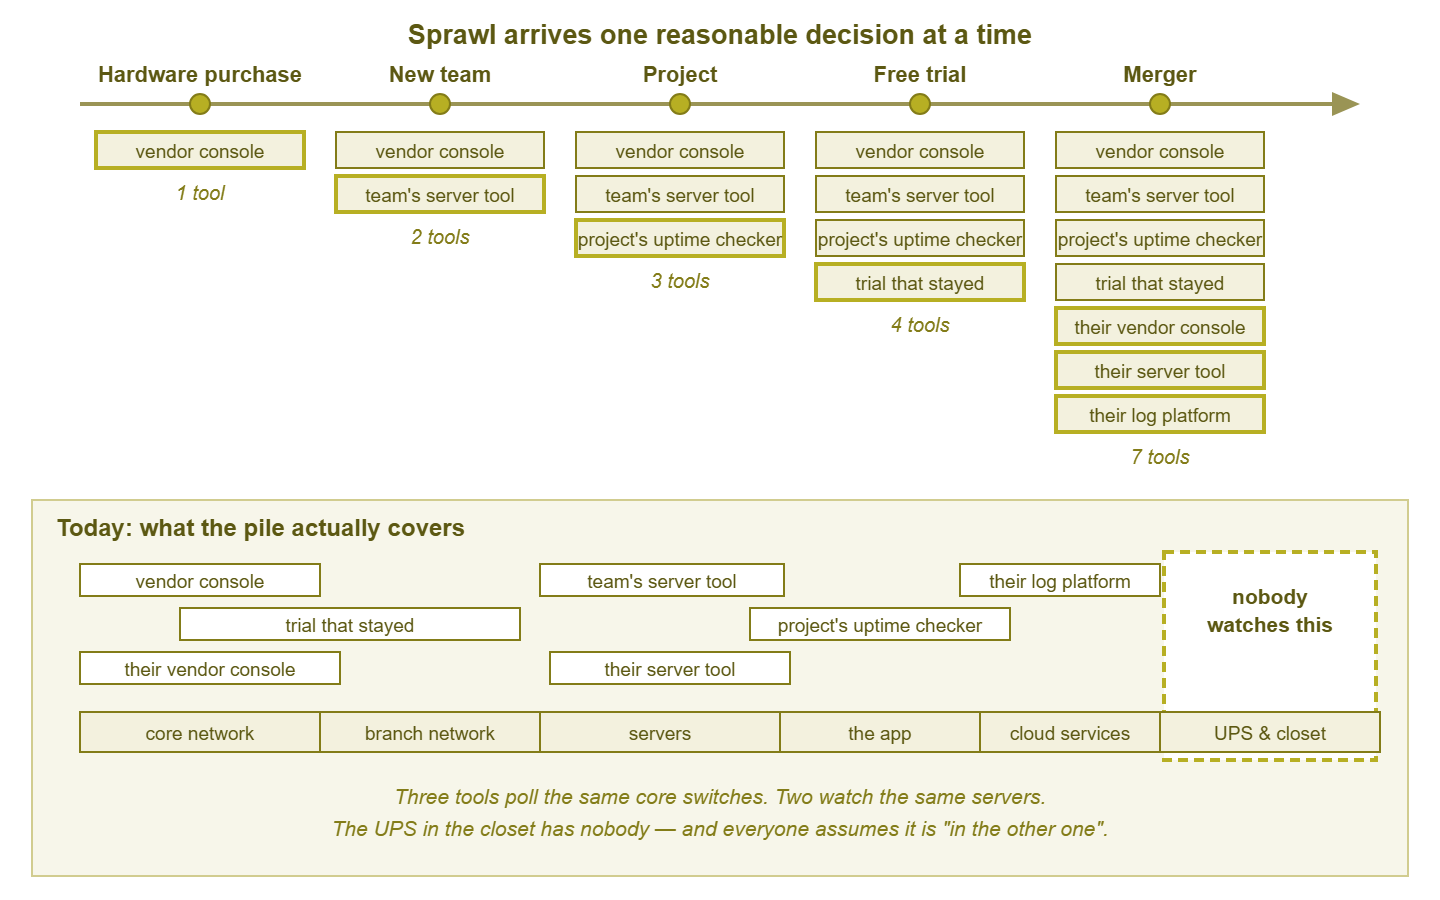
Figure 1: Each event adds a tool for a good reason. The result is triple coverage in some places and a gap in the one place everyone assumed was "in the other tool."
What sprawl costs you
The instinctive objection to a sprawl clean-up is "but they all work." They do. The cost of sprawl is not that any one tool fails. It is what the pile does to your ability to answer simple questions, and to your attention. Here are the costs, roughly in the order you will feel them.
Alerts in five places (and nobody owns the sixth)
Every tool has its own notification path. One sends email. One posts to a chat channel. One has a mobile app that must be installed and logged into. One only shows alerts inside its console, so you find out when you happen to look. One sends text messages to a phone number that belonged to the previous admin. And then there is the sixth place: the shared mailbox that a departed project created, which still receives alerts nobody reads. The question "did anything alert last night?" has no single answer, which in practice means the answer is always "I don't think so."
The gaps between the tools
This is the cost that hurts most, and it is counter-intuitive: sprawl feels like over-coverage but reliably produces under-coverage. Each tool covers what it was bought for. The boundaries between them are where nobody looks. Examples include the UPS in the closet, the branch office router, the certificate on the internal portal, and the management interface of the storage array. Everyone assumes another tool has it. The most dangerous sentence in a post-incident review is "I thought that was in the other one." That review is the meeting after an outage where you work out what actually happened. More tools mean more boundaries, and every boundary is a place for a problem to hide.
At Meridian Parts the server tool watched the servers and the switch console watched the switches. The UPS in the comms closet was assumed to be in one of them. It was in neither. Its batteries had been failing for the better part of a year. And the vendor console that knew this had never been given an email address to tell. When the power blipped one Friday afternoon, the closet went dark and the switches went with it. Both monitoring tools reported the outage promptly and at length. The post-incident review contained the phrase "I thought that was in the other one" four times. The UPS is now in the primary tool, and the phrase has been retired.
Duplicated polling load
Suppose three tools each ask the same core switch the same SNMP questions every minute. The switch does not know or care that the questions come from different tools. Its management CPU, the small processor that answers management requests separately from the traffic-forwarding hardware, answers all three. On busy or older devices, that triple load is enough to make the device slow to respond. Each tool then dutifully reports that as a problem. If you have not thought of polling as something with a budget, the polling load budget explains what each poll costs the device, the poller, and the WAN.
Inconsistent thresholds
A threshold is the line a metric has to cross before a tool raises an alert. Tool A warns when a disk passes 80% full. Tool B warns at 90%. Tool C does not alert at all; it only draws graphs. So a disk at 85% produces a warning from one tool, silence from another, and a slowly reddening graph in a third that nobody opens. You learn to trust none of them, and the disk fills up on a Saturday. Consistent thresholds are easy inside one tool and nearly impossible across five.
Logins, skills, and the bus factor
Each tool is a login to be provisioned and revoked, and a password to rotate. It brings a way of building a check that differs slightly from every other tool's way. It also brings a set of quirks that live in one person's head. The bus factor is the grim old joke about how many people would need to be hit by a bus before nobody could operate something. With sprawl, the bus factor of at least one tool is usually one, and that person is on holiday during the outage.
Renewal money spread thin
Several small renewals are each too small to justify a serious evaluation, so they get approved on autopilot every year. Together they are large enough to have bought proper coverage, but nobody ever sees them together. Support contracts get paid on tools nobody has opened a ticket about. Licenses get renewed for device counts that no longer exist. None of these amounts is scandalous on its own; the pile is.
The incident where three tools disagree
Here is the story that finally convinces most teams. The main application goes slow. The vendor's switch console says the network is fine. The server tool says CPU is normal. The external uptime checker says the site is down. Users say it is "sort of working." The first twenty minutes of the incident are spent arguing about which tool to believe. That is because each one is telling the truth about the thing it can see and none of them can see the whole picture. Sprawl turns troubleshooting into diplomacy, and diplomacy is slow.
Tip: the fastest way to feel the true cost of sprawl is to time your last incident. Measure from "first alert" to "first person looking at the right screen." Sprawl lives in that interval. It is often longer than the actual fix.
Sprawl versus healthy specialization
Now the honest counterpoint: not every extra tool is sprawl. Some tools see things a general-purpose monitor genuinely cannot, and owning them is specialization, not sprawl. The test is simple and has two parts. Does this tool see something the primary tool cannot? And is the overlap deliberate? If both answers are yes, keep it. If the tool mostly duplicates what another tool already does, and the duplication is an accident of history, that is sprawl.
Some worked examples. A packet-capture tool, which records the actual conversations on the wire so you can read them, is not sprawl. Your main monitor tells you an interface is busy, and the capture tool tells you with what. A flow collector, which receives summaries of who talked to whom from your routers, is not sprawl for the same reason. But two tools that both ping every server and both alert when a ping fails are sprawl in its purest form. That is because neither can see anything the other cannot.
| Tool kind | Specialization when... | Sprawl when... |
|---|---|---|
| Packet-capture tool | You use it to read what is inside a slow or suspicious conversation | It is only ever used to see whether a host is up |
| Vendor's own management console | You need the device-specific detail it alone exposes (radio health, array rebuild status) | It is also the only thing alerting on "device down" |
| Flow collector | You need to know who is talking to whom and how much | It duplicates interface graphs the primary tool already draws |
| Log platform | You search and correlate logs from many sources | It has been coaxed into graphing CPU that another tool already graphs |
| External uptime checker | You want the outside-in view your internal monitor cannot get | It is the third tool alerting on the same internal server |
| Second ping monitor | It deliberately watches the primary monitor itself | Almost every other case |
Notice that the same tool can land in either column depending on how it is used. The vendor's wireless console is a fine specialist for radio detail and a poor place for your only "access point down" alert. Specialization is about the tool doing its unique job; sprawl is about the tool also doing everyone else's. If a tool's only alert is "device down", it is not a specialist, whatever it cost.
The same disease shows up inside a single tool, too. A monitoring platform with forty dashboards that overlap, contradict, and belong to nobody is the same problem in miniature. The guide to dashboard sprawl covers that version of it.
The self-assessment table
This is a quick, honest check. Go through the symptoms and answer yes or no for your own environment. There is no scoring formula that would survive contact with reality, but here is a rule of thumb. Two or fewer yes answers means you have specialization, not sprawl. Three to five means the pile is costing you and is worth a clean-up. Six or more means sprawl is probably the biggest single drag on your team's ability to notice problems. In that case, you should treat it as a project rather than a tidy-up.
| Symptom | Yes / No | What it costs you |
|---|---|---|
| You cannot list every monitoring tool from memory | Unknown coverage, therefore unknown gaps | |
| Alerts for the same device arrive from more than one tool | Noise, contradiction, and alerts you learn to ignore | |
| Some alerts go to a mailbox or channel nobody reads | Silent failures that look like success | |
| Two tools use different thresholds for the same metric | Warnings you cannot trust from either | |
| Only one person can operate a given tool | Bus factor of one, usually during the outage | |
| A renewal is paid for a tool nobody logs into | Budget spent on nothing | |
| In the last incident, the tools disagreed about what was broken | Slow diagnosis; time spent arguing with screens | |
| A device class exists that you assume another tool covers | A gap, until the day it is not an assumption | |
| The same device is polled by more than one tool | Wasted device CPU and network traffic | |
| A tool's original owner has left the organization | Orphaned configuration, alerts to nobody |
Print it, fill it in, and keep it. When you come back after a consolidation, the second copy is your before-and-after evidence. That is worth more than any graph when someone asks whether the effort was worth it.
Where to go next
If the table came back mostly "no," you have specialization, and the sensible move is to keep it deliberate. In that case, write down why each tool is there, so the next admin does not have to guess. If it came back mostly "yes," the way out begins with looking, not buying. The next guide, inventorying your monitoring tools, walks you through building the overlap-and-gap map that every later decision rests on. After that, the single pane of glass sets honest expectations for what "one screen" can and cannot mean. Then the consolidation strategy shows how to shrink the pile without creating a new gap. The guide to sunsetting a tool gracefully covers turning something off without losing what it knew. The full series lives at Escaping Monitoring Tool Sprawl. Of my own two tools, one survived the inventory. It turned out to be a specialist, which I had not known when I bought it.
Put this into practice with SysPeep Monitor
If the self-assessment came back with more yes answers than you would like, the way out starts with an inventory, not a purchase. When you do reach the point of picking one platform for the network and server rows, SysPeep Monitor is a candidate worth evaluating. It discovers devices automatically, collects over SNMP, WMI and SSH, and keeps dashboards, maps and alert rules in one web console. The free trial is meant to be run alongside what you already have — not to become tool number eight.
Download Free TrialLearn About SysPeep - All Rights Reserved.