
A Mental Model of Network Visibility: Layers and Vantage Points
I have sat in this meeting more times than I would like. A user says the network is slow. The network admin checks the switches and declares the network fine. The server admin checks the server and declares the server fine. The application person checks the app and — you can guess. Everyone is telling the truth, everyone has data, and the problem is still there. What is happening is simpler than it looks: each person is standing in a different place, and where you stand determines what you can see.
This guide gives you the mental model that dissolves those arguments: the five vantage points from which a network can be observed. A vantage point is just a place to look from, and it matters here because each one sees things no other can. For each of the five you will learn what it can see and what it structurally cannot see. That means not "doesn't bother to," but cannot, ever, by its nature. You will also learn one real problem that only that vantage point catches. Then we will build the cheapest combination that gives a small network decent coverage. Once this model is in your head, "we're monitoring the network" — or the word "visibility" on a vendor's slide — stops being a vague claim. It becomes a specific question: visibility from where?
In this guide
- Where you stand determines what you see
- The five vantage points: device, wire, host, outside, user
- What each one catches that nothing else can
- The summary table
- Combining vantage points on a small budget
- Where to go next
Where you stand determines what you see
Think of a network problem as an incident with five honest witnesses. Each witness saw something real. None of them saw everything. The device itself can tell you how it felt. The wire can show you what actually passed by. The host can open its diary. A test probe can report what a stranger experiences from outside. And the user can tell you whether any of it mattered. No witness is lying, and no witness is sufficient. That is why "the switch says it's fine" and "the app is slow" can both be true at once.
The trap for a new admin is assuming that one tool, planted in one place, sees everything. It cannot — not because the tool is bad, but because observation has geometry. A camera pointed at the front door does not cover the loading dock, no matter how good the camera is. Monitoring tools are the same: each collection method is a camera bolted to one vantage point, inheriting both its view and its blind spots. The skill is not picking the "best" vantage point. It is knowing what each one costs, what it uniquely catches, and how few of them you can get away with combining.
Ashgrove Housing bought a monitoring suite whose opening slide promised "complete visibility across the estate". As the slide suggested, the organization installed the suite on one server polling every switch over SNMP. The suite did that well. Then the tenant-portal service started crashing and restarting itself every twenty minutes. For eleven days the switches reported, accurately, that nothing was wrong with the switches. Tenants rang the housing officers, the housing officers rang IT, and IT looked at a wall of green and said so. The fix, once somebody opened the server's event log, took ten minutes. The slide had not been lying, exactly. It had just been standing in one place.
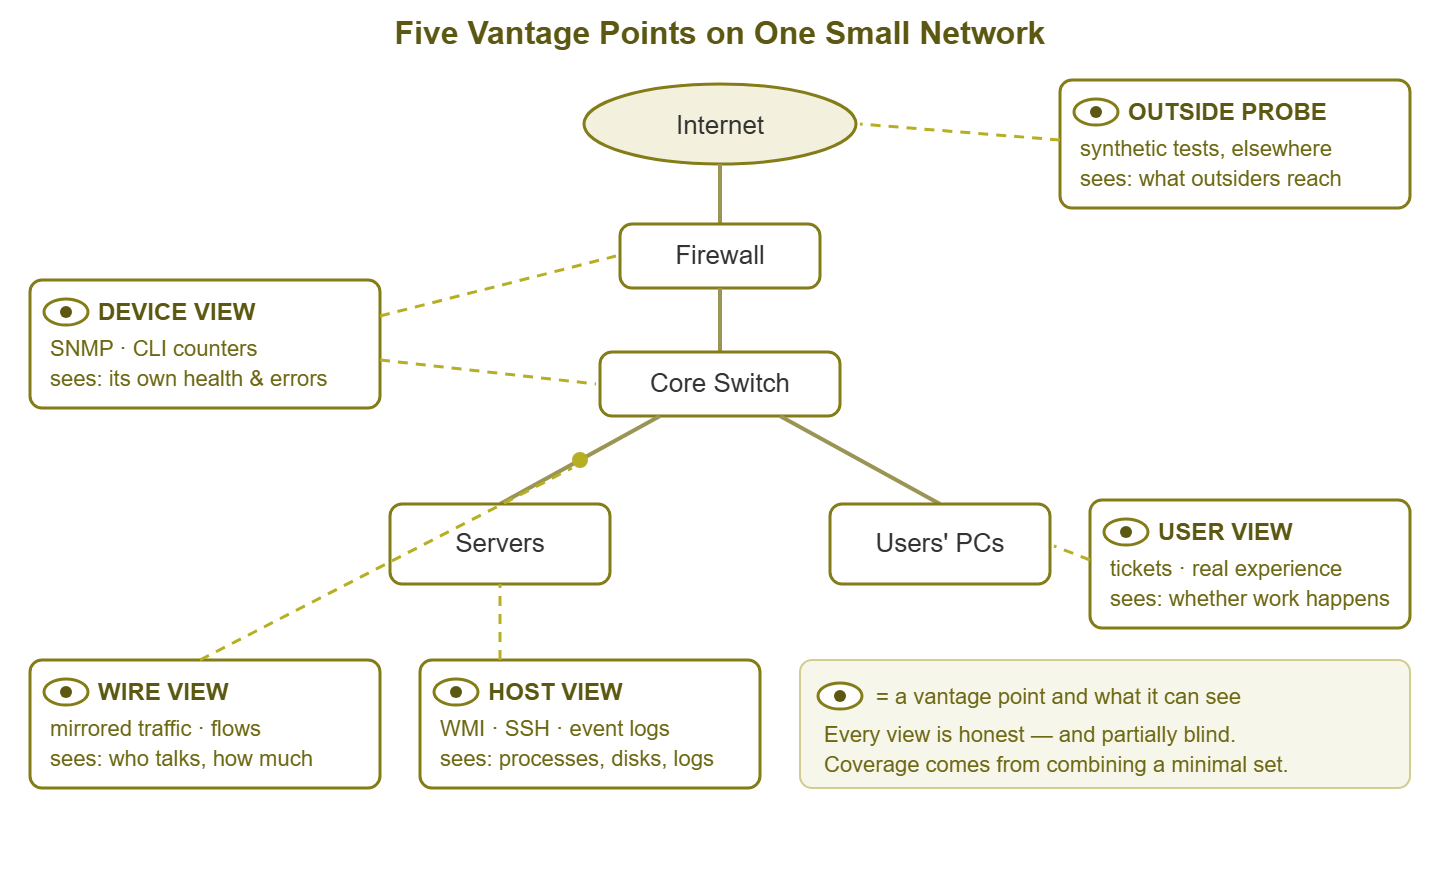
Figure 1: Five vantage points watching one small network. Every eye is honest, and every eye is partially blind — coverage comes from the combination.
Vantage point 1: the device's own view
Where you stand: inside each network device, asking it about itself. This is the view you get over SNMP (Simple Network Management Protocol). SNMP is the standard question-and-answer language that switches, routers, firewalls, printers, and UPS units speak. You can also get this view by logging into a device's command line and running its status commands. It is the self-report vantage point: the device telling you how it feels.
What it can see: everything the device knows about itself, which is a lot. Whether each port is up or down. Counters of traffic in and out of every interface. Counts of errors and discarded packets. CPU load, memory use, temperature, fan speed, power supply status. Its own uptime and configuration. The counters deserve a special mention because they work in a particular way. They are running totals since the device booted, so you learn the rate of anything by reading twice and subtracting. Here is what that looks like when you ask a switch about errors on port 3:
$ snmpget -v2c -c public 10.0.0.2 IF-MIB::ifInErrors.3
IF-MIB::ifInErrors.3 = Counter32: 8194

  ... one hour later ...

$ snmpget -v2c -c public 10.0.0.2 IF-MIB::ifInErrors.3
IF-MIB::ifInErrors.3 = Counter32: 11507
Roughly 3,300 new errors in an hour on one port — the device just confessed to a failing cable or transceiver, in two questions. A transceiver is the small plug-in module at the end of a fibre or copper link. A monitoring system automates exactly this: ask, wait, ask again, subtract, compare to a threshold.
What it structurally cannot see: anything beyond its own skin, and anything about the meaning of its traffic. A switch counts bytes. It does not know which conversation the bytes belong to, which user is responsible, or whether the traffic is a backup or a breach. Its numbers are totals per port, not stories. It also cannot see other devices or judge the health of the path beyond itself. And — the classic catch — it cannot report anything at all while it is down or unreachable, which is precisely when you are most curious.
A problem only this view catches: the dying fan. A switch's cooling fan is failing, and the temperature inside the chassis is climbing week by week toward the shutdown threshold. Nothing about this appears on the wire — the packets flow perfectly. No host notices; no probe from outside notices; users notice nothing until the day the switch cooks itself and the office goes dark. The only witness to a fan, a temperature sensor, a wobbling power supply, or a memory-leaking device process is the device itself. If you do not ask it, nobody will ever know — until everybody does.
Vantage point 2: the wire's view
Where you stand: on the cable itself, watching the actual traffic pass. In practice you get here in two ways. Port mirroring gives you the full packets — every byte of every conversation on that link. Many switches can copy everything crossing one port out to another port, where an analysis machine listens. Flow records are the lighter-weight cousin: many routers and switches can export summaries of each conversation without copying the packets themselves. The summaries show who talked to whom, on which ports, when, and how much. Think of packets as the full security-camera footage and flows as the visitor logbook.
What it can see: the truth about what actually traversed the link. It sees real conversations between real endpoints, exact volumes per talker, and timing. It sees retransmissions (packets sent again because the first copy never arrived) and other signs of a struggling connection. It sees protocols in use — and, for unencrypted traffic, the contents. This is the vantage point that turns "the link is busy" into "the link is busy because of this machine doing this thing." It is also the ground truth that settles arguments: counters can be misread and logs can be wrong, but the wire does not editorialize.
What it structurally cannot see: anything that is not traffic on that particular link. It cannot see inside any device or host. A wire-watcher knows a server answered slowly but not whether the cause was CPU, disk, or an application that paused to tidy its own memory. It sees nothing on the links you did not tap, which on a switched network is almost all of them. And taps do not scale; nobody mirrors every port. Encryption narrows the view further: for most modern traffic you can see who talked to whom and how much, but not what was said. And full capture is expensive to store, so the wire's view is usually a vantage point you visit, not one you live at.
A problem only this view catches: naming the bandwidth thief. The device view (SNMP) tells you the internet uplink has been pinned at 95% since 9 AM. But a counter is a total, so it cannot say who. Checking every host is hopeless if one guest laptop, one misconfigured cloud sync, or one chatty security camera is responsible. A flow export or a capture on the uplink answers in seconds: one workstation, one destination, gigabytes and counting. Whodunit questions about traffic are the wire's home turf, and no other vantage point can answer them directly.
Tip: you do not need a permanent installation to use this vantage point. Most managed switches can mirror a port on demand, and a laptop running a free packet-capture tool makes a perfectly good temporary wire-watcher. Borrow the vantage point when a question demands it, then give it back.
Vantage point 3: the host's view
Where you stand: inside an operating system — a server or workstation — reading what it knows about itself. On Windows this typically means WMI (Windows Management Instrumentation) queries or a small installed agent reading performance counters and the event log. On Linux, it means commands run over SSH (Secure Shell, the encrypted remote command line) or an agent doing the same. This is the diary vantage point: the machine's own detailed account of what it has been doing.
What it can see: everything the operating system tracks, which is the richest detail of any vantage point. Per-process CPU and memory — not just "the box is busy" but which program is busy. Disk space and disk activity. The state of every service. And the event logs: a timestamped record of crashes, restarts, errors, logins, and complaints from every piece of software on the machine. Where the device view offers gauges, the host view offers gauges plus a narrator.
What it structurally cannot see: the network beyond its own network card. A host knows it sent packets. It does not know what became of them or which path they took. It does not know whether a switch two hops away (two devices along the path) is mangling them. It cannot see other hosts, cannot vouch for the infrastructure between itself and its clients. And its view is only as honest as the machine itself — a compromised or sick host writes a sick diary. Coverage is also per-machine by definition: you see only the hosts you instrument, and nobody instruments them all.
A problem only this view catches: the crash-looping service. A line-of-business service crashes and automatically restarts every twenty minutes. Pings answer, because the machine is fine. The port is usually open, so a probe's occasional check passes. The switch counters look normal. Users experience random, unreproducible failures — the worst kind of ticket. The only place this problem is visible as itself is the host's own record. The event log shows crash, restart, crash, restart, with an error code attached, all day long. One look at the diary converts a haunted-network mystery into a ten-minute fix.
Vantage point 4: the outside view
Where you stand: somewhere else entirely — another office, a small rented machine in a cloud, a computer on a home connection. You run synthetic checks against your network: scripted test transactions that imitate a real outsider. Resolve our public name. Connect to the VPN portal (the login page remote staff use to reach the office network). Fetch the website and check the certificate (the credential behind the browser's padlock). This is the mystery-shopper vantage point: a robot pretending to be a stranger, on a schedule.
What it can see: your network as the rest of the world experiences it. That is a genuinely different network than the one you see from inside. It sees public DNS answers as outsiders receive them. DNS, the Domain Name System, is the service that turns names into addresses. The outside answers are often different from internal ones, because many networks deliberately run split DNS. That gives internal and external users different views of the same names. This view also shows firewall rules as they apply to strangers and certificate validity as browsers judge it. It shows the path in from your ISP (internet service provider), with its latency and its bad days. It shows whether "reachable from the internet" is currently true at all.
What it structurally cannot see: anything behind the front door. An outside probe knows the VPN portal stopped answering. It has no idea whether the cause is the firewall, the server, or a cleaner unplugging something in the closet. It tests only the exact things someone scripted, only from the places the probes live, only as often as they run. A check every five minutes can miss a four-minute outage entirely. A probe in one city says nothing about reachability from another. It samples the outside experience; it does not surveil it.
A problem only this view catches: the works-from-inside outage. After a firewall change, an updated rule quietly blocks inbound connections to the VPN portal. From inside, everything is green: the server is healthy (host view), the service is listening, and internal test connections succeed. Internal clients never cross that firewall rule, and internal DNS points them down a different path anyway. Every internal vantage point honestly reports no problem. The first witness is either a synthetic probe on the outside — or a remote employee at 6 AM. You do not get to choose which unless you deployed the probe. "Up from inside" and "up from outside" are separate facts, and only this vantage point tests the second one.
Vantage point 5: the user's view
Where you stand: behind the eyes of an actual human trying to get work done. This vantage point arrives as tickets, complaints, hallway grabs, and the dreaded "is the network slow for you too?" It feels less like monitoring than the others, but it is a data source. It is the only one that measures the thing you are actually paid to deliver: whether work is possible.
What it can see: the end-to-end truth of real workflows, including every component nobody thought to instrument. A user's experience traverses their machine, the wireless, the switches, the servers, the applications, and the internet in one motion. If any link in that chain fails, the user registers it — whether or not you had a check on it. Users also exercise paths no synthetic check covers: the odd legacy app, the month-end report, the meeting room that matters. And only this vantage point can report on importance: which failures actually hurt, versus which are technically real but irrelevant.
What it structurally cannot see: precision, causes, or anything off-hours. User reports have no timestamps ("it was slow this morning"), no numbers ("really slow"), and no location on the chain. "The internet is broken" may describe a dead access point, an expired password, or an unplugged dock. Users report late (after suffering silently), unevenly (one loud voice can outweigh a quiet department), and never at night. Night is when disks fill and backups fail. The user's view is indispensable and unusable as your only instrument. It is a smoke alarm that goes off the day after the fire, somewhere in the building.
A problem only this view catches: the workflow nobody scripted. Your synthetic check loads the login page of the business application every minute — green for months. Users, meanwhile, report that posting an invoice has crawled from five seconds to ninety. No probe tests invoice posting; the server's gauges look adequate; nothing crosses a threshold. The only witness to "this specific human task got slow" was a human doing the task. The lesson is not to abandon synthetic checks. It is to treat recurring user reports as monitoring data, and to promote the workflows they complain about into scripted checks of their own.
The five vantage points at a glance
| Vantage point | You are asking | Typical mechanism | Uniquely catches | Structurally blind to |
|---|---|---|---|---|
| Device | "How do you feel?" | SNMP, device CLI | Hardware sickness: fans, temperature, port errors | Traffic contents; anything beyond itself |
| Wire | "What actually passed by?" | Port mirroring, flow records | Who is using the bandwidth, and for what | Inside devices and hosts; untapped links |
| Host | "What have you been doing?" | WMI, SSH, agents, event logs | Per-process trouble: crash loops, filling disks | The network beyond its own card |
| Outside | "Does it work from out there?" | Synthetic probes elsewhere | Works-from-inside-only outages; cert and DNS surprises | Causes; anything not scripted |
| User | "Could you get work done?" | Tickets, complaints, reports | Failures in workflows nobody instrumented | Precision, timing, causes, off-hours |
Combining vantage points on a small budget
Here is the encouraging part: you do not need all five at full strength. Coverage comes from breadth across vantage points, not depth at one. A modest presence at four points beats a lavish installation at one, because vantage points are complements, not upgrades of each other. (The lavish installation does come with a nicer slide.) A sensible minimal build for a small network, in order:
- 1. Device view, broadly. Enable SNMP on the firewall, switches, UPS, and other network gear, and poll them from your monitoring system. This is the cheapest square footage of visibility in networking. One afternoon of setup gives you reachability, port status, traffic levels, errors, and hardware health across the whole infrastructure.
- 2. Host view, selectively. Add OS-level checks (WMI, SSH, or an agent) on the servers whose failure would generate a crowd at your desk. Check disk space, services, CPU, and memory, and keep eyes on the event log. Skip the workstations for now.
- 3. One outside probe. Use anything that lives outside your building and tests your public front door on a schedule. A machine at a second site or a small cloud instance is plenty. Test the few things outsiders rely on: public DNS, the VPN portal, the website and its certificate.
- 4. A real intake for the user view. Make user reports capturable: a tickets-in-one-place habit, and the discipline of recording when and where. Then mine it — a recurring complaint is a monitoring gap wearing a trench coat. The fix is to promote it into a scripted check.
- 5. The wire view on demand. Do not buy anything yet. Know how to enable port mirroring on your switches, and keep a capture tool on your laptop. Summon this vantage point when a whodunit question arises. If those questions become weekly, that is your signal to make flows or capture permanent.
If steps 1 and 2 sound familiar, they should — they are the machinery behind the first ten checks for any small network. That is this mental model turned into a concrete starter checklist. And a final calibration: even with all five vantage points staffed, gaps remain. These include encrypted payloads, unmonitored segments (sections of the network no check reaches), and the minutes between polls. Knowing where your blind spots are is a discipline of its own, covered elsewhere in Network Monitoring Fundamentals.
Where to go next
The model is brief: a network can be observed from the device, the wire, the host, the outside, and the user. Each vantage point sees something no other can, and each is structurally blind to the rest. Coverage means holding a minimal set of them at once. Next time the "network is slow" meeting convenes, you will hear it differently. You will hear three honest witnesses who each stood somewhere else, rather than three people contradicting each other. Their statements need combining. You may even be the one who asks the only question that ends it, which is "seen from where?" For turning the model into running checks, thresholds, and alerts that behave, the rest of Network Monitoring Fundamentals picks up from here.
Put this into practice with SysPeep Monitor
Two of these vantage points are where SysPeep Monitor lives: the device's view over SNMP and the host's view over WMI and SSH. Auto-discovery finds what is on your network in the first place. Optional lightweight remote probes add a second watching post at another site or segment. While you decide whether you ever need permanent wire-level visibility, the free trial covers those fundamentals from a single Windows machine.
Download Free TrialLearn About SysPeep - All Rights Reserved.