
Where Packets Actually Die: A Layer-by-Layer Tour
"We have packet loss" is the most common network diagnosis and the least useful one. It is the networking equivalent of "the patient is unwell" — true, alarming, and not remotely enough to act on. Somewhere between a user's machine and wherever their data was going, a device received a packet. It either could not or would not pass it along. Until you know where that happened, you cannot fix anything; you can only reboot things hopefully.
Here is the good news: packets do not vanish randomly. They die in a small number of well-known places, for a small number of well-known reasons. Almost every cause leaves evidence behind — a counter that climbs, a log entry, a pattern in when and for whom the loss appears. Finding loss is detective work, and the suspects are surprisingly few.
This guide is a tour of the crime scenes, in order, from the wall jack under a desk all the way out past your ISP. For each place a packet can die you will learn how the death happens. You will learn the fingerprint it leaves (which counter or symptom to look for). And you will get a one-line check that confirms or rules it out. No packet captures required — just counters and a couple of simple tools.
In this guide
- What a "lost" packet actually is
- The map: seven places packets die
- Death spots 1–7, from cable to ISP
- The fingerprint table
- A sensible order to check the suspects
- Where to go next
What a "lost" packet actually is
A packet is one chunk of a conversation. Typically it is up to about 1,500 bytes of data wrapped in addressing information, like a numbered envelope in a long correspondence. Packet loss means an envelope was sent and never arrived. That includes envelopes that technically arrived but were damaged in transit and thrown away on delivery. From the sender's point of view, the result is identical: silence.
One thing surprises every newcomer: dropping packets is allowed. IP networks are "best effort" by design. Every router and switch is permitted to discard traffic when it must. The design assumes the endpoints will cope. TCP copes by quietly re-sending whatever went missing, which turns loss into slowness. Real-time traffic like a voice call cannot wait for a re-send, so loss turns into glitches instead. (How much loss each kind of traffic can tolerate is its own question, covered in the acceptable-loss guide.)
The useful consequence for you: a packet almost never dissolves mysteriously in a cable. It is discarded by a specific device, and network devices are meticulous bookkeepers. Nearly every port keeps running totals of frames it received damaged and frames it deliberately threw away. Those counters are the fingerprints this whole guide is built on. (Reading them in full detail is covered in the interface counters guide; here we only need the headlines.)
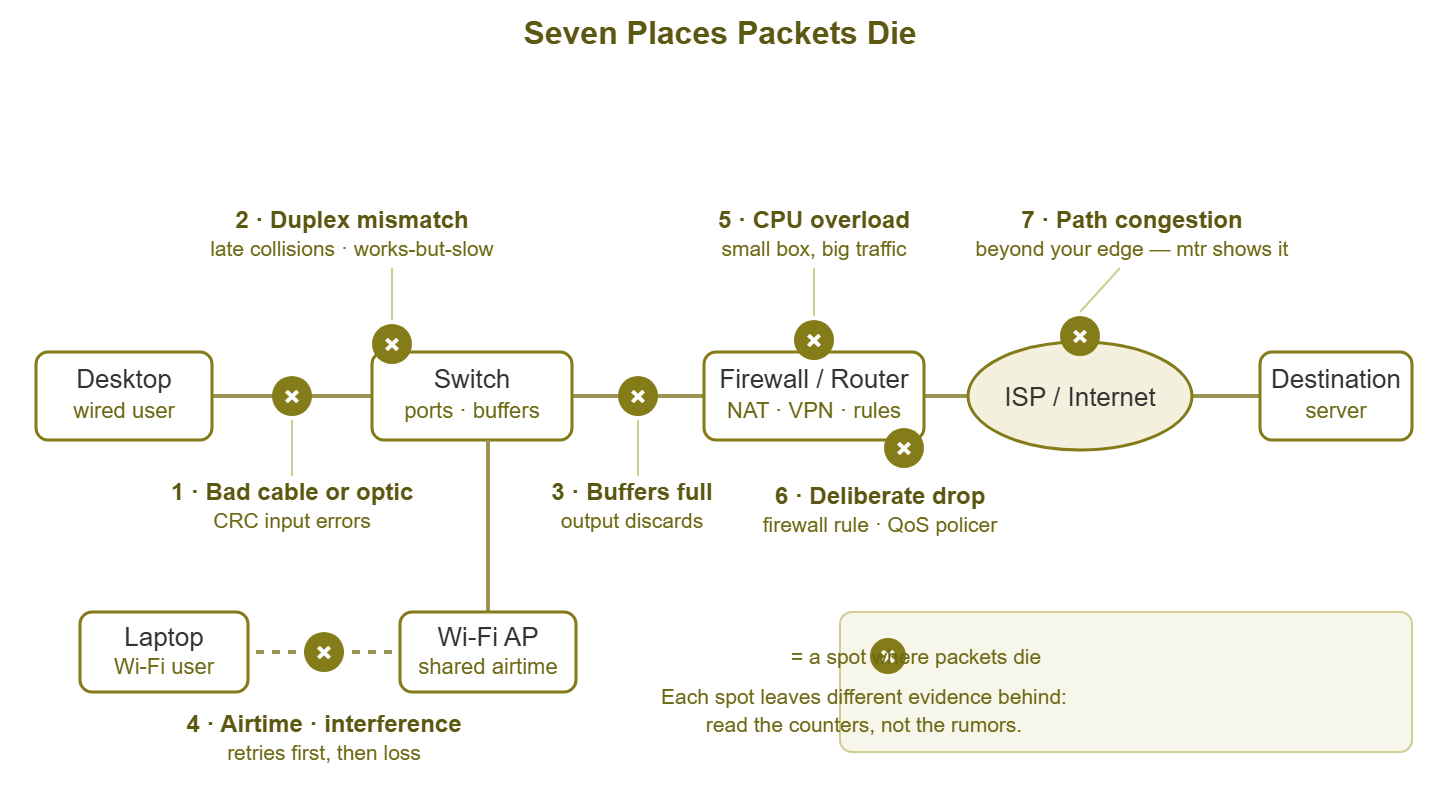
Figure 1: The seven death spots on a packet's journey. Each one leaves different evidence behind.
Death spot 1: A damaged cable, connector, or optic
How it happens: copper network cable works because its wire pairs are twisted with fussy precision. Anything that disturbs that geometry lets noise corrupt the bits in flight. A cable may be kinked around a desk leg, crushed under a cabinet, or crimped badly onto its plug. It may be run too close to power lines or a motor, or simply run too far. All of these produce a link that mostly works. Fiber has its own versions: a speck of dust on a connector face or a bend tighter than the fiber tolerates. Or there is an aging transceiver (the plug-in optic module) whose laser is slowly dying.
Here is the part that makes this detectable. Every Ethernet frame ends with a checksum called the FCS (frame check sequence). It is computed with math called a CRC (cyclic redundancy check). The sender calculates it from the frame's contents; the receiver recalculates it on arrival. If even one bit was flipped on the wire, the numbers disagree, and the receiver discards the frame. The receiver has no way to know which bit lied. The packet died of corruption, and the receiving port wrote it down.
The fingerprint: input errors, specifically CRC errors, climbing on the port at the receiving end of the damaged run. On a typical switch CLI it looks like this:
GigabitEthernet0/12 is up, line protocol is up
  ...
  2371 input errors, 2344 CRC, 27 frame, 0 overrun   <-- the fingerprint
  0 output errors, 0 collisions
Users on the far side of a dirty link report vague, maddening slowness. The damage scales with traffic, so browsing feels fine while big file copies crawl and video calls stutter.
Confirm it: swap in a known-good patch cable (or clean and reseat the optic) and watch whether the CRC counter stops climbing.
Tip: errors are counted by the receiver, and each direction of a cable is its own journey. A damaged pair can corrupt traffic flowing one way while the other way stays clean. So when a link is suspect, read the input-error counters at both ends before declaring it innocent.
Death spot 2: Duplex mismatch, the classic
How it happens: a link running full duplex lets both ends transmit at the same time, like a phone call. Half duplex is a walkie-talkie: one talker at a time, and simultaneous transmissions "collide" and must be retried. Modern links negotiate all this automatically — unless a human interferes. The classic mistake is hard-coding one end while the other end stays on auto. Say, a server NIC is forced to full duplex, a leftover from ancient troubleshooting advice. The auto side, hearing no negotiation partner, is required to fall back to half duplex. Now one end politely waits its turn while the other transmits whenever it likes.
The result is a link that lies to you. It comes up. Light traffic works. Then, under real load, the two ends talk over each other constantly. The half-duplex side keeps detecting collisions and aborting. The full-duplex side keeps receiving mangled fragments. Throughput collapses to a fraction of the link speed. "The network is up but everything is slow" is this fault's catchphrase. This fault has wasted more admin-hours than nearly any other misconfiguration in networking history.
The fingerprint: late collisions appear on the half-duplex side. These are collisions detected after the frame's first 64 bytes. On a healthy, properly sized link, that should essentially never happen. They are paired with CRC errors and runts (truncated fragments) on the full-duplex side. Loss and slowness that get dramatically worse under sustained transfer complete the picture.
Confirm it: read the negotiated speed and duplex on both ends of the link. Use a show interfaces status on the switch and ethtool eth0 on a Linux host. If one says full and the other says half, you have found it. The fix is almost always: set both ends back to auto.
Death spot 3: Full buffers — congestion inside a switch or router
How it happens: when frames arrive for an output port faster than that port can send them, the device parks the excess in a memory queue called a buffer. Buffers are finite. When one fills, the device does the only thing it can. It discards newly arriving frames until space opens up (engineers call this tail drop). Nothing is broken. The device is healthy, and the cables are perfect. There is simply more traffic than the exit can carry, and the overflow dies.
This happens in predictable places. An access switch with dozens of gigabit ports funneling into a single gigabit uplink is oversubscribed by design — fine on average, ugly at peak. A fast server sending to a slower client (a ten-gigabit NIC filling a one-gigabit access port) creates the same squeeze at the speed step-down. And watch out for microbursts. Traffic that saturates a port for a few milliseconds at a time can drop plenty of packets. Meanwhile your utilization graph — averaged over minutes — swears the link was half idle.
The fingerprint: output discards (some vendors say "output drops") climbing on the congested egress port — classically the uplink — with zero input errors anywhere. Discards without errors is the signature of congestion: the frames were perfect; there was just nowhere to put them. The loss also keeps office hours, tracking your busy periods.
Confirm it: read the output-discard counter on the suspect uplink during the busy hour and again during a quiet one. If it only grows when traffic peaks, you are looking at congestion, not damage.
Death spot 4: Wi-Fi — contested airtime and interference
How it happens: wireless is a shared, half-duplex medium. On a given channel, only one device can transmit at a time, and every client plus the access point competes for that airtime. Add interference: a neighbor's network on the same channel or non-Wi-Fi noise sources in the same spectrum. Add distance, walls, and clients clinging to a far-away AP at low data rates. With all that, frames get corrupted or collide on the air constantly. This is normal; radio is a hostile place.
Wi-Fi's saving grace is that it expects this: the 802.11 protocol retransmits lost frames at the link layer, automatically, several times if needed. So mild wireless trouble does not show up as packet loss at all — it shows up as latency and jitter while retries quietly succeed. Only when conditions are bad enough that retries run out does the frame finally die and become loss your tools can see. Wireless "loss" is therefore the visible tip of a much larger iceberg of retries.
The fingerprint: loss only affects wireless users and varies by location ("it's bad in the conference room") and time of day. Meanwhile every wired counter on the path is clean. On the AP or controller side, high retry rates and low client data rates tell the same story.
Confirm it: run the same loss test twice from the same desk — once on Wi-Fi, once plugged into the wall. The difference between the two results is the radio's contribution. (Wireless deserves its own toolbox, and gets one in the Wi-Fi loss guide.)
Death spot 5: An overloaded CPU on a small router or firewall
How it happens: big switches forward traffic in dedicated silicon that never gets tired. Small routers, firewalls, and all-in-one boxes forward much of their traffic in software, on a modest CPU. That CPU pays a per-packet price for every feature you enabled. Address translation, VPN encryption, content inspection, connection tracking: each one costs cycles. When traffic exceeds what the processor can chew through, packets queue up waiting for CPU time and then die when the queues overflow. This happens on every interface at once, because the bottleneck is the brain, not any port.
The textbook version of this story: the office upgrades to a faster internet plan, and mysterious loss appears. The old firewall, sized comfortably for the old speed, is now being asked to inspect and translate more traffic than its processor can handle. Nothing failed; the box simply hit its ceiling. Deep-inspection features have the same effect. A firewall that forwarded happily at full line speed can drop packets after one checkbox turns on per-packet scanning.
The fingerprint: loss occurs on everything through the device while its interface counters stay clean. This correlates with the device's own CPU sitting at or near 100% during the bad periods. A telltale extra: the box's own management interface gets sluggish at the same time, because your session is competing for the same starved processor.
Confirm it: watch the device's CPU graph while reproducing the load (a couple of large downloads will do). If loss tracks the CPU peaks, you have your culprit.
Death spot 6: Deliberate drops — the network obeying orders
How it happens: not every dead packet is an accident. Some are executions. A firewall rule that denies traffic usually drops it silently, by design. To a troubleshooter that looks exactly like loss. A QoS policer enforces a rate limit the blunt way. Traffic over the configured rate is discarded on the spot (unlike a shaper, which queues and delays it). Carrier circuits often police you too — send faster than your contracted rate and the excess quietly dies at the provider's edge. Add storm control on switch ports and rate limits on ICMP, and there is a whole category of loss that is really policy.
This category is worth checking early, because it has a uniquely embarrassing failure mode. You spend hours hunting a "network problem" that turns out to be a rule somebody configured on purpose. It may have been you, possibly years ago. The ICMP rate limiting deserves special mention. Many devices deprioritize or cap their ping responses, which makes measurements show loss that user traffic never experiences. That trap is dissected in the measurement guide.
The fingerprint: selectivity. Accidental loss is indiscriminate; policy loss discriminates — one application, one port, one destination, or one traffic class suffers while everything alongside it sails through. On the enforcement device, the evidence is explicit: deny entries in the firewall log, or drop counters incrementing under the matching policy or policer.
Confirm it: search the firewall logs and QoS policy counters for the specific traffic that suffers. Deliberate drops are almost always logged or counted somewhere, because the device is proud of its work.
Death spot 7: Beyond your edge — the ISP and the path
How it happens: past your router, a packet crosses your ISP's access network and their core. Then it crosses a peering point where your provider hands traffic to another, and finally the destination's own network. Every one of those is somebody's switch with somebody's buffers. And any of them can be congested — most commonly the shared access segment during residential peak hours, or an under-provisioned link between providers. The mechanics are the same buffer overflow as death spot 3. The difference is that these counters belong to someone else, and you will never read them.
The fingerprint: a process of elimination plus one positive sign. Elimination: every counter inside your network is clean, and the loss affects traffic to outside destinations from everywhere on your LAN. The positive sign comes from a per-hop tool like mtr, run from a machine near your edge. Genuine path loss appears at some hop out in the internet and continues on every hop after it, including the final one. Loss that appears at one middle hop and vanishes afterward is just that router deprioritizing pings — noise, not signal. Time-of-day rhythm (fine at 7 AM, ugly at 8 PM) points the same direction.
Confirm it: run mtr to an affected destination and check whether loss starts mid-path and persists to the last hop. Then collect a few timestamped runs, because that is the evidence your ISP's support queue will ask for.
The fingerprint table
| Where packets die | Fingerprint it leaves | First check |
|---|---|---|
| Damaged cable / connector / optic | Input errors (CRC) rising on the receiving port | Swap a known-good cable; watch the counter |
| Duplex mismatch | Late collisions one side, CRC + runts the other; collapses under load | Compare speed/duplex on both ends |
| Full buffers (congestion) | Output discards on the egress port; zero errors; tracks busy hours | Read uplink discards at peak vs quiet |
| Wi-Fi airtime / interference | Wireless users only; varies by place and time; wired path clean | Same test wired vs wireless, same desk |
| Router/firewall CPU overload | Loss through the device on all ports; CPU pegged; clean interfaces | Watch CPU while reproducing load |
| Deliberate drops (policy/QoS) | Selective: one app, port, or destination; policy counters increment | Check firewall logs and policer counters |
| ISP / path congestion | Internal counters clean; mtr loss starts mid-path and persists to the end | mtr from the edge; save timestamped runs |
Tip: causes stack. A marginal cable and an oversubscribed uplink can be killing packets on the same path at the same time. That is why "I fixed something and it's still slow" happens so often. Work the fingerprints one at a time: fix the first cause you confirm, re-measure, and only then decide whether you are done.
A sensible order to check the suspects
When loss lands on your desk, resist the urge to ping randomly. This order finds the culprit fastest, because it narrows the search before it inspects anything:
- Step 1 — establish the blast radius. One user, one area, or everyone? One application or everything? Wired, wireless, or both? Each answer eliminates half the map. One wired user points at their cable and port. Everyone-at-peak points at an uplink or the edge. One application points at policy.
- Step 2 — walk the counters along the path. For each port the affected traffic crosses, read input errors and output discards. Errors mean physical damage (spot 1) or duplex (spot 2); discards mean congestion (spot 3); clean counters push the investigation onward.
- Step 3 — verify duplex on any link the errors implicate. Ten seconds to check both ends; a career's worth of regret if skipped.
- Step 4 — check CPU on every small box in the path. Especially the internet edge (spot 5).
- Step 5 — check policy. If the loss is selective about what it hurts, go straight to firewall logs and QoS counters (spot 6).
- Step 6 — look beyond the edge. If everything inside is clean, run
mtroutward and start building the evidence file for your ISP (spot 7). - Step 7 — if wireless is involved, split the problem. The wired-versus-wireless test from spot 4 tells you which half of the network to keep interrogating.
Where to go next
You now have the map: seven places packets die, each with a fingerprint and a fast check. The natural next questions include how much loss actually matters for each kind of traffic. That is answered in the thresholds guide. How to measure loss without fooling yourself is covered in the measurement guide. What to do about each cause once confirmed is catalogued in the remediation guide. The rest of the Packet Loss topic collects them all in one place.
Put this into practice with SysPeep Monitor
Every fingerprint in this tour is a counter or metric a monitoring system can watch for you. SysPeep Monitor discovers your switches, firewalls, and routers. It polls their interface error and discard counters and device CPU over SNMP. It alerts you when a counter starts climbing. So you learn about the dying cable before the users do. The free trial installs on any Windows machine in minutes.
Download Free TrialLearn About SysPeep - All Rights Reserved.