
Synthetic Checks for Hosted Services: Testing from Where Users Sit
The vendor's status page says the CRM (the customer relationship management system, where sales keeps its records) is fine. The vendor's own monitoring, running from inside the vendor's own data center, agrees. Meanwhile your sales team cannot load a single record from the office, and the branch on the other side of town is somehow fine. Nobody is lying. They are all answering a different question from the one your users are asking. The users' question is not "is the service up?" It is "is the service up from here?"
A synthetic check is how you answer that second question on purpose. It is a small scripted test that pretends to be a user. It looks up the name, connects, loads the page, and checks that the right thing came back. It does this again every minute from the places your people actually sit. When it fails, you know before the tickets arrive. When it fails from one place and passes from another, you know roughly where the problem is before you have opened a single tool. The first one I ever built ran from the monitoring server in the data center. It told me, reliably, that the data center could reach the internet. The office could not.
By the end of this guide you will be able to build those checks in layers, from a simple name lookup up to an authenticated step. You will learn to time each stage so you know which one broke, and choose where to run the checks from. You will also learn to test logins without creating a security problem and design alerts that confirm before they wake anyone up. This guide assumes you already have a list of which hosted services matter; if not, start with the dependency inventory.
In this guide
- What a synthetic check is, and what it is not
- The five check levels
- Timing every stage
- Vantage points: where the checks run from
- Authenticated checks, done safely
- Frequency and rate-limit etiquette
- Alert design: confirm before you page
- A check-design table by service tier
- Where to go next
What a synthetic check is, and what it is not
Monitoring people split "is it working?" into two families. Real-user monitoring watches what actual people experience, by collecting data from their browsers or clients. It is honest but passive: if nobody is using the CRM at 6 AM, you learn nothing until the first person tries. Synthetic monitoring is the active cousin. A script performs a fixed, repeatable action on a schedule, whether or not any human is around. It records whether it worked and how long it took. Because the action never changes, any change in the result is a signal.
The word "synthetic" just means "artificial user." The check is not a real person, so it cannot tell you the app is confusing or the new button is ugly. What it can do is prove, every minute, that the sequence of things a user needs to get work done still happens. It proves that from wherever the check runs. That location is the whole point. A check from a cloud server proves the service is up for the world. Only a check from your office proves it is up for your office. You may already know the difference between a device answering pings and a service actually working. Ping Up vs. Service Up makes the same argument for on-premises gear, and every word of it applies here too.
One more thing a synthetic check is not: a load test. It should be light, polite, and indistinguishable from one user opening one page. You are borrowing the vendor's service to measure your own path to it, and the etiquette section below takes that seriously.
The five check levels
A user opening the CRM performs a chain of steps without noticing them. A good synthetic check tests the chain one link at a time, because each link fails differently and points somewhere different. Build them in this order; each level assumes the one before it passed. The layering is the same one used for any website check, described in Layers of a Web Check. Here it is applied to services you do not own.
Level 1: the name resolves
Ask your DNS resolver (the server that turns a name into an address) for the service's hostname and confirm an address comes back. If this fails, nothing else matters, and the fault is either your resolver, your ISP's (internet service provider's) resolver, or the vendor's DNS host. Resolve the real hostnames your users hit — the login name, the app name, the API name. The API is the door the service opens for other programs rather than people. Do not use the vendor's marketing site. That is often hosted somewhere else entirely and is the one page guaranteed to load during an outage.
Level 2: TCP and TLS connect
Open a TCP connection (the basic connection protocol beneath almost all web traffic) to the address on port 443. That is the standard port for encrypted web traffic. Complete the TLS handshake (the negotiation that sets up encryption and presents the vendor's certificate). A TCP failure with a working DNS answer usually means a firewall, a routing problem, or a dead front-end on the vendor's side. A TLS failure with a working TCP connection points at certificates. They might be expired on their side, or there might be an inspecting proxy on yours. Or the machine running the check might have a wrong clock. Record the certificate's expiry date while you are there.
Level 3: HTTP status
Request a page and look at the HTTP status code, the three-digit number every web server returns. HTTP, the Hypertext Transfer Protocol, is the language browsers and web servers speak. A code in the 200s means success. Codes in the 300s mean "look over there" (redirects, which are normal for login pages). Codes in the 400s mean the server understood you and refused. Codes in the 500s mean the server itself is unwell. A stream of 500s from the vendor is the clearest "it's them" signal a check can produce. A 403 that appears only from the office is often your web filter or an IP address the vendor has blocked.
Level 4: content match
Look inside the response for a string that only the healthy page contains: the page title, a sign-in button label, a known footer phrase. This catches the outage that returns a perfectly cheerful status 200 along with a page reading "We'll be right back." Also check for the absence of known bad strings, such as the vendor's maintenance banner text or your own proxy's block-page wording. Choose stable markers, not layout details that the vendor will redesign next month.
Level 5: an authenticated step
Everything above proves the front door opens. It does not prove anyone can walk through it. The last level exercises sign-in: at minimum, confirm the login page loads and redirects to your identity provider correctly. That tests the single sign-on path without any credentials at all. A fuller version logs in with a dedicated test account or calls an API with a test token and confirms real data comes back. This is the level that catches the outage users actually notice — "the site loads but I can't get in." It is also the level that needs the most care, which gets its own section below.
Timing every stage
Pass or fail is only half the information. The other half is how long each stage took. A service that is "up" but taking eight seconds to show a login page is down as far as your users are concerned. The slow stage also tells you where the trouble is. Most checking tools can report per-stage timings. The command-line tool curl, which ships with current Windows releases and most Linux systems, shows the idea plainly:
curl -s -o NUL -w "dns=%{time_namelookup} connect=%{time_connect} tls=%{time_appconnect} firstbyte=%{time_starttransfer} total=%{time_total} status=%{http_code}\n" https://app.crm.example.com/login

dns=0.018 connect=0.041 tls=0.097 firstbyte=0.284 total=0.301 status=200
Each number is measured from the start of the request. So the stages are cumulative: DNS took 18 milliseconds, and the TCP connection completed at 41. The TLS handshake finished at 97, and the first byte of the response arrived at 284. The whole thing was done at 301. Subtract neighbors to get the time each stage took on its own. On Linux, replace NUL with /dev/null. Run this a few times on a normal day and write down the typical values. Those are your baseline, and every future complaint gets compared against them.
| Stage | Measures | When it balloons, suspect |
|---|---|---|
| DNS | Name lookup | Your resolvers (slow forwarders, failing upstream), or the vendor's DNS host |
| Connect | TCP handshake to the address | The network path: your ISP, congestion, a distant or overloaded vendor front-end |
| TLS | Certificate exchange and encryption setup | An inspecting proxy in the middle, certificate revocation lookups, an overloaded vendor edge |
| First byte | Server think time before it starts answering | The vendor's application or database; this is the classic "it's them" stage |
| Total | Everything, including download | Large responses over a thin link; a slow branch connection |
The pattern to learn: when DNS and connect are normal but first byte is huge, the packets are arriving fine and the vendor is thinking slowly. When connect is huge and first byte is normal once connected, the road is congested and the destination is fine. Two numbers, two completely different phone calls.
Vantage points: where the checks run from
A vantage point is simply a place a check runs from. One vantage point tells you whether the service works from there. Several vantage points, compared, tell you where a failure lives, because each one crosses a different set of networks on the way to the same destination. Four are enough for most organizations, working outward from your own LAN (local area network):
- The office. Your central monitoring server, sitting on the main LAN behind the main firewall, using the same DNS resolvers your users use. This is the vantage point that experiences exactly what headquarters experiences.
- Each branch. A lightweight probe at every site with its own internet link. If the branch reaches the internet through headquarters, its probe still matters. It tests the site-to-site link and the branch LAN, which the office probe cannot see.
- A remote-worker representative. A small probe on a home connection, or an agent on a volunteer's laptop. It crosses none of your network, only a consumer ISP and the internet. It is the closest thing you have to "what does the world outside our firewall see?" that still behaves like one of your users.
- An outside point. A tiny virtual machine at a cloud provider, or an external checking service, in a different region from your office. It is the control group: it crosses nothing you own and nothing your ISP owns.
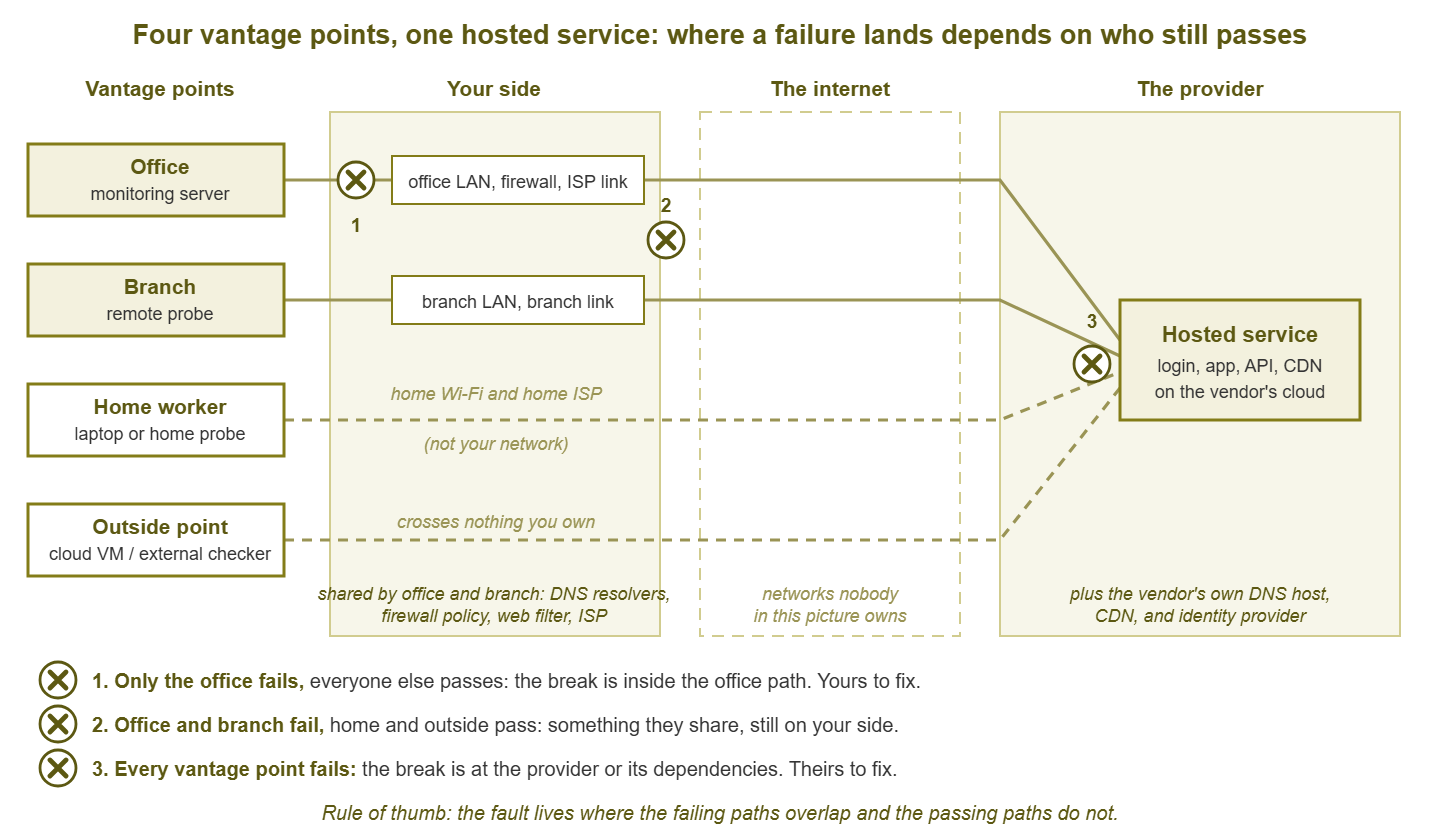
Figure 1: The same service checked from four places. The fault lives where the failing paths overlap and the passing paths do not.
The comparison logic is the entire value of the exercise. If only the office fails, the break is somewhere in the office path: LAN, firewall, web filter, DNS resolver, or ISP link. In that case, it is yours to fix. Suppose the office and every branch fail while the home worker and the outside point pass. The break is then in something those sites share — a common DNS forwarder, a firewall policy, a single ISP. It is still yours. If everything fails everywhere, the break is at the provider or one of its dependencies. In that case, the honest next step is a vendor ticket and a message to your users. The isolation playbook turns this into a ten-minute procedure; the checks are what make the procedure fast.
At Meridian Parts the login check for the hosted order system went red from all four vantage points at 08:52 on a Monday. The vendor's status page stayed green until 09:03. In those eleven minutes the help desk had posted a notice, and the vendor ticket was open with the stage timings attached. Nobody had touched the firewall. The post-incident note recorded that the status page had been "subsequently updated". The check took an afternoon to build and has paid for itself roughly once a quarter since.
Tip: the outside point earns its keep the first time a vendor says "we see no problem." Their monitoring runs from their side of the internet; your outside point runs from a third place. When your office fails, your outside point fails, and their page is green, you have evidence that the problem is bigger than your building. You also have a much shorter support call.
Authenticated checks, done safely
A login check is the most useful and the most dangerous check you will build, because it involves a credential that works. Treat it like the small security project it is.
- 1. Never use a real person's credentials. Not yours, not the intern's, not the shared "admin" account. If the check's credential leaks or gets locked out, the damage should be limited to the check.
- 2. Create a dedicated test account with the fewest rights that still prove the point. A user who can sign in and view one harmless record is enough. It should not be an administrator. It should not be able to see customer data if a lesser role will do. It should be clearly named so it stands out in audit logs.
- 3. Store the secret properly. The password or token lives in your monitoring tool's credential store or a secrets manager. It never lives in a plain-text script, a scheduled task's arguments, or a wiki page. Rotate it on the same schedule as other service accounts.
- 4. Prefer tokens and health endpoints over full logins. Many services offer an API key or a health URL precisely so that machines can ask "are you alive?" without a browser login dance. An API call with a read-only token that returns a small piece of real data is a cleaner authenticated check than scripting a web form. And it does not fight with multi-factor prompts.
- 5. Respect the vendor's terms. Some providers forbid automated browser logins or scraping in their terms of service; some rate-limit and then block addresses that look like bots. Read the terms or ask your account contact. A vendor that offers a documented health endpoint is telling you how they would like to be checked.
- 6. Tell security and the app owner. A test account that logs in every five minutes from four locations looks exactly like something suspicious. Document it, whitelist it in your own alerting, and make sure the vendor's login-anomaly features will not lock it out from the branch's unfamiliar address.
- 7. Watch the account's own health. Passwords expire, tokens get revoked, and conditional-access rules change. Suppose an authenticated check fails at exactly the same moment for every vantage point and nothing else is wrong. The first suspect is then the test credential, not the service.
If the vendor gives you no safe way to authenticate automatically, stop at level 5's lighter form. In that case, load the login page and confirm it redirects to your identity provider. That proves the SSO handshake starts correctly, which is where a surprising number of "can't log in" outages actually break. It needs no credential at all.
Frequency and rate-limit etiquette
How often should a check run? Often enough that you learn about an outage before users do, rarely enough that you never become the outage. For an unauthenticated check against a critical service, once a minute from the office is a sensible default. Every couple of minutes from branches is fine. Authenticated checks are heavier for the vendor and for you, so run them every five to fifteen minutes. Anything below Tier 1 can run every five minutes or slower without losing much.
Whatever the interval, be a polite guest. Set a descriptive user-agent string (the label a browser or script sends to say what it is). That way, the vendor can see who you are if they look. Stagger the vantage points so four probes do not hit the same login page in the same second. Back off when a check fails: if the service is struggling, retrying every ten seconds from every site helps nobody and may get your address blocked. And never let a "quick" check pull a large report or trigger a real workflow; the check's job is to prove the path works, not to do work.
Alert design: confirm before you page
A check that fails once is information. A check that fails and immediately pages someone at 3 AM is a career-shortening decision. Single failures happen constantly: a lost packet, a vendor node restarting, a DNS answer arriving a hair late. Two habits keep synthetic alerts trustworthy.
First, confirm in time. Require two or three consecutive failures before the check is considered down. For a one-minute check that adds two minutes of delay, which is nothing compared with the trust you keep.
Second, confirm in space. When the office check fails, do not page yet; look at the other vantage points. If the outside point still passes, the alert should say so and be routed as "our side," to whoever fixes firewalls and links. If every vantage point fails, route it as "provider," to whoever opens vendor tickets and writes user communications. Same check, two very different alerts, and the difference is decided automatically by comparing vantage points rather than by a sleepy human guessing.
Two smaller rules. Use dependencies so that when the internet link or the DNS resolver is down, the thirty service checks behind it stay quiet instead of each paging separately. And put the diagnosis in the alert text: which service, which level failed, which vantage points agree, and the stage timings. An alert that reads "CRM: TLS handshake failing from office only; branch, home and outside pass" has done most of the troubleshooting before anyone opens a laptop.
A check-design table by service tier
Pulling it together, here is a starting design keyed to the tiers from your dependency inventory. Treat the intervals as defaults to tune, not commandments.
| Tier | Levels | Vantage points | Interval | Alert rule |
|---|---|---|---|---|
| 1 (business stops) | 1–5, including an authenticated step or an SSO-redirect check | Office, every branch, remote-worker probe, outside point | 1 min unauthenticated; 5–15 min authenticated | 3 consecutive failures; page immediately, routed by vantage-point pattern |
| 2 (painful, workaround exists) | 1–4 | Office and outside point; branches if they have their own links | 5 min | 3 consecutive failures; alert during business hours, ticket otherwise |
| 3 (annoying) | 1–3 | Office only | 15 min | Notify only; investigate when a user also reports it |
| Shared dependencies (DNS, identity provider, internet link) | 1–3, plus the IdP login page | All vantage points | 1 min | Page immediately; suppress the checks that depend on them |
Notice the last row. The identity provider, your DNS resolvers, and your internet link are not services users think about. But they are the ones whose failure makes everything else look broken. Checking them first, from everywhere, at the highest frequency, is the cheapest coverage on the whole table.
Where to go next
You now have checks that test the chain a user actually walks and time each link of it. They run from the places users sit, sign in safely, and alert only when more than one place agrees. That is the raw material for the rest of Is It Us or Is It Them? Monitoring SaaS Reachability. The other guides cover reading the vendor's status page against your own data and running the isolation playbook when a check goes red. They also cover telling users what is happening without guessing. The vendor's page will go on saying the service is up. Your checks will say whether it is up from here, which was the only question anyone in the building was asking.
Put this into practice with SysPeep Monitor
Vantage points are only useful if you actually have them. SysPeep Monitor runs as a central service on one Windows machine and adds lightweight remote probes for your branches and other segments. That gives you monitoring from where users sit that reports to a single web console. Its dependency rules keep thirty downstream alerts quiet when the link or the DNS server is the real problem. The free trial installs in minutes.
Download Free TrialLearn About SysPeep - All Rights Reserved.